silver support and resitancelook for 300 if it close 295-297 strongly on up 1hr time frame its bullish , if get rejections exit at given lines
ETF market

Retail investor behavior changes post-20251. Retail Markets Are Evolving — Not Repeating Old Patterns
The retail investor segment — once dismissed as undisciplined, speculative, or marginal — has matured into a structurally relevant market force. Retail participation now influences not only trading volumes but also broader asset flows and sentiment. Research in 2025 shows that retail investors are making more strategic decisions and timing markets better than stereotypes suggest, challenging conventional assumptions about “amateur” investors.
This evolution is not uniform globally, but common themes emerge across regions, asset classes, and platforms.
2. Demographic Shifts: Younger, Tech-Native Investors Dominate
One of the most profound changes in retail investing post-2025 is the demographic profile of participants:
Gen Z and Millennials are engaging earlier — many starting to invest in their late teens or early 20s — far sooner than previous generations.
Younger investors are more receptive to AI-assisted advice, open to automated portfolio guidance, and more comfortable with digital ecosystems.
This shift not only increases the number of retail accounts but reshapes risk preferences, preferences for asset types, and methods of market interaction.
Across markets, this younger cohort is less bound by traditional investing conventions and more likely to explore alternative assets, thematic strategies, and digital-first tools.
3. Digital Platforms Are Central to Retail Behavior
The rise of mobile trading apps — with real-time alerts, frictionless execution, and intuitive interfaces — is fundamental to post-2025 retail behavior:
Zero-commission trading has become the global norm, enabling more frequent trading and attracting a broader, younger base.
Investors use apps to trade fractional shares, access international markets, and mix traditional and alternative assets seamlessly.
Security and trust features, including biometric logins and fraud detection, are now expected rather than optional.
These platforms blur the boundary between “investing” and “social finance”: funds, equities, crypto, ETFs, and educational content all coexist in one ecosystem.
4. Broader Access, Greater Participation
Before 2020, market access was limited by cost, information asymmetry, and institutional barriers. Now:
Retail investors can trade international stocks, ETFs, and digital assets with minimal friction.
Brokerage innovations like fractional investing democratize high-priced stocks.
Emerging market investors — including in India — are increasingly participating directly in equities, moving away from fixed deposits and traditional assets.
This has increased retail influence in indices and capital markets. In some markets like India, retail investors now hold a significant share of total market cap, reshaping ownership structures and domestic liquidity.
5. Portfolio Strategies Are Becoming More Sophisticated
Although early retail behavior was often associated with speculation, the reality post-2025 is more nuanced:
Goal-Oriented and Long-Term Thinking
Retail portfolios increasingly reflect long-term objectives — retirement, wealth accumulation, home ownership — rather than pure short-term speculation.
Diversification and Passive Investing
Low-cost ETFs and passive investing vehicles are popular, with many retail investors seeking diversified exposure to sectors like AI, clean energy, and global indices.
Sustainable & ESG Focus
Environmental, Social, and Governance (ESG) considerations are shaping allocations, particularly among younger investors who view sustainability as part of value investing.
Measured Risk Appetite
While risk tolerance remains varied, evidence suggests retail traders are becoming more selective and less reactive than in past cycles. Some research highlights that many retail traders provide liquidity and market support rather than heightening volatility.
6. Behavior Under Stress: Caution and Contradictions
Retail investor behavior isn’t a straight line toward efficiency. In fact, periods of market stress reveal key tendencies:
Sentiment Fluctuates with Macro Conditions
In late 2025, institutional signals of caution led retail traders to reduce bullish bets, especially in sectors like tech, suggesting a more cautious stance in uncertain markets.
Behavioral Biases Still Matter
Despite growth in sophistication, classic biases — like herding, confirmation bias, and FOMO — remain visible. Online communities and social proof can amplify speculative moves.
Fatigue After the Hype Cycle
After the intense retail trading frenzy of 2020–24, some markets experienced declines in active retail accounts, possibly due to losses, tougher conditions, or burnout.
This suggests that retail participation is sensitive to market stress and profitability, and not immune to drawdowns in engagement.
7. Crypto and Alternative Assets: A Structured Return
Following the bear markets and regulatory ambiguity of earlier years, retail interest in crypto and blockchain-linked assets has returned with more structure and participation in regulated markets:
Improved infrastructure, clearer rules, and institutional endorsement have boosted confidence among retail crypto investors.
Platforms now blend crypto and traditional assets, making allocation decisions easier for diversified portfolios.
Retail involvement in digital finance is no longer a fringe play — it’s part of the mainstream investing toolkit.
8. Globalization of Retail Investing
Geography matters less in 2026:
Investors in India, Latin America, Africa, and Southeast Asia are participating in U.S. and European markets through accessible platforms.
Cross-border flows and digital finance products are creating global retail pools that influence markets beyond local economies.
This globalization expands liquidity but also exposes retail investors to new risks — including currency, geopolitical, and macroeconomic risk — that require sophisticated strategies.
9. The Role of Financial Education and AI Tools
Retention of educated investors often hinges on tools:
AI assistants and automated advisors are reducing informational gaps, making complex portfolio decisions more accessible.
Investors are leveraging analytics, sentiment indicators, and automated risk scoring — previously the domain of professionals.
Education — both formal and platform-driven — is transforming how retail investors think about risk, returns, and diversification.
10. What This Means for Markets and the Road Ahead
The cumulative effect of these changes has reshaped market dynamics:
Retail flows contribute to price discovery and contribute non-negligible capital in major markets.
Retail participation can dampen sell-offs when coordinated but may exacerbate volatility in specific themes.
The “retail investor” is no longer a monolithic trading stereotype but a diverse set of participants with varied goals — long-term wealth building, speculative trading, algorithmic strategies, and alternative asset exposure.
Looking forward into late 2026 and beyond:
Digital platforms will likely continue to innovate with AI and automation.
Regulatory frameworks may evolve to protect novice investors while fostering broader participation.
Retail behavior — because of its scale and connectedness — will remain a core driver of market liquidity and sentiment.
Conclusion
Post-2025, retail investors are not simply more active — they are more informed, more diverse, and more central to modern capital markets. They blend long-term goals with real-time execution, embrace technology and data, and increasingly shape global market flows. However, behavioral biases and cyclical sentiment swings persist, reminding us that retail investing is as much a human endeavor as a technological one.

Part 3 Learn Institutional Trading Call Options (CE)
A Call Option Buyer expects the market to go up.
A Call Option Seller expects the market to stay below the strike or fall.
1. CE Buyer Example
Nifty = 22,000
You buy 22,100 CE at ₹50 premium.
If Nifty closes at 22,300 on expiry:
Intrinsic value = 22,300 - 22,100 = 200
Profit = (Intrinsic - Premium) = 200 - 50 = 150
Your profit is ₹150 × lot size.
If Nifty stays below 22,100:
Your loss = premium = ₹50
2. CE Seller Example
You sell 22,100 CE at ₹50
If Nifty stays below 22,100 → Full premium is your profit.
If Nifty goes above 22,100 → You lose point by point.
Seller risk = unlimited.

Part 4 Learn Institutional TradingPut Options (PE)
A Put Option Buyer expects the market to go down.
A Put Option Seller expects market to remain above the strike.
1. PE Buyer Example
Bank Nifty = 49,000
You buy 48,800 PE at ₹100.
If Bank Nifty falls to 48,500:
Intrinsic value = 48,800 - 48,500 = 300
Profit = 300 - 100 = 200
If Bank Nifty stays above 48,800:
PE buyer loses premium.
2. PE Seller Example
You sell 48,800 PE at ₹100
If Bank Nifty stays above 48,800 → Seller profits full premium.
If it falls → Seller loses point by point.

SEBI Trading Regulations and Derivatives Curbs (F&O Clampdowns)1. Introduction: What Is SEBI and Why Regulate Derivatives?
The Securities and Exchange Board of India (SEBI) is India’s capital markets regulator. It’s tasked with protecting investors’ interests, developing markets, and regulating securities trading—including equities, bonds, and derivatives (futures and options). Derivatives are financial contracts whose value is linked to an underlying asset (e.g., stocks, indices). They offer benefits like risk management, price discovery, and market liquidity. But because these instruments involve leverage, they can also amplify risks and attract speculative trading that may destabilize markets, particularly when retail participation surges.
In recent years, the rapid growth of derivatives trading in India—especially retail participation in Futures & Options (F&O)—has prompted SEBI to tighten regulations. Regulators have expressed concerns about excessive speculation, high loss rates among individual traders, volatile expiry days, and possible manipulation by sophisticated players. The steps SEBI has taken are designed to balance market efficiency with investor protection and financial stability.
2. Scope of SEBI’s Regulatory Framework
SEBI’s derivatives regulations cover the entire lifecycle of F&O trading, including:
Contract design and eligibility (what can be traded, and under what conditions)
Position limits and surveillance (how much exposure any participant can hold)
Margin and risk management frameworks
Monitoring and enforcement protocols
These rules apply to all market participants—retail investors, brokers, proprietary traders, foreign portfolio investors (FPIs), and exchanges.
3. Key Derivatives Curbs (“F&O Clampdowns”)
Below are the major regulatory reforms SEBI has introduced since late 2024 and through 2025 to control excessive speculation and safeguard the markets:
3.1 Increase in Contract Size
One of SEBI’s most significant changes was to raise the minimum contract size of index derivatives. Previously, most index futures and options contracts had values between ₹5–10 lakh. SEBI increased this to at least ₹15 lakh, with lot sizes adjusted so that the contract value on review falls between ₹15–20 lakh. This applies when new contracts are introduced.
Why? Larger contract sizes mean traders must commit more capital to participate. This raises the entry barrier for highly leveraged retail speculation and encourages more responsible positioning.
3.2 Upfront Collection of Option Premiums
Under earlier practices, brokers could offer credit or allow traders to pay part of the premium or margins later. SEBI mandated that for options trading, premiums must be collected upfront from buyers by trading or clearing members.
Impact: This reduces unrealistic leverage and ensures traders can cover potential losses. It protects both individual traders and the broader clearing ecosystem from defaults.
3.3 Removal of Calendar Spread Benefits
Calendar spreads involve holding positions in two different expiry months and benefit from regulatory margin offsets. SEBI eliminated these benefits on the day a contract expires.
Purpose: This curbs complex strategies often used for speculative gains during volatile expiry periods and simplifies risk calculations. It also prevents traders from taking disproportionate positions near expiry.
3.4 Rationalisation of Weekly Expiry Contracts
Weekly expiry options—contracts that expire every week—were increasingly popular among retail traders due to frequent rollover opportunities. SEBI limited each exchange to offering weekly derivatives on only one benchmark index.
The regulator also later mandated that all equity derivatives must expire only on Tuesdays or Thursdays to reduce “hyperactivity” and speculating across multiple days.
Goal: Reducing speculative volume spikes and concentrating trading activity to manageable expiries eases operational risk and volatility.
3.5 Intraday Monitoring of Position Limits
Historically, position limits were checked only at the end of the trading day. SEBI changed this by requiring stock exchanges to take multiple random intraday snapshots (typically at least four during the trading session) to monitor open interest and cap positions.
In 2025, SEBI also introduced specific entity-level intraday limits for index derivatives—for example, capping net exposure at ₹5,000 crore and gross exposure at ₹10,000 crore per entity, with monitoring across the day and penalties for breaches.
Effect: Real-time monitoring prevents traders from building up excessive positions unnoticed and enhances market discipline and risk control.
3.6 Revised Market Wide Position Limits (MWPL)
SEBI revised how Market Wide Position Limits (MWPL) are calculated by using more realistic measures such as delta-adjusted open interest (FutEq OI), which accounts for actual risk exposure rather than nominal contract volumes. It also tied limits more closely to cash market liquidity and free float data.
Result: Position limits now reflect true market risk, reducing the likelihood of manipulation and sudden bans on derivative trading in individual stocks.
3.7 Rules During Ban Periods
Under the revised ban framework, if a stock reaches a high proportion (e.g., 95%) of its MWPL, it enters a ban period. In such cases, traders cannot increase net positions and must reduce exposure periodically. This prevents “flipping” or speculative attacks designed to influence prices.
4. Broader Surveillance and Enforcement
SEBI has also strengthened surveillance norms in the derivatives markets, including:
Heightened scrutiny of price and volume anomalies
Greater transparency from brokers and exchanges
Penalties for breaches of limits and non-compliance
Actions against manipulation (e.g., banning firms for manipulative practices)
These actions signal SEBI’s intent not only to set rules but enforce them rigorously.
5. Objectives Behind F&O Clampdowns
SEBI’s reforms aim to address multiple structural issues:
5.1 Protect Retail Investors
Data show that a large majority of individual traders in derivatives incur losses, often due to leverage and speculation without adequate risk management. SEBI’s rules seek to protect such traders from unsustainable risk exposure.
5.2 Enhance Market Stability
By curbing speculative excesses—especially around expiry days when volumes can spike—SEBI wants to reduce extreme volatility that can undermine confidence in the markets.
5.3 Improve Risk Monitoring and Transparency
Real-time monitoring and more accurate measurement of exposure provide better risk oversight across market participants, protecting the clearing ecosystem and broader financial system.
6. Criticisms and Responses
Some market participants argue that SEBI’s “clampdowns” may reduce liquidity, discourage legitimate trading strategies, and make markets less attractive, especially for smaller participants or algorithmic traders. SEBI’s chairperson has emphasized the need to strike a balance between regulation and innovation, warning against overly restrictive, threshold-based approaches that might stifle market activity.
7. Conclusion: The Future of Derivatives in India
SEBI’s trading regulations and derivatives curbs reflect a broader trend of tightening oversight in financial markets globally. India’s experience shows a regulator adjusting rules in response to market behavior, risk trends, and investor outcomes. While these measures may dampen speculative frenzy and protect vulnerable investors, they also require market participants to adapt through better risk management, informed strategy, and compliance diligence.
In essence, SEBI’s approach balances market development with investor protection and stability, steering the derivatives ecosystem toward more sustainable growth.

PSU Bank Bees ETF Buy @ 76As per multiyear break out on weekly chart
+
Fibonacci
Buy = 76 or Fib level of 1.618
TP 1 = 93
TP 2 = 117 or Fib level of 2.618
TP 3 = 135
Very Long-term target = 415

Buy Hang Seng Tech ETF @ 27.46As per multiyear break out on weekly chart
+
Fibonacci
Buy = 27.46
TP 1 = 36.56
TP 2 = 44 or Fib level of 2.618
TP 3 = 64.81

SPY | Daily: Buying Volume Moderates Near Resistance, Support-1 Description
Price has recently moved into a resistance zone, where buying volume appears to be moderating, indicating a lack of strong upside follow-through.
Price is currently hovering near Support-1, making this a key level to monitor in the near term.
Technical Observations
Buying volume has contracted in the recent advance, suggesting reduced participation.
Price remains below the recent supply zone.
Support-1 acts as the immediate reference level.
Major Support below remains the next structural area of interest.
Scenario to Watch
If price sustains below Support-1, focus may shift toward a retest of the major support zone.
A firm hold above Support-1 could keep price in a consolidation phase.
This analysis is based on price structure and volume behaviour, not prediction.
🛡️ Disclaimer
This analysis is shared for educational and informational purposes only.
It does not constitute investment or trading advice.
Markets involve risk; please do your own research or consult a registered advisor.

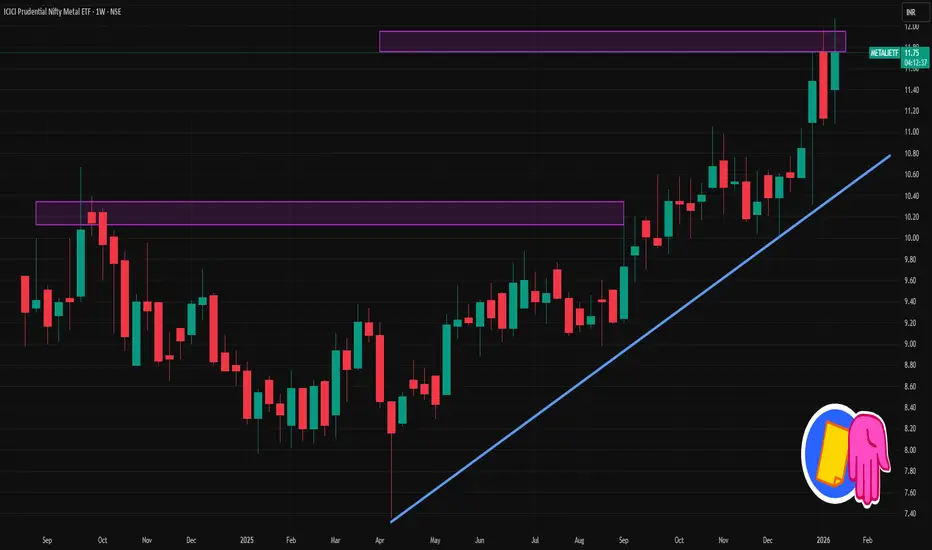
METALIETF 1 Week Time Frame 📊 Current Context (Latest Price)
• The ETF is trading around ₹11.6–₹11.8 (mid‑Jan 2026 data).
📈 Weekly Technical Levels (Pivot‑Based Support / Resistance)
From the weekly pivot point analysis:
Weekly Pivot Point (Center): ~ ₹11.38
This is a key level — above it suggests bullish bias on weekly charts.
Weekly Resistance Levels:
R1: ~ ₹11.71 — first upside target/resistance
R2: ~ ₹12.28 — secondary resistance zone
R3: ~ ₹12.61 — further supply zone if momentum continues
Weekly Support Levels:
S1: ~ ₹11.05 — initial support on pullbacks
S2: ~ ₹10.81 — next support below
S3: ~ ₹10.48 — deeper weekly support
Central Pivot Range (CPR):
Top CPR ~ 11.51
Bottom CPR ~ 11.26
This band often acts as a weekly equilibrium zone — trading above it keeps bulls in control.
📌 Summary – Weekly Key Levels
Level Type Price (₹)
Weekly Resistance 3 (R3) ~11.52
Weekly Resistance 2 (R2) ~11.28
Weekly Resistance 1 (R1) ~11.06
Weekly Pivot ~10.82
Weekly Support 1 (S1) ~10.60
Weekly Support 2 (S2) ~10.36
Weekly Support 3 (S3) ~10.14
Option Trading Strategies Key Components of Option Trading
To understand option trading effectively, one must be familiar with its essential components:
Underlying Asset: The stock, index, or commodity on which the option is based
Strike Price: The price at which the asset can be bought or sold
Expiry Date: The date on which the option contract expires
Premium: The cost paid by the option buyer
Lot Size: The fixed quantity of the underlying asset per option contract
Open Interest: The total number of outstanding option contracts

NIFTYBEES : Position to systematically de-risk BPCL tradeToday’s sharp correction in BPCL and the broader Oil & Gas space reflects a classic “geopolitical discount.” With the U.S. threatening a steep 500% tariff, uncertainty around OMC earnings has surged, triggering risk-off positioning across the sector.
In response, I’m de-risking the portfolio by initiating an allocation into Nifty BeES. The Nifty 50 is currently consolidating around its 20-day and 50-day EMAs, a zone that historically acts as a strong demand area. The probability of price finding support at these levels and staging a rebound remains high.
While BPCL faces near-term headwinds from potential inventory losses and pressure from discounted Russian crude dynamics, the Nifty 50 is structurally supported by its Banking and IT heavyweights, which continue to benefit from improving earnings visibility and relative global stability.
This trade is therefore not a directional bet alone, but a strategic hedge—aimed at balancing portfolio risk, reducing volatility, and maintaining market participation amid heightened geopolitical uncertainty.
📢📢📢
If my perspective changes or if I gather additional fundamental data that influences my views, I will provide updates accordingly.
Thank you for following along with this journey, and I remain committed to sharing insights and updates as my trading strategy evolves. As always, please feel free to reach out with any questions or comments.
Other posts related to this particular position and scrip, if any, will be attached underneath. Do check those out too.
Disclaimer : The analysis shared here is for informational purposes only and should not be considered as financial advice. Trading in all markets carries inherent risks, and past performance is not indicative of future results. It’s essential to conduct your own research and assess your risk tolerance before making any investment decisions. The views expressed in this analysis are solely mine. It’s important to note that I am not a SEBI registered analyst, so the analysis provided does not constitute formal investment advice under SEBI regulations.

Divergence Secrets Pros of Option Trading
✔ Low capital requirement
✔ High leverage
✔ Risk-defined trades
✔ Can profit in any market condition
✔ Wide variety of strategies
✔ Best tool for hedging
✔ High return potential
Cons of Option Trading
✘ Complexity for beginners
✘ Time decay risk
✘ Requires knowledge of volatility
✘ High risk for option sellers
✘ Emotional pressure
✘ Requires active monitoring

Part 10 Trade Like Institutions Option Buyers vs Option Sellers
Understanding the difference is crucial.
Option Buyers
Pay premium.
Have limited risk.
Profit only when market moves strongly in expected direction.
Time works against them due to premium decay.
Option Sellers (Writers)
Receive premium upfront.
Take unlimited or high risk.
Profit when market stays sideways or moves slowly.
Time works in their favor due to time decay.
This structure creates a balanced market between buyers and sellers.

QQQ — Weekly Map (5–10 Jan)1) Bull Case — “Acceptance above equilibrium”
Trigger: Hold above 609 and reclaim 611
Targets: 615 → 617
Stretch (only if momentum persists): 623
2) Bear Case — “Rejection at equilibrium / Failed reclaim”
Trigger: Lose 609 (acceptance back below equilibrium) and lose 604
Targets: 607 → 602
Extension: 600 only in a true unwind
Invalidation
Long thesis weakens on acceptance back below 609
Short thesis weakens on acceptance above 611

SPY — Weekly Map (5–10 Jan)Here's this week's levels for SPY -
1) Bull Case — “Acceptance above equilibrium”
Trigger: Hold above 681 and reclaim 685
Targets: 687 → 690
Stretch (only if momentum persists): 696
2) Bear Case — “Rejection at equilibrium / Failed reclaim”
Trigger: Lose 681 (acceptance back below equilibrium) and lose 676
Targets: 678 → 672
Extension: 669 only in a true unwind
Invalidation
Long thesis weakens on acceptance back below 681
Short thesis weakens on acceptance above 685

qqqQQQ Technical Analysis
QQQ is currently respecting key technical levels. Price action shows a clear reaction around support and resistance zones, with structure remaining intact.
As long as price holds above support, bullish continuation toward the next resistance is possible. A breakdown below support may lead to a deeper pullback.
This analysis is based purely on price action and technical structure.
Always wait for confirmation and manage risk properly.
📌 Not financial advice.

#AUTOBEES - VCP BO in DTFScript: AUTOBEES
Key highlights: 💡⚡
📈 VCP BO in DTF
📈 Volume spike seen during Breakout
📈 MACD Bounce
📈 RS Line making 52WH
📈 Sector is strong
If you have any doubts about the setup, drop a comment and I’ll reply.
✅Boost and follow to never miss a new idea! ✅
⚠️ Important: Always Exit the trade before any Event.
⚠️ Important: Always maintain your Risk:Reward Ratio as 1:2, with this RR, you only need a 33% win rate to Breakeven.
⚠️Disclaimer: I am not SEBI Registered Advisor. My posts are purely for training and educational purposes.
Eat🍜 Sleep😴 TradingView📈 Repeat 🔁

Emerging Trends in the Indian Trading Market1. Rise of Retail Participation
One of the most defining trends in the Indian trading market is the massive increase in retail investor participation. Easy access to smartphones, low-cost internet, and user-friendly trading platforms have democratized market access. Millions of first-time traders have entered equities, derivatives, and commodities, especially after the pandemic period. Discount brokerages offering zero or low brokerage fees have further accelerated this shift. Retail traders are no longer passive investors; they actively participate in intraday trading, options trading, and thematic bets, significantly influencing market liquidity and volatility.
2. Boom in Derivatives and Options Trading
India has emerged as one of the largest derivatives markets globally, particularly in index options trading. A notable trend is the growing preference for options over cash equity trading among retail participants. Weekly index options, low capital requirements, and the potential for high returns have made derivatives attractive. However, this has also increased speculative activity, leading regulators to focus on risk management, margin requirements, and investor education. The dominance of derivatives indicates a shift from long-term investing toward short-term trading strategies.
3. Technology-Driven Trading Ecosystem
Technology has become the backbone of the Indian trading market. Algorithmic trading, once limited to institutional investors, is now accessible to sophisticated retail traders through APIs and strategy platforms. Artificial intelligence (AI), machine learning, and data analytics are increasingly used for signal generation, risk management, and portfolio optimization. High-speed execution, real-time data, and advanced charting tools have improved efficiency but also intensified competition. Technology has reduced information asymmetry, making markets more transparent yet faster-moving.
4. Growing Popularity of Systematic and Quantitative Strategies
Indian traders are gradually shifting from discretionary, emotion-driven trading to rule-based and systematic strategies. Backtesting, automation, and quantitative models are gaining traction, especially among younger and tech-savvy traders. Momentum trading, trend-following systems, mean reversion strategies, and statistical arbitrage are becoming more common. This trend reflects a maturing market where consistency, discipline, and risk-adjusted returns are increasingly valued over speculative bets.
5. Increased Focus on Risk Management and Position Sizing
With higher participation and volatility, traders are becoming more aware of the importance of risk management. Concepts such as position sizing, stop-loss discipline, risk-reward ratios, and capital preservation are now widely discussed. Educational content on trading psychology and money management has grown rapidly. This shift suggests that traders are recognizing that long-term survival in markets depends more on managing losses than chasing profits.
6. Regulatory Evolution and Market Transparency
The role of regulators, particularly SEBI, has been crucial in shaping modern Indian markets. Recent trends include tighter margin norms, peak margin requirements, enhanced disclosure standards, and stricter oversight of derivatives trading. While these measures initially faced resistance, they have improved market integrity and reduced excessive leverage. Regulatory clarity has increased foreign investor confidence and strengthened India’s position as a credible global trading destination.
7. Sectoral and Thematic Trading Gaining Traction
Another prominent trend is the rise of sectoral and thematic trading. Traders increasingly focus on themes such as renewable energy, electric vehicles, defense, infrastructure, digital economy, and manufacturing-led growth. Government initiatives like “Make in India,” PLI schemes, and energy transition policies have influenced sector-based trades. Instead of trading isolated stocks, participants now analyze broader macro and policy-driven narratives, reflecting a more informed and structured approach.
8. Influence of Global Markets and Macroeconomic Factors
The Indian trading market is more globally connected than ever. Movements in US markets, crude oil prices, interest rate decisions by global central banks, currency fluctuations, and geopolitical developments have a direct impact on Indian indices. Traders actively track global cues, economic data, and policy announcements. This trend highlights India’s integration into the global financial system and the need for traders to adopt a multi-asset and macro-aware perspective.
9. Growth of Commodity and Currency Trading
Beyond equities, commodity and currency trading have seen steady growth. Gold, silver, crude oil, natural gas, and agricultural commodities attract traders seeking diversification and inflation hedging. Currency derivatives allow traders and businesses to manage forex risk more effectively. The increasing popularity of these segments reflects a broader understanding of cross-market relationships and portfolio diversification.
10. Expansion of Trading Education and Content Ecosystem
The Indian trading ecosystem has witnessed an explosion of educational platforms, webinars, social media content, and online communities. Traders now have access to structured courses on technical analysis, options strategies, trading psychology, and quantitative methods. While this has improved knowledge dissemination, it has also increased the need for discernment, as not all content is reliable. Nonetheless, the emphasis on education signals a transition toward more informed and skilled market participants.
11. Behavioral Shifts and Trading Psychology Awareness
Another important trend is the growing awareness of behavioral finance and trading psychology. Traders increasingly acknowledge the impact of emotions such as fear, greed, and overconfidence. Journaling, performance analysis, and mindset training are becoming integral parts of trading routines. This psychological maturity suggests that Indian traders are evolving beyond purely technical or fundamental approaches.
12. Long-Term Outlook and Market Maturity
Overall, the Indian trading market is moving toward greater depth, liquidity, and sophistication. While volatility and speculative behavior remain, the long-term trend points to a more mature ecosystem characterized by better regulation, advanced technology, and educated participants. India’s strong economic growth prospects, expanding middle class, and increasing financialization of savings provide a solid foundation for sustained market development.
Conclusion
The trends in the Indian trading market reflect a powerful combination of technology, participation, regulation, and global integration. From the rise of retail traders and derivatives dominance to systematic strategies and thematic trading, the market is evolving rapidly. While challenges such as excessive speculation and risk mismanagement persist, the overall direction is positive. As traders become more disciplined, informed, and technology-driven, the Indian trading market is well-positioned to play a leading role in the global financial landscape in the years ahead.

Option Trading vs. Stock TradingUnderstanding Stock Trading
Stock trading involves buying and selling shares of publicly listed companies. When an investor buys a stock, they gain partial ownership in the company along with associated rights such as voting and dividends (if declared). Stock trading can be done for short-term gains (intraday, swing trading) or long-term wealth creation (investing).
The primary driver of stock prices is the company’s fundamentals—earnings, growth prospects, management quality, and industry trends—along with broader market sentiment and macroeconomic factors. Profit in stock trading is typically generated by buying low and selling high, or through dividends in the case of long-term investments.
One of the major advantages of stock trading is its simplicity and transparency. The maximum loss is limited to the invested amount, and there is no expiry date on shares. This makes stock trading relatively easier to understand for beginners. However, returns may be slower compared to leveraged instruments, and capital requirements can be higher if one wants to build a diversified portfolio.
Understanding Option Trading
Option trading involves trading derivative contracts whose value is derived from an underlying asset such as a stock or index. An option gives the buyer the right, but not the obligation, to buy (call option) or sell (put option) the underlying asset at a predetermined price (strike price) before or on a specified expiry date.
Options are time-bound instruments and include additional factors like time decay (theta), volatility (vega), and price sensitivity (delta, gamma). Traders can profit not only from price movement but also from changes in volatility and time decay, making options far more versatile than stocks.
Option trading allows strategies that can generate profits in rising, falling, or even sideways markets. However, this flexibility comes at the cost of higher complexity and risk. While option buyers have limited risk (premium paid), option sellers can face substantial or even unlimited losses if risk management is poor.
Risk and Reward Comparison
Stock trading generally carries lower risk compared to option trading. Since stocks do not expire, investors can hold positions through market cycles and wait for recovery. Losses are unrealized until the stock is sold, giving investors psychological and strategic flexibility.
Option trading, on the other hand, is a high-risk, high-reward activity. The leverage involved allows traders to control large positions with relatively small capital, amplifying both profits and losses. Time decay works against option buyers, meaning the value of options erodes as expiry approaches if the expected move does not happen quickly.
For disciplined and experienced traders, options can be used to hedge risk or generate consistent income. For inexperienced traders, however, options can lead to rapid capital erosion.
Capital Requirements
Stock trading typically requires higher capital to achieve meaningful returns, especially in high-priced stocks. However, margin trading in stocks is also available, though regulated and limited.
Option trading requires lower upfront capital due to leverage. A trader can participate in expensive stocks or indices with a small premium amount. This low entry barrier attracts many retail traders, but it also increases the likelihood of overtrading and excessive risk-taking.
Time Horizon and Flexibility
Stock trading suits both long-term investors and short-term traders. Investors can hold stocks for years, benefiting from compounding, dividends, and business growth. Swing and positional traders can also use stocks effectively without worrying about expiry.
Option trading is inherently short-term due to fixed expiries. Traders must be precise about timing, direction, and volatility. This makes options more suitable for active traders who can monitor markets closely and respond quickly to changing conditions.
Strategy and Skill Requirement
Stock trading strategies often revolve around fundamental analysis, technical analysis, or a combination of both. While skill is required, the learning curve is relatively gradual.
Option trading demands advanced knowledge of option Greeks, volatility analysis, probability, and risk management. Strategies such as spreads, straddles, strangles, and iron condors require careful planning and execution. Emotional discipline is also critical, as rapid profit and loss fluctuations are common.
Income Generation and Hedging
Stock trading primarily generates income through capital appreciation and dividends. It is less effective for regular income unless large capital is deployed.
Option trading excels in income generation, particularly through option selling strategies like covered calls and cash-secured puts. Options are also powerful hedging tools, allowing investors to protect stock portfolios against adverse market moves.
Psychological Impact
Stock trading is generally less stressful, especially for long-term investors. Market volatility affects portfolio value, but the absence of expiry reduces urgency.
Option trading is psychologically demanding. Rapid price changes, expiry pressure, and leveraged exposure can lead to emotional decision-making. Without discipline, traders may overtrade or chase losses.
Regulatory and Practical Considerations
In markets like India, option trading requires additional approvals and margin compliance. Regulatory frameworks are stricter due to higher risk. Transaction costs, taxes, and slippage can also significantly impact option trading profitability.
Stock trading regulations are comparatively straightforward, making it more accessible for retail participants.
Conclusion
Both stock trading and option trading have their own advantages and limitations. Stock trading is ideal for beginners, conservative traders, and long-term wealth creators who value stability and gradual growth. Option trading is better suited for experienced traders seeking leverage, income generation, and advanced risk management tools.
The choice between option trading and stock trading should depend on an individual’s risk appetite, capital availability, time commitment, and level of expertise. Importantly, these two approaches are not mutually exclusive. Many successful market participants use stocks for core investments and options for hedging or tactical opportunities. When used wisely and with discipline, both can play a valuable role in a well-rounded trading and investment strategy.

Essential Infrastructure Investments: Foundation for SustainableIntroduction
Essential infrastructure investments form the backbone of economic development, social well-being, and long-term national competitiveness. Infrastructure is not limited to roads and bridges; it includes power systems, water supply, digital networks, transport corridors, healthcare facilities, and urban services that enable societies and economies to function efficiently. In an era of rapid urbanization, climate change, technological disruption, and rising population demands—especially in emerging economies like India—strategic infrastructure investment has become a critical policy priority. Well-planned infrastructure enhances productivity, reduces inequality, supports private investment, and ensures resilience against future shocks.
Understanding Essential Infrastructure
Essential infrastructure refers to physical and institutional systems necessary for the operation of a modern economy and society. These include:
Economic infrastructure such as transportation, energy, logistics, and telecommunications.
Social infrastructure including healthcare, education, housing, and sanitation.
Digital infrastructure like broadband connectivity, data centers, and digital public platforms.
Environmental infrastructure covering water management, waste treatment, and renewable energy systems.
These systems are interlinked, and deficiencies in one area often constrain the effectiveness of others.
Role of Infrastructure in Economic Growth
Infrastructure investment directly contributes to economic growth by improving efficiency and lowering transaction costs. Reliable roads and railways reduce logistics expenses, efficient ports enhance trade competitiveness, and stable power supply boosts industrial productivity. Infrastructure also has a strong multiplier effect—every unit of investment generates employment, stimulates demand in allied industries like steel and cement, and crowds in private sector investment. For developing economies, infrastructure bridges regional disparities by integrating rural and urban markets and expanding access to economic opportunities.
Transportation Infrastructure: Connecting Markets and People
Transportation infrastructure is a cornerstone of development. Roads, railways, ports, and airports enable the smooth movement of goods and people. Investments in highways and freight corridors reduce travel time, fuel costs, and logistics inefficiencies. Urban public transport systems like metros and electric buses ease congestion, reduce pollution, and improve quality of life. In countries like India, projects such as dedicated freight corridors, expressways, and port modernization are crucial for supporting manufacturing growth and export competitiveness.
Energy Infrastructure: Powering Development
Reliable and affordable energy is essential for economic and social progress. Investments in power generation, transmission, and distribution ensure uninterrupted supply to industries and households. The global transition toward renewable energy has made investments in solar, wind, green hydrogen, and energy storage increasingly important. Modern energy infrastructure not only supports sustainability goals but also reduces dependence on fossil fuel imports, strengthens energy security, and aligns growth with climate commitments.
Water, Sanitation, and Urban Infrastructure
Water supply, sanitation, and waste management are fundamental to public health and urban sustainability. Investments in drinking water pipelines, sewage treatment plants, stormwater drainage, and solid waste management improve living conditions and reduce disease burden. Rapid urbanization demands smart urban infrastructure—integrated planning, efficient land use, affordable housing, and resilient cities that can withstand floods, heatwaves, and other climate risks.
Digital Infrastructure: Enabling the Modern Economy
Digital infrastructure has emerged as a new essential pillar. High-speed internet, mobile networks, cloud computing, and digital identity systems enable e-governance, financial inclusion, online education, telemedicine, and digital commerce. Investments in broadband connectivity, especially in rural and remote areas, reduce the digital divide and unlock productivity gains. Digital public infrastructure also enhances transparency, service delivery, and innovation across sectors.
Social Infrastructure: Investing in Human Capital
Healthcare, education, and skill development infrastructure are vital for long-term growth. Hospitals, schools, universities, and training centers enhance human capital, which is the true driver of sustainable development. Quality social infrastructure improves labor productivity, supports demographic dividends, and ensures inclusive growth. Public investment in these areas often delivers high social returns, even if immediate financial returns are limited.
Infrastructure Financing and Policy Frameworks
Financing essential infrastructure requires a mix of public spending, private participation, and innovative funding mechanisms. Governments play a central role through budgetary allocations, development banks, and policy support. Public-Private Partnerships (PPPs), infrastructure investment trusts (InvITs), green bonds, and sovereign funds help mobilize long-term capital. A stable regulatory framework, transparent bidding processes, and risk-sharing mechanisms are crucial to attract private investors and ensure project viability.
Challenges in Infrastructure Investment
Despite its importance, infrastructure development faces challenges such as land acquisition delays, regulatory bottlenecks, cost overruns, environmental concerns, and financing constraints. Poor project planning and governance can reduce efficiency and lead to underutilized assets. Climate risks also require infrastructure to be resilient and future-ready, increasing initial costs but reducing long-term losses.
Conclusion
Essential infrastructure investments are not merely capital expenditures; they are strategic investments in a nation’s future. By strengthening transportation, energy, digital, social, and environmental systems, governments can accelerate economic growth, improve quality of life, and enhance resilience. In a rapidly changing global environment, infrastructure that is sustainable, inclusive, and technologically advanced will determine long-term competitiveness. Countries that prioritize well-planned infrastructure investments today will be better positioned to achieve stable growth, social equity, and sustainable development in the decades ahead.

Blockchain and Tokenized AssetsRedefining Ownership, Finance, and the Global Economy
Blockchain technology and tokenized assets represent one of the most transformative shifts in the modern financial and economic landscape. What began as the underlying infrastructure for cryptocurrencies has evolved into a powerful system capable of redefining ownership, trust, and value exchange across industries. At its core, blockchain introduces a decentralized, transparent, and immutable ledger, while tokenization converts real-world and digital assets into blockchain-based tokens. Together, they are reshaping finance, investment, governance, and even the concept of property itself.
Understanding Blockchain: The Foundation
Blockchain is a distributed ledger technology where transactions are recorded across a network of computers (nodes). Unlike traditional centralized systems controlled by a single authority, blockchain operates on decentralization and consensus. Every transaction is validated by the network, cryptographically secured, and permanently stored in blocks that are linked together in chronological order.
This structure creates three powerful advantages. First, transparency, as all participants can verify transactions. Second, immutability, meaning once data is recorded, it cannot be altered without consensus. Third, trust minimization, as intermediaries such as banks, brokers, or clearinghouses become less necessary. These characteristics make blockchain an ideal platform for handling value, ownership, and contracts.
What Are Tokenized Assets?
Tokenized assets are representations of real-world or digital assets on a blockchain in the form of tokens. These tokens can represent almost anything of value—stocks, bonds, real estate, commodities, art, intellectual property, or even carbon credits. Each token carries information about ownership rights, transferability, and sometimes income entitlements.
There are two broad categories of tokenized assets:
Fungible tokens, where each unit is identical (such as tokenized shares or stablecoins).
Non-fungible tokens (NFTs), where each token is unique, commonly used for art, collectibles, and unique assets.
Tokenization bridges the physical and digital worlds, allowing traditionally illiquid or inaccessible assets to be traded efficiently on global platforms.
How Tokenization Transforms Ownership
One of the most revolutionary impacts of tokenized assets is fractional ownership. Traditionally, assets like real estate, infrastructure projects, or fine art require significant capital. Tokenization allows these assets to be divided into smaller units, enabling retail investors to participate with minimal capital.
This democratization of access changes investment dynamics. A commercial building, for example, can be tokenized into thousands of units, allowing investors worldwide to own fractions, earn rental yields, and trade their holdings instantly. Ownership becomes more inclusive, liquid, and global.
Impact on Financial Markets
Tokenized assets have profound implications for financial markets. Settlement times, which traditionally take days, can be reduced to minutes or seconds through blockchain-based transactions. This lowers counterparty risk, reduces costs, and improves capital efficiency.
Furthermore, 24/7 trading becomes possible. Unlike traditional stock exchanges with fixed hours, tokenized assets can be traded continuously across borders. This creates a more dynamic market environment and aligns with the always-on nature of the global economy.
In addition, smart contracts—self-executing programs on the blockchain—automate compliance, dividend payments, interest distribution, and corporate actions. This automation reduces operational errors and intermediaries, making financial systems leaner and more resilient.
Use Cases Beyond Finance
While finance is the most visible application, blockchain and tokenization extend far beyond it.
Real Estate: Property records can be tokenized, enabling instant transfers, transparent ownership history, and reduced fraud.
Commodities: Gold, oil, and agricultural products can be tokenized, simplifying trade, storage verification, and settlement.
Supply Chains: Tokenized tracking of goods ensures authenticity, reduces counterfeiting, and enhances traceability.
Intellectual Property: Music, patents, and digital content can be tokenized, allowing creators to monetize directly and retain control.
Carbon Credits and ESG Assets: Tokenization enables transparent tracking and trading of environmental assets, supporting sustainability goals.
These applications demonstrate that tokenization is not just a financial innovation, but an economic infrastructure upgrade.
Regulation and Institutional Adoption
As tokenized assets grow, regulation becomes a critical factor. Governments and regulators worldwide are working to balance innovation with investor protection. Clear legal frameworks around digital ownership, custody, taxation, and compliance are essential for mainstream adoption.
Institutional players—banks, asset managers, exchanges, and central banks—are increasingly embracing blockchain. Central Bank Digital Currencies (CBDCs), tokenized government bonds, and regulated digital asset exchanges signal that blockchain is moving from the fringes to the core of the financial system.
For markets like India, tokenization presents opportunities to improve market efficiency, attract global capital, and enhance financial inclusion—provided regulatory clarity evolves alongside technology.
Risks and Challenges
Despite its promise, blockchain and tokenized assets face challenges. Cybersecurity risks, smart contract vulnerabilities, and technology scalability remain concerns. Market volatility, particularly in crypto-linked tokens, can deter conservative investors.
Legal recognition of tokenized ownership is another hurdle. Without enforceable rights in the physical world, tokenized assets risk remaining purely digital representations. Education is also essential, as investors must understand the technology, risks, and valuation methods.
The Future of Tokenized Economies
Looking ahead, tokenization is likely to become a standard feature of global markets. As infrastructure matures, assets of all kinds may exist simultaneously in physical and tokenized forms. Financial systems could evolve into interoperable networks where assets move seamlessly across platforms and jurisdictions.
Blockchain-based identities, programmable money, and decentralized finance (DeFi) will further integrate with tokenized assets, creating a more open and efficient economic system. Ownership may shift from static records to dynamic, programmable rights embedded directly in digital tokens.
Conclusion
Blockchain and tokenized assets represent a fundamental shift in how value is created, owned, and exchanged. By combining transparency, efficiency, and global accessibility, they challenge traditional systems while opening new possibilities for investors, institutions, and economies. Although regulatory, technical, and educational challenges remain, the trajectory is clear: tokenization is not a passing trend, but a structural evolution. As adoption accelerates, blockchain-powered assets are set to redefine the future of finance and the global economy itself.

Part 12 Trading Master Class In-the-Money (ITM), At-the-Money (ATM), Out-of-the-Money (OTM)
These terms describe the relation between strike price and market price.
Call options:
ITM: market price > strike
ATM: market price = strike
OTM: market price < strike
Put options:
ITM: market price < strike
ATM: market price = strike
OTM: market price > strike
ITM options cost more because they already hold intrinsic value.

SPY Weekly AI Levels — Holiday Week (Dec 22)This is a holiday-shortened, low-liquidity week. Expect rotation over trend unless price shows clear acceptance beyond key structural levels. These are contextual AI levels, not trade signals.
Core Structure (Balance Zone)
Equilibrium (EQ): 678.45
Mid-Equilibrium: 677.38
As long as price rotates around this zone, mean-reversion dominates and directional conviction remains limited.
Predictive Rails (Decision Zone)
Upper Rail: 683.48
Lower Rail: 671.27
Acceptance outside the rails shifts the market into directional expansion. Rejection at the rails typically rotates price back toward equilibrium
Outer Zones (Exhaustion Area)
Upper OZ1: 685.63
Lower OZ1: 673.42
Upper OZ2: 690.66
Lower OZ2: 666.24
Moves into these zones during holiday conditions tend to slow, rotate, or fade rather than trend cleanly.
Extreme Zones (Low-Probability Area)
Extreme Upper: 697.84
Extreme Lower: 661.21
Reaching extremes this week likely requires an external catalyst. Treat these as risk-reduction or fade zones, not breakout targets.
.............................................................................................................
Actionable Framework
Above 683.48 with acceptance: Continuation risk toward 685.6 → 690
Below 671.27 with acceptance: Downside risk toward 673 → 666
Between rails: No edge → wait
At extremes: Protect profits or fade; do not chase
Holiday Week Notes:
Liquidity is thin
Breakouts often fail without follow-through
Best trades come from acceptance, not probes
Summary
Holiday week is a patience week. Trade acceptance at the rails. Ignore noise in the middle.
Happy Holidays!
