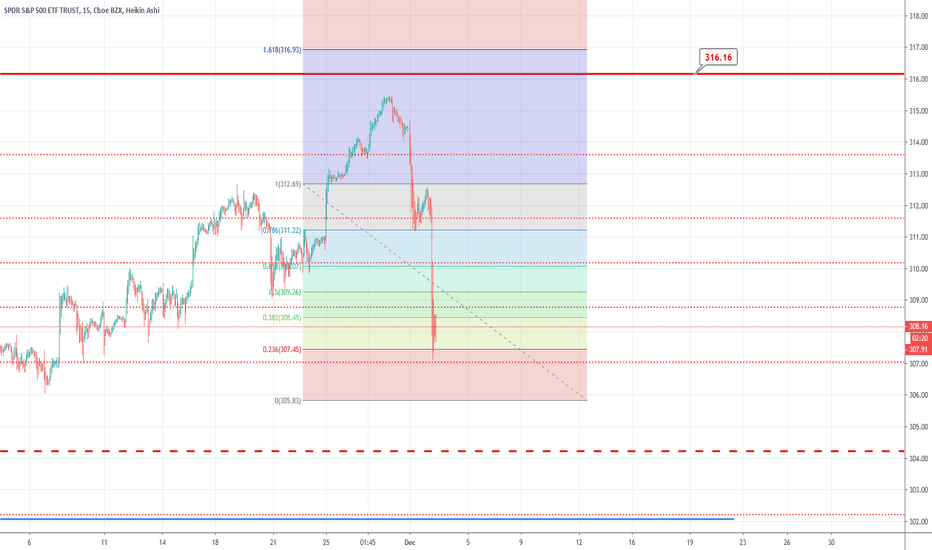
spySPY closed down 0.91 percent on Monday, April 13, 2020, on 61 percent of normal volume. Due to the stock's strong uptrend, it may remain overbought for a whileby sabri20033
5 waves completed on TLTInitiate shorts keeping 161-162 as stop for an eventual move back to 135 Shortby rohitkaranUpdated 1
QQQ KEY LEVELS SUPPORT AND RESISTANCE 04/06/2020Key Levels for QQQ INVESCO for INTRADAY TRADING are : Upper Breakout~184.80 First Target~186.10 Interim Resistance~187.70 Final Resistance~189.50 **Lower Levels** Lower Breakout~182.25 First Target~181.30 Interim Support~179.95 Final Support~178.90 Please trade with caution and consult your financial adviser before trading.by TheOptionsDesk2
Macro Economy View Ending March 2020.NIFTY 500 --- NSE:CNX500 VOLATILITY INDEX --- NSE:INDIAVIX MSCI INDIA INDEX --- AMEX:INDA S&P 500 --- TVC:SPX VIX --- TVC:VIX GOLD --- OANDA:XAUUSD OIL --- TVC:USOIL This chart shows the relation between Indian Markets & US markets with Gold and OIL. by silenThunderr2
BANK BEES - fallen approx 50% from its highBANK BEES - fallen approx 50% from its highby manuagarwal212
Another Candidate for biweekly SIP in this sale I am adding SBI Nifty 50 ETF as SIP in this sale through bi weekly SIP .I had bought in small quantity and continue to buy next 6 months through SIP for long term benifit. Longby shashankpt1
Investment callBank nifty etf can buy at every 10 point differance.i.e. at 290,280,270.... at upper level can buy in small quantity.Educationby PK90541
SPY 1hr. creates a perfect ascending triangle.A perfect ascending triangle has been created on 1hr. SPY. Expecting a downward move.Shortby priceSeries2
Bearish Divergence with a Red candle on SPYMomentum in trend looks weak. RSI with clear bearish divergence and follow up by red candle, with small consolidation on top.Educationby sourabh04gargUpdated 2
TECL LongThe true Strength Indicator is one of my favorite indicators. The True Strength Indicator has crossed upward. I feel that TECL is going to increase in price. Follow.Longby Dwain1234111
Wedge Down on XLFAs seen on the graph, the price of the XLF ETF is creating a Down Wedge pattern. We recommend placing a long position.Longby gmaggiore0
Symmetric Triangle on XLFA symmetric triangular pattern is forming on XLF, on this pattern depending on how the price breaks, two different positions can be placed.by gmaggiore0
Ascending Channel in XLFIn the chart of XLF we can see and ascending channel, in wich we can open a long position. Longby gmaggiore0
Prem's prediction (GOLDBEES)As market is in side trend price will be fluctuate between 3227 and 3498.Shortby premkmr23788110
SLV Silver expected to reach 18.1With the entry of SLV (Silver) into resistance zone of 17.2 - 18.1, we can see a rise to 18.1 where we have strong resistance. Longby mkmunir30
Gold (GLD) can fall only by 2%. Strong bull trend- medium term.Gold ETF can be used to see the trend of Gold. The way jump from sub 140 level to significantly higher than 140 at 143 has taken place in early August, we have signs of the overall sentiment as strongly bullish. With RSI hovering around 60 in past 2 months, it is evident a strong uptrend is present. At the moment, we can see the strength declining and we can expect a fall to 141.5 and further to 141. If we breach 140 in coming week, we will have strong support at 135-137 zone. by mkmunir31