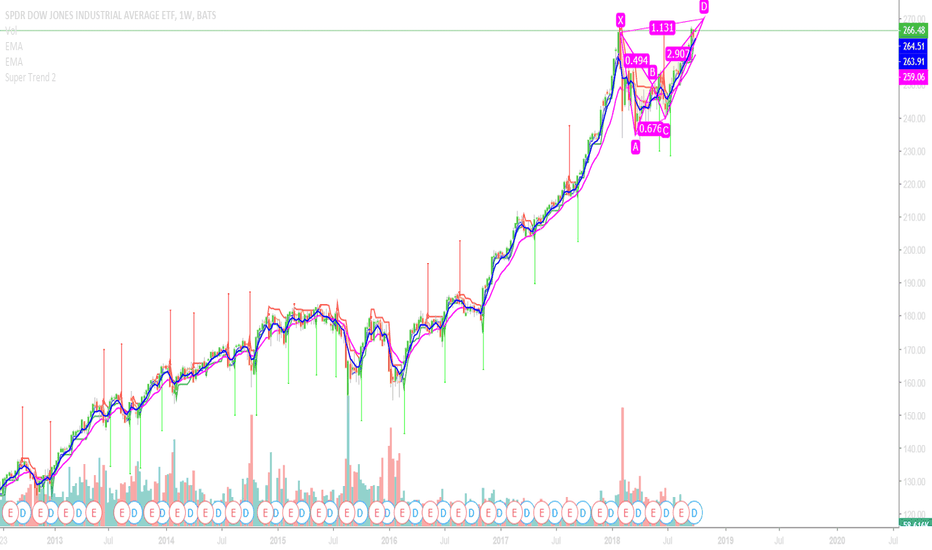
hidden bearish divergence This counter rally is running into a hidden bearish divergence. Volume is declining. The trendline breakout didnt bring in a lot of buyers. I expect the stock market to go down, trying to continue it's downtrend. Going straight back to the all time high without looking back would be very surprising.Shortby koryu4
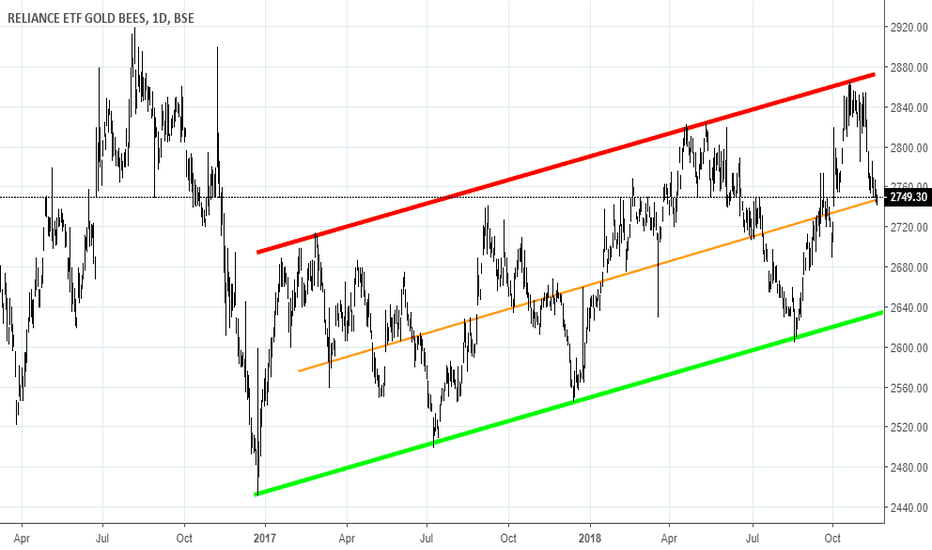
Gold in INR terms: Expecting a fall to 2670 levelsThe chart is of Gold ETF of UTI, India. at the moment, moving in a downward wedge. We have a high chance for price to go to 2670 levels which is also where green trend line will support it. We may get a reversal from that level.Shortby mkmunir30
GOLDBEES : Gold ETF At Support. Will it hold the support this time? Lets see....Educationby Trader_NishantK114
XME - Metals & mining ETF @ gann resistance - ShortXME @ potential gann resistance zone. Try shortsShortby yossarian121Updated 0
POTENTIAL BREAKOUT GOLDBEESStocks nearing 200 day high by 5% & showing consolidation for the past 30 days with volume above 50 day averageLongby HarshithCSundaram3
GOLDSHAREUptrend in continuation. Longer term EMAs are intact. MACD crossover happened. It might give good move. Educationby ankurlad0
shortshort @ 272.55 target is open till the blue doesnt cross from below...thru red... time frame nov 19th 2018Shortby superkumar20208
FANG rally is about to end in a pathetic markdownFANG stocks in this capitalization weighted ETF , AMZN, FB, GOOG, GOOGL, NFLX, amount to 35% , hence is a crude, derived , proxy for whats going on in the heavy weights when taken together... disclaimer... not an investing/trading recommendationShortby capsule911
SP500 headed for volatile times before resumption of uptrenddisclaimer...not an investing/trading recommendationby capsule912
looks like bat is drawn with scale than it appears.. BAT is BATlooks like bat is drawn with scale than it appears.. BAT is a mammal and its living thing it has differnt curves..... very volatile.. grab money when it gives.... play safe.Longby superkumar2020221
Uranium explosion?Uranium prices seems to have contracted and could soon provide a good and strong break out. The possibility of an upside break seems higher. However, one must remember how this commodity has disappointed investors on several occasions in the past.Longby ProfitableLoser1
MSCI EM - EM index trading channel from Mid march onwardsEM index at top end of recent trading range. No trade - can go either waysby yossarian1210
DIA Dowzones Industrial can see more down side lavelDIA Dowzones Industrial can see more down side lavelShortby siddmuk2005Updated 5
High yield credit showing signs of correctionLooks like we head to 84, previous low, This corresponded to the low in SPX too. Shortby rohitkaranUpdated 1
Consolidation triangle broken retest done set for sharp downmoveTLT has broken crucial support zones earlier this month and now fter the backtest, is set for a big dowmove till 113. Shortby rohitkaran0
Wyckoff distribution in US BONDSDisclaimer... not an investing/trading recommendation, for my reference use for other purpose onlyby capsule911
SPY Volume & Price Divergence SPY getting strong support around 100SMA. Market Makers playing to accumulate at lower prices. A Clear divergence between OBV and price change. Nothing to panic still. by madhuraj1
Thanks giving Turkey.Collect those juicy pennies all along and one day before thanksgiving. Anti-kelly jokers met with their destiny.by MysticWealth110
Be Careful about High Yield Bonds It looks like High Yield Bond ETF is going to go down from here which should also worry Stock Investors & Traders.Shortby Akshay150
EM MSCI - running into Gann resistanceEM index- has done well but might chop around for a whileby yossarian1210