Divergence Secrets What Are Options?
An option is a financial contract that gives the buyer the right, but not the obligation, to buy or sell an underlying asset at a fixed price (called the strike price) on or before a certain date (called expiry). There are two types of options:
Call Option – gives the right to buy.
Put Option – gives the right to sell.
The person who buys an option pays a fee known as the premium. The seller (also called the option writer) receives this premium and has the obligation to carry out the contract if the buyer chooses to exercise it.
Futures market

Part 1 Intraday Trading Master ClassWho Wins More—Option Buyers or Sellers?
Option buyers have limited risk and unlimited reward, but their probability of success is lower because:
Time decay works against them.
They need strong directional movement within a short time.
Option sellers (writers) have limited profit but higher probability of winning because:
Time decay works in their favor.
Markets stay range-bound more often than they trend strongly.
Thus, professional traders often prefer option selling strategies like:
Iron condor
Straddle
Strangle
Credit spreads
Covered calls
Retail traders, on the other hand, prefer buying options due to lower capital requirements.

HOW MANY BUYER TRAPS BEFORE NEW ATH GOLD ?📈 Analysis of Gold Trading Plan (SMC/Order Flow)
🔍 Current Market Context
Structure: The market has shown a strong bullish trend, marked by a Break of Structure (BOS) and a Liquidity Done Sweep around the ₹4,145 price level.
Liquidity:
The market performed a "First Sweep Here" (initial liquidity grab) after the rally, signaling a readiness for a correction.
The main liquidity target for the upward move (Big Boy Liquidity) is set above the ₹4,240 level.
Recent Price Action: After hitting the peak and the initial sweep, the price experienced a sharp decline, creating a correction zone.
🎯 Proposed Trading Plan
The plan focuses on two main scenarios: a Short-term Sell (SELL SCALP) and a Primary Buy (BUY GOLD).
1. Primary Buy Scenario (BUY GOLD)
This is the main scenario to continue the bullish trend (Long).
Entry Zone: BUY GOLD 4126 - 4124.
This zone is likely a critical Order Block or an unmitigated Demand Zone, positioned just below the previous liquidity sweep and acting as a strong support/Displaced/Fair Value Gap (FVG) area.
Stop Loss (SL): SL 4120.
This stop-loss level protects the long position, placed just below the key entry zone to avoid being shaken out by minor liquidity grabs.
The indicated Stoploss Buyer area (around ₹4,145 - ₹4,150) suggests the price drop might aim to sweep prior buyers' liquidity before bouncing from the ₹4,124 - ₹4,126 zone.
Take Profit (TP): The ultimate target is the Liquidity Limit Big Boy (above ₹4,240).
2. Short-term Sell Scenario (SELL SCALP)
This is a short-term trading opportunity (Scalping) during the corrective move.
Entry Zone: SELL SCALP 4208 - 4210.
This area likely represents a Supply Zone or a bearish Order Block following the sharp drop, where hidden selling pressure resides.
Stop Loss (SL): SL 4212.
This is a very tight stop loss, placed just above the entry zone.
Take Profit (TP): The target is the BUY GOLD 4126 - 4124 area (the primary buy entry zone).
⚠️ Key Considerations
Timeline: This plan requires the price to move according to the predicted scenario (drop to the buy zone before rallying).
Confirmation: Traders should wait for structural confirmation on a lower timeframe (e.g., a Change of Character - CHoCH or a bullish BOS) at the 4126 - 4124 buy zone before entering the trade to improve the probability of success.
Risk Management: Using the suggested Stop Loss (SL) is mandatory for capital protection.

Will gold continue to rise? XAUUSD forecast 14/10/251. Fundamental Analysis
Yesterday, gold dropped ~100 points from 4248 → 4145 due to information that after the US Government reopened, some important economic data (CPI, employment) might not be released on schedule.
This has lowered the expectation of a December rate cut to <50%, causing a technical adjustment.
➡ The major trend is still upward – today, prioritise BUY.
Key level: 4208–4213
Above 421x: adjustment ends → prioritise BUY.
Below 421x: the price may retest the lower BUY zone.
2. BUY Zone (priority) – SL 10 points, TP 10–20 points (RR 1:1 → 1:2)
zone 1 : 4140–4143
Zone 2: 4134–4130
zone 3: 4120–4112
3. SELL Reaction Zone – SL 10 points, TP 10 points (RR 1:1)
zone 1: 4245–4248
zone 2: 4280–4285
zone 3: 4300–4305
4. Notes
Today is Friday → trade safely, quick TP.
Do not chase orders, only enter when the price hits the zone.

Gold Near Breakout Point — The Next Move Will Be BigGold is holding firmly inside a tight compression zone, and the market is signalling that a major breakout is loading. Despite yesterday’s pullback, buyers defended key demand levels, showing that bullish momentum is still alive as we approach the weekend session.
📊 Technical Outlook (H1)
Price is currently moving inside a symmetrical triangle, with volatility compressing and liquidity building on both sides.
Key observations from MMFlow structure:
• Zone 1 – Support (Potential Reversal Area)
4,174 – 4,159
→ Strong confluence of trendline support + Fibonacci 38.2% + liquidity sweep potential.
→ If price taps this zone, it's a high-probability long setup.
• Zone 2 – Resistance / Breakout Line
4,207 – 4,212
→ This is the key breakout ceiling.
→ A clean break and retest opens the door toward the next expansion wave.
• Measured Move Target (MMF Expansion Target)
4,244 – 4,252
→ Aligns with Fib 1.618 extension and previous liquidity pocket.
🎯 Trading Scenarios (MMFlow Style)
🟢 BUY Scenario (Primary Bias)
Buy Zone 1: 4,174 – 4,159
SL: below 4,150
TP: 4,205 → 4,212 → 4,228 → 4,244+
Why?
This zone carries the strongest confluence for a bullish reaction before the breakout. Ideal spot for Market Makers to reload.
🔵 BUY Scenario 2 (Break & Retest)
Trigger: Break above 4,207 – 4,212
Entry: Retest of 4,207
SL: below retest wick
TP: 4,228 → 4,244 → 4,252
Why?
Breakout from triangle compression usually leads to fast displacement toward untested liquidity highs.
🔴 SELL Scenario (Short-Term Only — Not Preferred)
Only valid if price fails to break 4,207 and forms a clear rejection.
Entry: 4,207 – 4,212
SL: above 4,220
TP: 4,174 → 4,159
Note: This is a counter-trend micro-play. Primary bias remains bullish.
🧠 MMFlow Insight
The market has been accumulating for multiple sessions, and every dip into demand is being bought aggressively. As long as price stays above 4,159, the bullish structure is intact. A breakout above 4,212 could be the ignition point for the next impulsive expansion toward 4,244 – 4,252.

XAUUSD – H1: PRIORITISE BUY ACCORDING TO PRICE CHANNEL...💛 XAUUSD – H1: PRIORITISE BUY ACCORDING TO PRICE CHANNEL, WATCH FOR ADJUSTMENT MOVES 🎯
🌤 Overview
Gold is maintaining its upward channel on H1 → main mindset: hold Buy longer than Sell.
Asian–European sessions present multiple liquidity clusters suitable for scalping and optimising entry points.
Fundamentals: DXY retreats around 99.15, market reduces expectations of Fed rate cut in December; Fed's Collins hints rates may remain unchanged longer → gold's range may experience short-term fluctuations.
💹 Technical (ICT view)
H1 upward channel maintains a structure of higher lows; the lower trendline is the main support.
4163–4165: confluence of trendline + liquidity (ideal Buy entry point).
4130–4133: deeper support; below that is the 4100–4080 zone (medium-term support; around Fibo ext 1.618 ≈ 4114 and 2.618 ≈ 4054).
Nearby resistance: 4215–4225; a decisive break opens up to 4260.
🎯 Trading Plan Reference
Buy #1 (priority): 4163–4165 │ SL 4157 │ TP 4180 → 4195 → 4220 → 4260
Buy #2 (deeper support): 4130–4133 │ SL 4125 │ TP 4150 → 4175 → 4190 → 4220
Sell (only with confirmation):
Scenario A: M15/M30 gives strong rejection signal at 4215–4225 → SL 4230 │ TP 4200 → 4188 → 4165.
Scenario B: H1 closes below 4157 (breaks structure) then fails retest → target 4135 → 4115 → 4100.
⚠️ Risk Management Notes
Prioritise Buy according to trend; Sell orders are only short-term reactions.
Use M15/M5 to time entries at the specified zones.
If H1 closes below 4125, consider narrowing buy positions, wait for the 4100–4080 zone.
🌷 Conclusion
H1 upward channel still guides the flow 💛. Patiently wait for adjustments to 4163–4165 or 4130–4133 to buy according to trend, manage orders tightly as price approaches 4215–4225.
If useful, please 💛 like – 💬 comment – 🔔 follow LanaM2 for daily gold updates ✨

Gold Maintains Bullish Structure Despite 4245 Rejection We have seen a sharp rejection from the 4245 level yesterday, forming a red candle . However,. Gold found solid support at the weekly R3 level around 4147 and managed to close above it, which is a significant technical development. Currently, we're witnessing a strong recovery rally on lower tf that suggests the bulls aren't ready to give up just yet.
When we zoom in to the daily timeframe, yesterday's downward move appears to be just a normal bearish candle rather than a trend reversal signal. The key factor supporting this view is that price was trading well above the weekly R3 level throughout the session. In a healthy uptrend, these kinds of pullbacks are quite normal and often provide opportunities for fresh entries. The overall bullish structure on the daily chart remains intact, which gives me confidence that this isn't the beginning of a major correction.
Looking at the current setup, the first critical support level at 4140-4150. This zone has proven its importance multiple times, and as long as price holds above this area, I'm maintaining a bullish bias. A daily close below 4140-4150 would be the first warning sign that we might be heading back into consolidation territory. That scenario would require a reassessment of the trend direction.
However, if gold continues to respect the 4140-4150 support zone and builds on today's recovery momentum, we could see price pushing toward higher levels in the coming sessions. The bulls have shown their presence at key support areas, and with the daily structure still favoring upside, the path of least resistance appears to be upward for now.

Gold Technical Retracement Before Continuing Main Uptrend⏰ Timeframe: 30m
📅 Update: 11/14/2025
🔍 Market Context
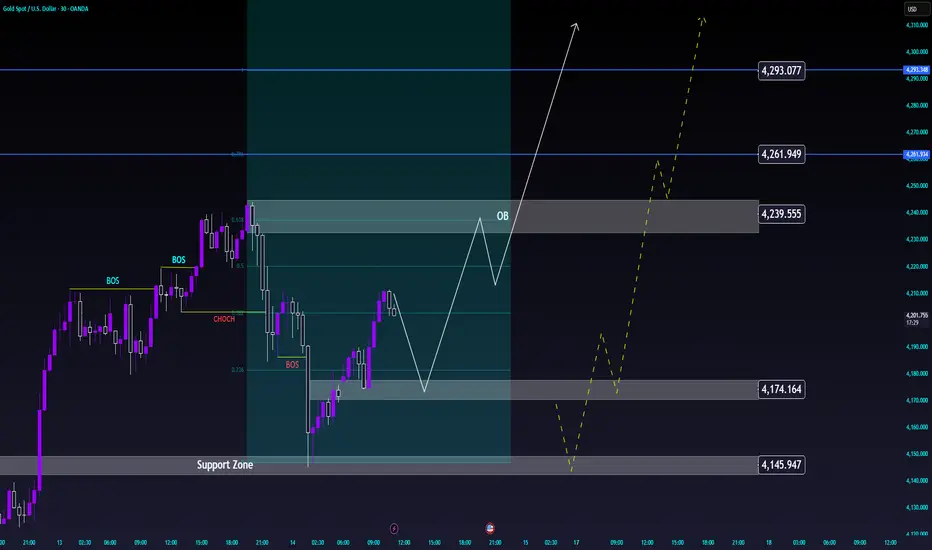
After establishing a short-term peak around 4,239 USD, gold is undergoing a technical retracement to rebalance its structure.
The most recent decline formed a Break of Structure (BOS), but the Support Zone around 4,145–4,174 USD continues to serve as a foundation for the medium-term uptrend.
The current price structure indicates the market is re-accumulating momentum before expanding again.
📊 Technical Structure
Order Block (4,239 USD): a short-term resistance zone where the price may react slightly before continuing upward.
Support Zone (4,145–4,174 USD): a confluence zone with Fibo 0.236–0.382, playing a balancing role in the current cycle.
Liquidity Targets:
• 4,261 USD – intermediate liquidity zone.
• 4,293 USD – main expansion target if the uptrend is maintained.
🎯 Market Outlook
High probability scenario:
1️⃣ The price may retrace to the Support Zone or form a higher low around 4,174 USD, then recover to the OB zone at 4,239 USD.
2️⃣ If the uptrend structure breaks, the market may test deeper towards 4,145 USD before bouncing back.
As long as the price holds above this support zone, the primary trend remains bullish continuation.
🧠 Analyst’s View
This is a phase of market re-accumulation after a rapid increase.
Maintaining a higher low structure will be a confirmation signal for the next expansion phase towards 4,261–4,293 USD.
Buyers are still controlling the cash flow, while sellers mainly participate in the short-term resistance zone.
🛡️ Risk Note
The market is in a slight correction phase – avoid impulsive actions when the price has not completed the accumulation zone.
Gold Maintains Bullish Structure, Prepares for New ExpansionWave⏰ Timeframe: 30m
📅 Update: 11/13/2025
🔍 Market Context
After a short correction at the start of the week, gold has clearly formed a Break of Structure (BOS) on the 30-minute chart, indicating that bullish momentum has returned.
This morning's Asian session witnessed a strong recovery from the Support Zone, confirming that buying pressure remains dominant in the current structure.
The market is approaching the “expansion phase” – where prices typically expand to seek liquidity above.
📊 Technical Structure
Order Block 1 (4,208 USD): a short-term support area, likely to serve as a retest point after the expansion move.
Order Block 2 (4,184 USD): confluence of Fibonacci 0.5–0.618, a deep equilibrium zone within the bullish structure.
Support Zone: the main foundation of the medium-term uptrend, still being preserved.
Extension Levels:
• 4,249 USD → first expansion target.
• 4,267 USD → intermediate liquidity zone.
• 4,292 USD → maximum expansion target within the current cycle.
🎯 Market Outlook
Today's scenario leans towards a continuation bullish direction:
1️⃣ Price may technically correct to the OB 4,208 or 4,184 USD area.
2️⃣ Upon a bullish reaction, the market is likely to expand to 4,267 – 4,292 USD, where short-term selling liquidity is concentrated.
3️⃣ Losing the 4,184 USD level will temporarily shift the structure to rebalancing (sideways).
🧠 Analyst’s View
Gold is in the “expansion reaccumulation” phase, meaning after attracting liquidity below, prices begin to expand following the main trend.
Continuous BOS signals indicate that buyers are reasserting control.
As long as prices remain above the 4,184 USD area, the intraday bias remains predominantly bullish.
🛡️ Risk Note
The market is expanding rapidly, so pullback reactions to the OB area may be highly volatile.
Let your trade ideas run and let's observe together.

Gold Maintains Uptrend, Watch for Pullback to Buy with Cash Flow🔍 Context & Market Structure
After a strong upward impulse from a low liquidity area, the price has broken the downtrend structure and formed a bullish BoS on H1.
Currently, gold is accumulating above the Support Zone at 4,183 USD after creating a new peak and leaving a FVG just below the current price .
Above is the Liquidity Zone $$$ around 4,232 USD – a concentration of sell-side stop losses and buy-side profit-taking orders, likely to create a “final push” that attracts liquidity.
=> Overall: the main trend remains bullish , prioritising waiting for a pullback to discount levels to buy with the trend rather than chasing orders at high levels.
💎 Key Technical Zones
Liquidity Zone $$$: around 4,232 USD – upper liquidity area, prone to profit-taking reactions.
Current FVG: price gap area just below the current price (around 4.20x) – expected to “fill the gap” before continuing.
Support Zone 1: 4,183 USD – nearest support, confluence with the area where the upward impulse began to slow.
Support Zone 2: 4,140 USD – stronger support, aligning with the old structure.
Liquidity Clear: 4,101 USD – lower liquidity area, if swept, it would be a very attractive discount for swing buyers.
📈 Proposed Trading Scenarios
1️⃣ Main Scenario – Buy with the trend at FVG / 4,183 USD
Priority to wait for the price to:
Either fill the FVG around 4.20x and show a rejection candle,
Or clearly retest Support 4,183 USD with a bullish reversal signal on M15–H1.
When a confirmation signal appears:
→ Consider buying (BUY) around 4.19x – 4.18x .
Stoploss: below 4,175 USD (below the nearest low and support).
TP reference:
TP1: 4,210 USD
TP2: 4,232 USD (Liquidity Zone $$$)
TP3: trailing if the price breaks through 4,232 and maintains the bullish structure.
2️⃣ Alternative Scenario – Deeper Pullback Before Continuing Upward
If the price clearly breaks 4,183 USD and closes an H1 candle below:
→ Avoid buying hastily, wait for the price to continue adjusting to Support 4,140 USD or even Liquidity Clear 4,101 USD .
At these zones, if there appears:
strong rejection candles,
or small reversal structures (bullish ChoCH on M15),
→ Then consider buying at a discount with better RR, targeting a return to 4,183 → 4,210 → 4,232 USD.
3️⃣ Short-term Sell Scenario (for experienced scalpers only)
If the price hits Liquidity Zone 4,232 USD but shows strong rejection (long wick, high sell volume):
→ Consider short-term sell scalp back to the 4.20x – 4,183 USD area.
This is a counter-trend trade, so:
keep the volume small,
short TP,
tight SL above the newly formed peak.
⚠️ Risk Management Notes
Do not FOMO buy when the price is testing near the 4.23x area – this is a prone-to-sell area.
Prioritise waiting for a pullback to FVG / Support for a better entry point and RR.
Always adjust volume according to actual SL, avoid over-leverage during strong market volatility.
“Buy the dip in liquidity zones, do not chase orders at the peak – that's how to go with the big money flow.”

GOLD H1 – Gold Awaits U.S. PPI Data for Directional Clarity🟡 XAUUSD – Intraday Smart Money Plan | by Ryan_TitanTrader (13/11)
📈 Market Context
Gold is consolidating after a strong impulsive leg, with intraday traders now focused on the upcoming U.S. Producer Price Index (PPI) release — a key inflation metric that often shapes Fed expectations.
• A hot PPI reading could strengthen the USD and trigger a sell-off from premium levels.
• A softer print may weaken the dollar, encouraging another liquidity grab above 4250.
Institutional order flow shows potential for engineered liquidity sweeps around both extremes before the next directional push.
🔎 Technical Analysis (1H / SMC Structure)
• Structure: Still bullish overall, but showing early distribution near the 4250 handle.
• Premium Zone: 4255–4253 aligns with an unmitigated supply and prior buy-side liquidity pool — a prime short setup if price reacts after a liquidity sweep.
• Discount Zone: 4168–4166 sits within the recent FVG and above EMA100 — a valid area for re-accumulation and continuation if price corrects deeper.
• Liquidity: Equal highs at 4255 and lows near 4156 signal potential stop-hunt traps before a decisive move.
🔴 Sell Setup (Premium Reaction Zone)
• Entry: 4,255 – 4,253
• Stop-Loss: 4,265
• Take-Profit Targets:
→ 4,182 (previous BOS zone)
→ 4,148 (mid-range equilibrium)
→ 4,110 (discount reaction zone)
📌 Valid only if price sweeps buy-side liquidity and confirms bearish BOS on M5–M15.
🟢 Buy Setup (Discount Reaction Zone)
• Entry: 4,166 – 4,168
• Stop-Loss: 4,156
• Take-Profit Targets:
→ 4,210 (short-term liquidity pocket)
→ 4,248 (imbalance fill zone)
→ 4,255 (final liquidity target)
📌 Valid only if price mitigates the FVG and reclaims structure with bullish BOS confirmation.
⚠️ Risk Management Notes
• Wait for PPI volatility before entering trades.
• Avoid trading mid-range (4180–4210) – low R/R zone.
• Scale out partials near liquidity points and trail stops post-confirmation.
• Maintain disciplined risk: 1–2% max per setup.
Summary
Gold is in pre-news equilibrium, with both buy- and sell-side liquidity pools clearly defined:
• Sell zone: 4255–4253 (premium reaction area)
• Buy zone: 4168–4166 (discount re-entry area)
Expect engineered liquidity grabs before a decisive move — patience and structure confirmation remain key.
📍Follow @Ryan_TitanTrader for real-time Smart Money updates ⚡

Gold Trading Strategy for 14th November 2025⭐ GOLD Intraday Levels (30-min Candle Strategy)
🟢 BUY Setup
📈 Buy Above: $4,230 (30-min candle close above the high)
🎯 Targets:
$4,240
$4,250
$4,260
🔴 SELL Setup
📉 Sell Below: $4,143 (30-min candle close below the low)
🎯 Targets:
$4,133
$4,123
$4,113
⚠️ Disclaimer
This information is for educational and informational purposes only. It is not financial advice. Trading in commodities, forex, and indices involves substantial risk. Always do your own analysis or consult with a certified financial advisor before taking any trade. Never risk more than you can afford to lose.

XAUUSD – When the Market Starts to “Smell” a Bullish MoveLooking at the current price action, it’s quite clear that gold is entering a new bullish phase supported by both fundamental catalysts and smart money flow . With the U.S. government preparing to reopen and key economic data returning, investors are increasing their bets on the possibility that the Fed may cut interest rates next month . In a climate where political and economic uncertainty is still lingering, gold naturally becomes a preferred safe-haven asset.
On the chart, XAUUSD is maintaining a clean and steady uptrend , consistently bouncing from the trendline and forming higher highs and higher lows. These precise retests show that buyers are firmly in control . Price is now moving towards the 4,300 zone, where some short-term volatility may appear before heading further into the 4,380 resistance.
As long as gold holds above the trendline support , the market can continue its bullish momentum in the coming sessions. Every pullback at this stage acts like a fresh boost , giving buyers more strength to push the market higher.

Gold Analysis and Trading Strategy | November 13–14✅From the 4H chart, gold reached a recent high of 4245.10 before encountering clear resistance and pulling back. The upper Bollinger Band (4234.51) acted as a strong rejection zone, and the price has since retreated toward the 4200 level.
Currently, gold is consolidating between 4190–4210, with short-term moving averages (MA5 at 4204.33, MA10 at 4180.59) forming a potential narrow convergence zone. The MA20 (4150.72) provides additional dynamic support below.
This suggests that while the broader trend remains bullish, the short-term structure has entered a minor correction phase after the sharp rally.
If gold stabilizes above 4175–4180, the medium-term bullish outlook remains intact. A break below that zone could open the way toward 4150–4140, whereas a rebound above 4215–4220 could signal renewed upside momentum.
✅On the 1H timeframe, gold shows a short-term pullback structure after testing 4245. The price has broken below the short-term moving averages (MA5 4207.15, MA10 4220.06), and the Bollinger midline (4211.97) now acts as immediate resistance.
The candles indicate a loss of upward momentum, and the MACD is turning flat, confirming a short-term correction pattern. Support lies around 4179–4185, aligning with the lower Bollinger Band.
If this support holds, we may see a technical rebound toward 4210–4225. However, failure to defend 4175 would likely trigger deeper retracement toward 4150.
Overall, gold is consolidating within a healthy pullback after a strong run-up, and a base-building phase may precede another bullish leg.
🔴 Resistance Levels: 4215 / 4235 / 4245
🟢 Support Levels: 4175 / 4150 / 4138
✅ Trading Strategy Reference
🔰 If gold rebounds to 4215–4230 and shows rejection, consider light short positions, targeting 4180–4160, with a stop loss above 4248.
🔰 If gold pulls back to 4175–4185 and holds, consider buying on dips, targeting 4215–4240.
📈 Summary:
Gold remains in a broader uptrend, but short-term charts show correction and consolidation pressure after hitting 4245.
Focus on the 4175–4230 range — buy on dips near support and take partial profits near resistance.
XAU Empire | Bullish FlowXAU Empire | Bullish Flow
The market maintains a bullish structure after confirming a break of structure (BOS). Price is currently retracing into a short-term demand zone near 4,100, showing healthy correction within trend. This zone is acting as accumulation before potential continuation.
Momentum supports a move toward 4,316 – 4,386, aligning with unfilled imbalance and previous supply area. Institutional flow remains on the buy side as long as price holds above 4,080.
---
Market Bias: Bullish
Short-Term Range: 4,100 – 4,386
Key Focus: Retracement for continuation

LiamTrading – XAUUSD M45 | Fibonacci perspective on the ...LiamTrading – XAUUSD M45 | Fibonacci perspective on the upward wave: watch for sell at 2.618 @ 4229–4231, wait to buy at FVG 4174–4172
Quick context: News of the US government reopening eases tensions, but gold prices in the Asian session this morning only rose slightly before moving sideways – accumulating. On M45, the triangle has broken upwards but buying momentum hasn't truly exploded; the market may test the price gap areas (FVG) before choosing the next direction.
Technical Analysis
Trendline & M45 structure: The rise after breakout is running along the short-term upward trendline; the old triangle peak becomes resistance near 4215.
Fibonacci Extension:
2.272 ≈ 4215: pivot point; staying above this opens the path for higher levels.
2.618 ≈ 4229–4231: extended resistance – a zone prone to rejection/short reversal.
FVG & Liquidity Zones:
FVG #1: 4195–4198 – likely to fill before continuing upwards.
Liquidity: 4184–4188 – volume attraction zone between FVG and trendline.
Fibo 0.618 + FVG: 4172–4174 – strong confluence for the buyback scenario in line with the trend.
Invalidation point: breaking 4166 weakens the M45 upward structure, risking a pullback to lower zones.
Trading Scenarios
Scenario 1 – Trend-following Buy (priority)
Entry: 4172–4174 (Fibo 0.618 + FVG)
SL: 4166
TP: 4190 → 4215 → 4240 → 4280
Note: Prioritise when a clear rejection candle/lower wick appears at 417x.
Scenario 2 – Counter-trend Sell scalp at extended resistance
Entry: 4229–4231 (Fibo 2.618)
SL: 4236 (above the nearest peak)
TP: 4215 → 4196 → 4186 → 4175
Note: Quick scalp; abandon if M45 closes strongly above 4231–4233.
Scenario 3 – Buy on break & hold of 4215 (break & retest)
Condition: M45 closes above 4215, retests holding 4212–4216
Entry: 4216–4218
SL: 4207
TP: 4229–4231 → 4260 → 4285–4300
Which price zone do you find noteworthy today? Comment below & hit Follow on LiamTrading channel for the latest updates.

Trade Journal 13/11/2025 XAUUSD SellsI took the same setup as I took yesterday, Gold took out London Highs and Silver failed to do so. Entered on the close of 15m candle.
As customary exited at 2Rs.
Simple time based divergence model.
This model has formed thrice this week, stopped out once, exited at a small loss yesterday and today hit 🎯
As always, manage your risk and keep winning!!

Elliott Wave Analysis – XAUUSD | 13/11/2025🔸 1. Momentum
D1 Timeframe
• D1 momentum continues to close inside the overbought zone, signaling weakening buying pressure.
• A bearish reversal may occur at any moment.
H4 Timeframe
• H4 momentum is also in the overbought zone and starting to contract → a potential signal that H4 may soon turn downward.
H1 Timeframe
• H1 momentum is currently oversold, so a short-term bounce is likely to push momentum back toward the overbought area.
________________________________________
🔸 2. Wave Structure
D1 Structure
• No significant change compared to yesterday; price is still heading toward the completion zone of wave X.
H4 Structure
• Price is inside wave X and currently reaching the 0.618 Fibonacci retracement of wave W (purple).
• This area aligns with both D1 and H4 momentum, creating a strong reversal confluence.
• We wait for an H4 bearish close to confirm the potential top of wave X.
• Note: The current H4 candle is compressing tightly, so one more upward spike is still possible before reversal.
H1 Structure
• Within the red 5-wave sequence, a smaller 5-wave black structure is developing.
• RSI showed a bearish divergence at the top of wave 3 (black) → early signal of a wave 5 top forming.
• Based on wave projections, wave 5 black (which also completes wave 5 red and wave X) may extend into:
o 4223 (0.382 Fibo of wave 1–3)
o 4248 (0.618 Fibo of wave 1–3)
Confluence for wave-top formation:
• RSI divergence between wave 3 and wave 5
• H1 momentum rising into overbought then reversing
→ This supports the expectation of wave X topping around these zones.
________________________________________
🔸 3. Trading Plan
You have three entry options, depending on your trading style:
✅ 1. Sell Limit: 4223 – 4225
• SL: 4233
• TP1: 4181
• TP2: 4145
• TP3: 4046
✅ 2. Sell Limit: 4248 – 4250
• SL: 4260
• TP1: 4181
• TP2: 4145
• TP3: 4046
✅ 3. Sell Stop at 4181
• Trigger only when the candle closes below 4181 (wave 4 black low).
• This method offers stronger confirmation, since structure breaks down before entry.
________________________________________
📌 Summary
• Wave X is approaching its final target area and multiple signals support a potential top.
• H1 may still push higher toward 4223–4248 before reversing.
• These two zones are strong sell areas with momentum and divergence confluence.
• All three entry methods (limit – limit – breakout) provide strategic options depending on risk preference.

GOLD: Big Pullback Loading Before a 4400 Rally?Bias: Bullish – Buy-the-Dip Strategy
Approach: Smart Money Concepts (SMC)
🌐 Market Context
Gold continues to show a strong recovery, maintaining a clear bullish structure across the H1, H4, and Daily timeframes.
Institutional order flow remains firmly on the buy-side as:
Liquidity on H1/H4 highs is being swept consistently
Pullbacks are respecting Demand Order Blocks (OBs)
Multiple Breaks of Structure (BOS) confirm bullish continuation
However, the region 4280 – 4330 (FVG + major trap zone) has historically triggered strong distribution – making it a likely area for liquidity hunts and fake breakouts before any corrective move.
🎯 Key Price Levels
🔴 Resistance Zones (Potential Distribution Areas)
4274 – 4295
4330 – 4345 (FVG + Biggest Trap Zone)
Expect volatility and sharp reactions here – suitable for partial profit-taking, not for chasing buy entries.
🟢 Support / Buy Zones (Institutional Demand Areas)
1️⃣ BUY Opportunity – Shallow Pullback (High Probability)
Entry: 4170 – 4190 (H4 OB + BOS retest)
SL: Below 4170
TP1: 4275
TP2: 4360 – 4400
➡️ This is today’s primary setup. Requires clear bullish confirmation on entry.
2️⃣ BUY Opportunity – Deep Pullback (High R:R Setup)
Entry: 4100 – 4120 (Deep OB + liquidity sweep level)
SL: Below 4100
TP1: 4275
TP2: 4360 – 4400
➡️ Best scenario if the market retraces deeply — exceptional Risk:Reward.
📉 Why Selling Is Not a Priority
Despite resistance overhead, the market remains:
Bullish in structure
Supported by demand zones
Without a confirmed Market Structure Shift (MSS) → Bearish BOS
Therefore, selling remains counter-trend and not part of the main trading plan today.
📈 Institutional Technical Outlook (H1/H4)
1. Price approaching 4280 – 4330 trap zone
Expect:
Liquidity sweeps
Wick-driven false breakouts
Short-term corrections back into OB before continuing upwards
2. Liquidity Map
4170 liquidity pool below current price → likely target for engineered pullback
4300 – 4350 equal highs → attractive upside draw for smart money
🧠 Professional Trade Plan Summary
✔️ Do not chase breakouts near resistance
✔️ Wait for price to retrace into:
4170 – 4190
4100 – 4120
✔️ Main targets:
TP1: 4275
TP2: 4360 – 4400
✔️ At TP1:
Secure 50%
Move SL to Break-Even
✔️ Plan invalidation if price closes below 4100
📌 Notes for Large-Capital Traders (UK/EU)
Today’s environment is ideal for high-quality, low-frequency entries at institutional demand zones.
Avoid buying at highs; patience will deliver the best setups.
This plan follows a clean institutional trend-following methodology — suitable for accounts prioritising consistency and low drawdown.
📊 Daily Bias: Strong BUY
⏳ Waiting for pullback towards 4170 – 4190 or 4100 – 4120
🚀 Targeting 4360 – 4400 over the next sessions

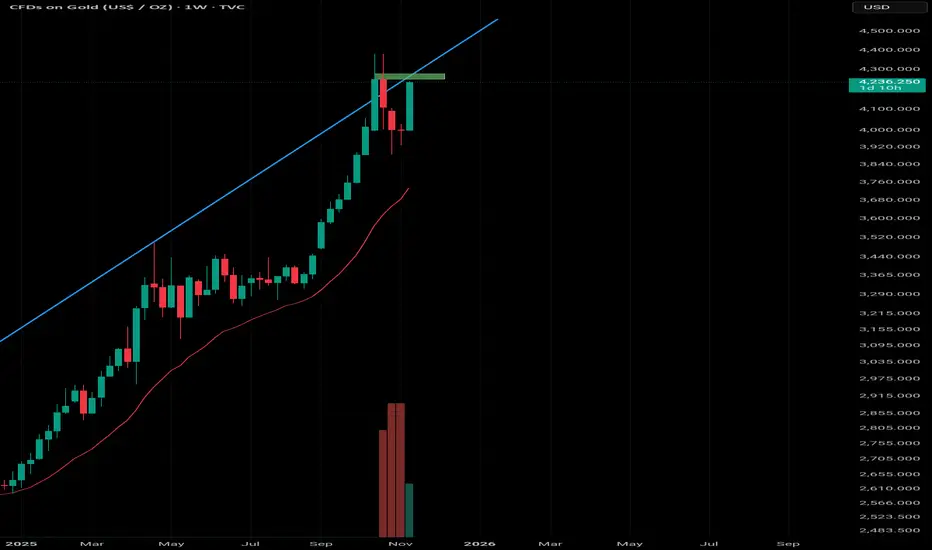
Resistance of multi year trending lineGold after a clinical 200$ upmove in 2days is nearing a multi year resistance trending at 4280.
I'll b very cautious at 4250-4280 levels if holding longs while waiting for weak candle to form near resistance for any short positions.
XAUUSDTime Cycle is a routine that allows you to map the movement of a stock by measuring the high and low levels of the stock on a day or period. However, it does not prove whether a reversal will occur in the next time cycle; it is only a probability. But it makes you profitable 80% of the time.
Regardless of the outcome, the candle formed on the day of the time cycle carries significant significance. The market respects this candle, whether it goes up or down, which is very important. Time Cycle often stops short near the candle. You will notice on the chart that it often looks like a support or resistance area.
Time Cycle candles also tell you about continuation or reversal, but you have to forgive the high and low of the candle formed in the time cycle.
You do not have to make any decisions yourself. This is its specialty.

Premium Chart AnalysisHow to Trade Chart Patterns
To effectively trade chart patterns, follow these steps:
Identify the Pattern Early
Use clear trendlines to mark support and resistance zones.
Confirm shape and symmetry before assuming a pattern.
Wait for Breakout Confirmation
A breakout should be supported by volume expansion—this validates the move.
Avoid acting before confirmation; false breakouts are common.
Set Entry and Exit Points
Enter after a confirmed breakout (preferably with candle close beyond resistance/support).
Target = Height of pattern projected from breakout point.
Stop-loss = Just below (for bullish) or above (for bearish) the breakout level.
Use Multiple Timeframe Analysis
Confirm pattern on higher timeframes to avoid false signals.
Align short-term setups with long-term trends for stronger conviction.

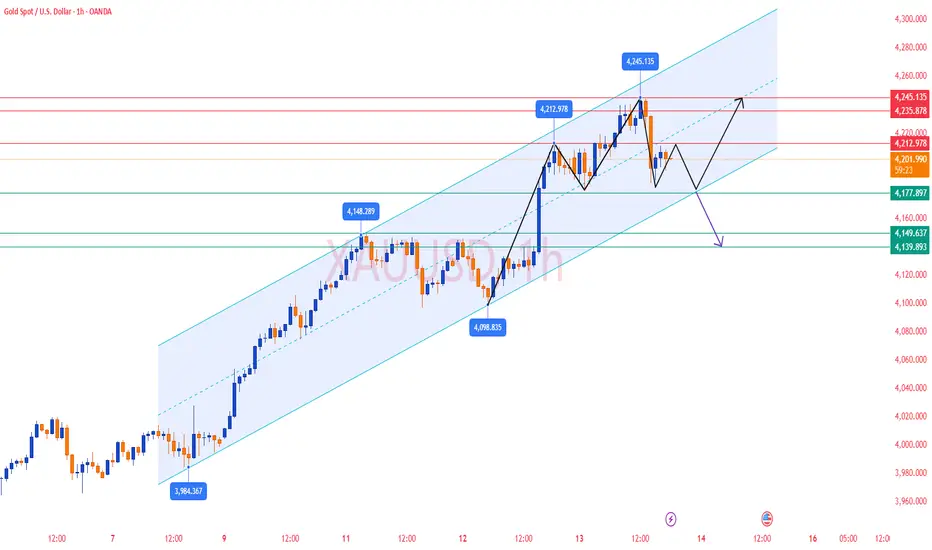
Gold Bullish Continuation Setup from Ascending Channel Support✅ Analysis – XAUUSD (Gold)
1. Market Structure
Price is moving inside a clean ascending channel, showing a sustained uptrend.
The lower boundary (rejection line) is acting as strong support, where buyers have entered repeatedly.
The current price action is showing a pullback toward this support area, which is typical before a continuation move higher.
2. Current Price Action
Price has retraced back into the buy zone near the channel support.
Candlesticks show slowing bearish momentum, suggesting buyers may soon take control.
Your chart projection indicates a possible bullish bounce.
3. Trade Setup
✅ Buy Zone: Near the rejection line / lower channel
✅ SL (Stop-Loss): Below the support line — smart placement to protect against channel breakdown
✅ Target: Upper resistance of the channel (around 4230 – 4260 zone)
This gives a good risk-to-reward ratio, based on trend continuation.
4. Bullish Expectation
As long as price stays above the rejection line, the uptrend remains valid.
A bounce from this zone is likely to push price toward the target box.
