Gold Market Analysis – Sell Opportunity Emerging in XAU/USDGold has been climbing with strong momentum, but the current leg is showing signs of transition. After a period of consolidation, the market expanded upward, taking liquidity from previous highs and creating an extended run. This behavior often reflects the final stage of a bullish cycle before rebalancing begins.
What stands out now is the engineered path of price: a push into untested liquidity zones above, followed by a potential shift as large players unwind positions. Once liquidity is collected at the extremes, price tends to rotate back into inefficiencies left behind during the rapid climb.
This suggests gold is not simply trending higher, but moving through a liquidity cycle. The near-term structure favors a sweep of higher levels, then a corrective phase where price retraces to refill imbalances and reset order flow for the next directional move.
Futures market

Copper fresh buy bear 945-948 upside 982-990 target Copper buy on dip
How My Harmonic pattern projection Indicator work is explained below :
Recent High or Low :
D-0% is our recent low or high
Profit booking zone ( Early / Risky entry) : D 12.3% -D 16.1 % is
range if break them profit booking start on uptrend or downtrend but only profit booking, trend not changed
SL reversal zone (Safe entry ) : SL 23.1% and SL 25.5% is reversal zone if break then trend reverse and we can take reverse trade
Target : T1, T2, T3, T4 and .
Are our Target zone
Any Upside or downside level will activate only if break 1st level then 2nd will be active if break 2nd then 3rd will be active.
Total we have 7 important level which are support and resistance area
Until , 16% not break uptrend will continue if break then profit booking will start.
If break 25% then fresh downtrend will start then T1, T2,T3 will activate
1,3,5,10,15,20 minutes are short term levels.
30 minutes 60 minutes , 2 hours,3 hours, ... 1 day and 1 week chart positional and long term levels

Crude sell recommended near 5780 now Book profit at 5470-5460 Crude sell on eise recommended near 5780 now book profit at 5470-5460 and wait for some consolidation they buy also if inventory data positive
How My Harmonic pattern projection Indicator work is explained below :
Recent High or Low :
D-0% is our recent low or high
Profit booking zone ( Early / Risky entry) : D 12.3% -D 16.1 % is
range if break them profit booking start on uptrend or downtrend but only profit booking, trend not changed
SL reversal zone (Safe entry ) : SL 23.1% and SL 25.5% is reversal zone if break then trend reverse and we can take reverse trade
Target : T1, T2, T3, T4 and .
Are our Target zone
Any Upside or downside level will activate only if break 1st level then 2nd will be active if break 2nd then 3rd will be active.
Total we have 7 important level which are support and resistance area
Until , 16% not break uptrend will continue if break then profit booking will start.
If break 25% then fresh downtrend will start then T1, T2,T3 will activate
1,3,5,10,15,20 minutes are short term levels.
30 minutes 60 minutes , 2 hours,3 hours, ... 1 day and 1 week chart positional and long term levels

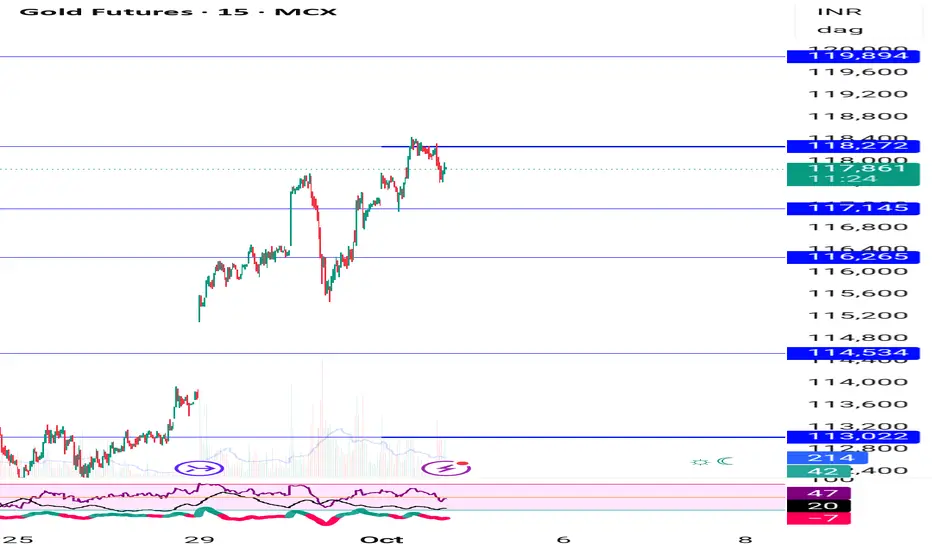
Gold holding buy from 116550 upside target 3910,3955,3990 comexGold mcx holding buy trade from 116550 , upside target 3910,3955,3990 on comex
How My Harmonic pattern projection Indicator work is explained below :
Recent High or Low :
D-0% is our recent low or high
Profit booking zone ( Early / Risky entry) : D 12.3% -D 16.1 % is
range if break them profit booking start on uptrend or downtrend but only profit booking, trend not changed
SL reversal zone (Safe entry ) : SL 23.1% and SL 25.5% is reversal zone if break then trend reverse and we can take reverse trade
Target : T1, T2, T3, T4 and .
Are our Target zone
Any Upside or downside level will activate only if break 1st level then 2nd will be active if break 2nd then 3rd will be active.
Total we have 7 important level which are support and resistance area
Until , 16% not break uptrend will continue if break then profit booking will start.
If break 25% then fresh downtrend will start then T1, T2,T3 will activate
1,3,5,10,15,20 minutes are short term levels.
30 minutes 60 minutes , 2 hours,3 hours, ... 1 day and 1 week chart positional and long term levels
Gold holding buy from 3820 , upside 3910,3955,3990Gold holding buy trade from 3820 , upside target 3910,3955,3990
How My Harmonic pattern projection Indicator work is explained below :
Recent High or Low :
D-0% is our recent low or high
Profit booking zone ( Early / Risky entry) : D 12.3% -D 16.1 % is
range if break them profit booking start on uptrend or downtrend but only profit booking, trend not changed
SL reversal zone (Safe entry ) : SL 23.1% and SL 25.5% is reversal zone if break then trend reverse and we can take reverse trade
Target : T1, T2, T3, T4 and .
Are our Target zone
Any Upside or downside level will activate only if break 1st level then 2nd will be active if break 2nd then 3rd will be active.
Total we have 7 important level which are support and resistance area
Until , 16% not break uptrend will continue if break then profit booking will start.
If break 25% then fresh downtrend will start then T1, T2,T3 will activate
1,3,5,10,15,20 minutes are short term levels.
30 minutes 60 minutes , 2 hours,3 hours, ... 1 day and 1 week chart positional and long term levels

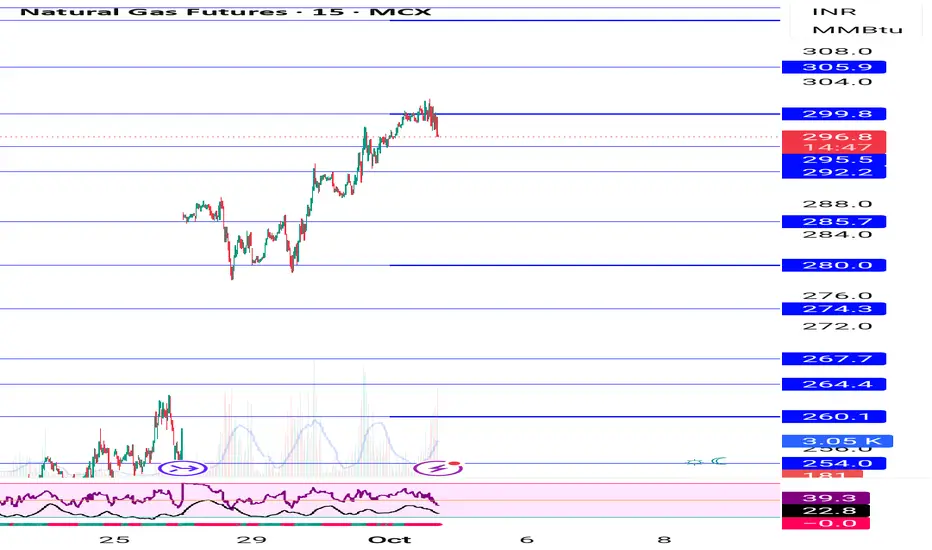
Natural gas 302 target hit then some dip , again buy on dip 290Natural gas 302 target hit buy recommended near 280 , again buy near 290
How My Harmonic pattern projection Indicator work is explained below :
Recent High or Low :
D-0% is our recent low or high
Profit booking zone ( Early / Risky entry) : D 12.3% -D 16.1 % is
range if break them profit booking start on uptrend or downtrend but only profit booking, trend not changed
SL reversal zone (Safe entry ) : SL 23.1% and SL 25.5% is reversal zone if break then trend reverse and we can take reverse trade
Target : T1, T2, T3, T4 and .
Are our Target zone
Any Upside or downside level will activate only if break 1st level then 2nd will be active if break 2nd then 3rd will be active.
Total we have 7 important level which are support and resistance area
Until , 16% not break uptrend will continue if break then profit booking will start.
If break 25% then fresh downtrend will start then T1, T2,T3 will activate
1,3,5,10,15,20 minutes are short term levels.
30 minutes 60 minutes , 2 hours,3 hours, ... 1 day and 1 week chart positional and long term levels
Silver holding buynfrom 144000 , target 145600Silver holding buy from 144000, target 145600 , upside target big but mcx closed tomorrow so will book profit.
Yesterday also bought at 141500 and booked today at 144100
How My Harmonic pattern projection Indicator work is explained below :
Recent High or Low :
D-0% is our recent low or high
Profit booking zone ( Early / Risky entry) : D 12.3% -D 16.1 % is
range if break them profit booking start on uptrend or downtrend but only profit booking, trend not changed
SL reversal zone (Safe entry ) : SL 23.1% and SL 25.5% is reversal zone if break then trend reverse and we can take reverse trade
Target : T1, T2, T3, T4 and .
Are our Target zone
Any Upside or downside level will activate only if break 1st level then 2nd will be active if break 2nd then 3rd will be active.
Total we have 7 important level which are support and resistance area
Until , 16% not break uptrend will continue if break then profit booking will start.
If break 25% then fresh downtrend will start then T1, T2,T3 will activate
1,3,5,10,15,20 minutes are short term levels.
30 minutes 60 minutes , 2 hours,3 hours, ... 1 day and 1 week chart positional and long term levels

Silver holding buy trade from 47.20 today yesterday also buySilver holding buy from 47.20 yesterday also bought at 46.30 and booked at 47.10
How My Harmonic pattern projection Indicator work is explained below :
Recent High or Low :
D-0% is our recent low or high
Profit booking zone ( Early / Risky entry) : D 12.3% -D 16.1 % is
range if break them profit booking start on uptrend or downtrend but only profit booking, trend not changed
SL reversal zone (Safe entry ) : SL 23.1% and SL 25.5% is reversal zone if break then trend reverse and we can take reverse trade
Target : T1, T2, T3, T4 and .
Are our Target zone
Any Upside or downside level will activate only if break 1st level then 2nd will be active if break 2nd then 3rd will be active.
Total we have 7 important level which are support and resistance area
Until , 16% not break uptrend will continue if break then profit booking will start.
If break 25% then fresh downtrend will start then T1, T2,T3 will activate
1,3,5,10,15,20 minutes are short term levels.
30 minutes 60 minutes , 2 hours,3 hours, ... 1 day and 1 week chart positional and long term levels

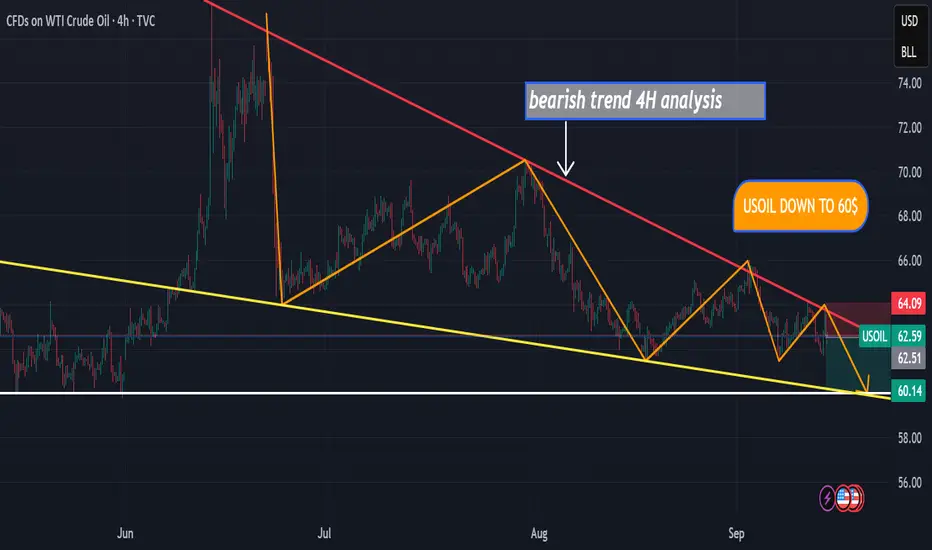
USOIL DOWN TO 60$hello,
I hope you’re doing well. I’ve identified a high-probability short setup on USOIL in the 4H timeframe. The chart is showing a clear downtrend, and based on the current momentum, I expect USOIL to reach the $60 level in the coming days
IBROURI Abdessamad
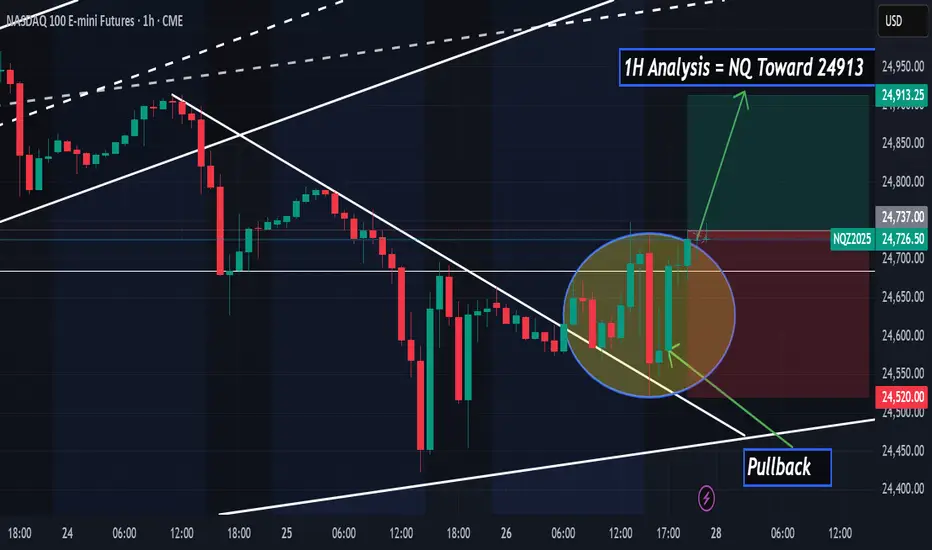
Bullish Opportunity on Nasdaq 100hello,
On the 1-hour chart, the Nasdaq 100 shows a pullback to the trendline, suggesting a high-probability buying opportunity.
Ibrouri Abdessamad
Will crude drop to $61.70?hello,
according to my analysis on 2h time frame there is high probability that crude oil futures could drop to 61.7 IN FEW HOURS,

spot gold or mcx gold update as per chartgold spot looks stair pattern or now news in focus usa shut down--
technical lvl- spot gold abv 3883 looks again up side 3900-3920--3945$ where support 3860$ which break blow with volume than more down fall 33852--42--34$ expect.
mcx gold sustain abv 118300 looks 119k near where support 117700 which can be create down correction in evening side.

ATH $3871: Shutdown Fear & 97% Fed Cut Fuel Gold Surge
Hello, investors and traders!
Gold continues to show phenomenal strength, setting a new ATH at $3,871.45/oz (on Sept 30), and closing at $3,843.43/oz. This gain confirms the strongest September since 2011, solidly confirming the explosive growth trend for the yellow metal.
Fundamental Analysis: Politics and the Fed Drive Buying Wave
Two core drivers are pushing gold prices higher, making any attempt to short (call the top) extremely risky:
Political Instability: The risk of a looming US Government shutdown is ratcheting up uncertainty and strongly boosting safe-haven demand.
Low-Rate Expectations: Weakening US jobs data has nearly locked in the probability that the Fed will cut interest rates in October. The market is currently pricing in a 97% chance of a Fed rate cut.
Technical Analysis & Trading Strategy
After a recent shock drop of 70 points, Gold quickly absorbed the selling pressure and created a new ATH, proving that buying pressure is overwhelming. The strong upward bias is undeniable.
Outlook: Continue to Prioritize Buy given the powerful trend and supportive fundamentals. Only attempt Sell strategies near psychological resistance levels with an extremely tight Stop Loss (SL).
Key Resistance: $3894, $3904, $3914, $3924
Key Support: $3869, $3843, $3834
Suggested Trading Strategy (Absolute Risk Management):
BUY SCALP
Zone: $3870 - $3868 / SL: $3864
TP: $3875 - $3885 - $3900
BUY ZONE
Zone: $3834 - $3832 / SL: $3824
TP: $3842 - $3862 - $3892
SELL SCALP (High Risk)
Zone: $3904 - $3906 / SL: $3910
TP: $3901 - $3891 - $3876
SELL ZONE (High Risk)
Zone: $3925 - $3927 / SL: $3935
TP: $3917 - $3907 - $3897 - $3887 - $3877 - $3867
The market is running on fear and rate-cut anticipation. Are you betting on the $3900 mark this week? 👇
#Gold #XAUUSD #ATH #Fed #GovernmentShutdown #TradingView #InterestRates #FinancialMarkets

XAUUSD – Gold Smashes to New ATH: Bulls in Full Control📊 Market Overview
Gold has surged into uncharted territory, breaking through to a fresh All-Time High (ATH). The earlier dip toward 3,800 USD acted as nothing more than a springboard, allowing buyers to reload before launching this powerful breakout.
Safe-haven demand continues to fuel the rally, as concerns over a potential US government shutdown and expectations of more Fed rate cuts strengthen bullish momentum.
📍 Crucial Levels to Watch
🔴 SELL Reaction Zone
3,911 – 3,915 (Liquidity Resistance) → Potential short-term ceiling, profit-taking may appear here.
🟢 BUY Reaction Zones
3,830 – 3,820 (Fibo Support) → First pullback level for intraday buyers.
3,808 – 3,810 → Secondary support zone for a deeper correction.
3,747 – 3,752 (Liquidity BUY Zone) → Stronger base for swing buyers.
🎯 Trading Setups
1️⃣ Buy the Dip (Primary Play)
Entry: 3,830 – 3,820, confirmation needed.
Targets: 3,900 → 3,915, extend toward 3,950+ if momentum remains strong.
Stop: Below 3,808.
2️⃣ Sell the Spike (Countertrend)
Entry: 3,911 – 3,915, only on visible rejection.
Targets: 3,871 → 3,830.
Stop: Above 3,922.
3️⃣ Swing Buy Opportunity
Entry: 3,752 – 3,747 (Fibo confluence).
Targets: 3,830 → 3,900.
Stop: Below 3,735.
⚡ Pro Tips
Trend bias = Strongly Bullish, prioritize long setups.
Countertrend shorts are tactical; keep stops tight.
Headlines from the US political scene and Fed could trigger extra volatility at highs.
💬 Discussion
Will gold extend to 3,950 – 4,000 USD, or is a sharp pullback around the corner? Drop your views and charts below 👇

Gold |Power of Neowave AnalysisIf you have any doubts related to your stocks and portfolio, ask in the comments we will provide you Neowave Chart for that.
To understand my view Kindly watch the videos-
Video Analysis 01/10/2025
Video Analysis 30/09/2025
Video Analysis 29/09/2025
GOLD H1 – THE WOLF WAVE SCENARIO IS FORMINGHello trader 👋
Gold has surged back strongly after a nearly 70-point drop yesterday. Currently, the price is fluctuating around the newly established ATH, with the potential to extend short-term targets towards 3,960 – 4,000 if the upward trend continues to hold.
On the H1 chart, the price structure indicates the possibility of forming a Wolfe Wave pattern. This will be the main reference frame for trading throughout the day, capitalising on the oscillation range within the pattern.
⚖️ Short-term Trading Strategy
🟢 Buy Scenario (priority in line with the main trend):
Entry: 3,852 – 3,854
SL: 3,847
TP: 3,865 → 3,878 → 3,890
👉 Trend-following trade, suitable for holding positions and maximising profits.
🔴 Sell Scenario (scalping at the upper boundary):
Entry: 3,877 – 3,879
SL: 3,884
TP: 3,865 → 3,850 → 3,838
👉 Short-term sell order, only for wave-trading within the pattern boundary.
📊 General Outlook
Gold continues to be supported by the major upward trend, but the H1 range suggests there might be some tug-of-war within the Wolfe Wave.
Buying positions remain a priority for the day, as they align with the trend and allow for more effective order management.
Traders need to closely monitor price action at the upper and lower boundaries to make flexible decisions.
💡 News Factors to Note
In the next hour, the market will focus on political news from the US, especially the potential US Government shutdown. This could be a catalyst causing more significant gold volatility during the session.
📌 Conclusion: Day trading prioritises Buying at support zones – Selling scalps at the upper boundary within the H1 Wolfe Wave pattern. Tight capital management and clear SL to mitigate risks. I will continue to update new scenarios for you – stay tuned to not miss out 🚀.

US Government Shutdown, Gold Benefits & FOMO BUY Continues📊 Market Context The gold market kicks off Q4/2025 with great enthusiasm as safe-haven flows continue to surge.
Not only that, the potential delay of the NFP employment report this week further fuels the market's "thirst" for directional information, positioning gold as the central asset in everyone's sights. Meanwhile, the USD is under pressure from political uncertainties and expectations that the Fed is moving closer to further rate cuts.
Combined, the current picture shows that gold is not only maintaining its strength after a breakout rally but also has the opportunity to expand and conquer new high price territories, as safe-haven capital and FOMO momentum from the BUY side continue to amplify.
🔎 Technical Analysis (H1/H4)
The price maintains the main upward trend, staying above the support structure.
Important BUY ZONE: 3833–3831 (Fibo + CP zone) – this area is likely to react strongly.
Secondary BUY ZONE: 3817–3815 (OBS zone) – stronger support, suitable for accumulating additional BUY orders.
Resistance area 3919–3923 (Liquidity Sell Zone) may be where liquidity traps appear.
✅ BUY ZONE 1: 3833–3831
SL: 3827
TP: 3838 - 3842 - 3846 - 3850 - 3855 - 3860 - 3870 - ???
✅ BUY ZONE 2: 3817–3815
SL: 3810
TP: 3822 - 3826 - 3830 - 3835 - 3840 - 3850 - 3860 - 3870 - ???
✅ Summary Gold is directly benefiting from political instability and the delay in US economic data. The main trend remains BUY with safe-haven flows, with strategic zones at 3833–3831 and 3817–3815. The expansion target aims for 3870–3880 and beyond to 3920+ if buying momentum remains strong.

Gold 1H – Correction or Continuation After Supply Test?Gold on the 1H timeframe is trading near 3,861 after consolidating below a premium supply zone at 3876–3874. Structure shows a recent BOS to the upside, but current rejection signals potential engineered liquidity sweeps into the nearby FVG and discount demand zones. The first support rests at 3796–3798, aligning with discount territory and previous accumulation, offering scope for continuation if price reacts positively.
From the macro side, today’s headlines point to persistent U.S. dollar strength as traders await fresh Federal Reserve guidance on inflation and rate path. Meanwhile, heightened geopolitical concerns in energy markets are maintaining safe-haven flows, adding volatility to gold’s intraday swings.
This dual backdrop sets up a tactical approach: fading rejections at supply while being prepared to enter on discounted dips at demand.
________________________________________
📌 Key Structure & Liquidity Zones (1H):
• 🔴 SELL GOLD 3876–3874 (SL 3883): Premium supply zone, downside targets at 3850 → 3835 → 3815.
• 🟢 BUY ZONE SUPPORT 3796–3798 (SL 3790): Discount demand zone aligned with BOS, upside targets at 3820 → 3845 → 3860+.
________________________________________
📊 Trading Ideas (Scenario-Based):
🔻 Sell Setup – Supply Rejection (3876–3874)
• Entry: 3876–3874
• Stop Loss: 3883
• Take Profits:
TP1: 3850
TP2: 3835
TP3: 3815
🔺 Buy Setup – Demand Mitigation (3796–3798)
• Entry: 3796–3798
• Stop Loss: 3790
• Take Profits:
TP1: 3820
TP2: 3845
TP3: 3860+
________________________________________
🔑 Strategy Note
Gold remains in a corrective phase after testing supply. Expect liquidity sweeps into discount levels before continuation. With the dollar strengthening and Fed commentary in focus, intraday traders should:
• Fade supply rejections at 3876–3874.
• Scale into buys around 3796–3798 if liquidity is cleared.

XAUUSD Daily Plan – Gold’s Pullback Before the Next Leg Higher📊 Market Overview
Gold has pulled back from its fresh record highs but the move looks more like healthy accumulation than a reversal. The 3,800 zone has acted as a strong support, absorbing selling pressure and keeping the broader bullish trend intact. Immediate rebounds confirm that buyers are still in control, preparing for the next breakout.
📍 Key Levels to Watch
🔴 SELL Reaction Zone
3,871 – 3,872 → First resistance level, possible short-term rejection.
3,915 – 3,920 (Fibo Liquidity Zone) → Stronger sell wall where profit-taking may appear.
🟢 BUY Zones
3,808 – 3,810 (Fibo 0.786 Support) → Important reaction zone for intraday buy setups.
3,747 – 3,752 (Fibo Liquidity Buy Zone) → Deep correction level, strong long-term demand area.
🎯 Trading Scenarios
1️⃣ Bullish Continuation Setup
Entry: Buy near 3,808 – 3,810 on bullish candlestick confirmation.
Targets: 3,871 → 3,900+
Stop: Below 3,795
2️⃣ Deep Pullback Opportunity
Entry: 3,747 – 3,752 if price flushes lower.
Targets: 3,808 → 3,871
Stop: Below 3,735
3️⃣ Countertrend SELL Setup
Entry: 3,915 – 3,920 only with strong rejection.
Targets: 3,871 → 3,808
Stop: Above 3,928
⚡ Trading Notes
Gold remains in a strong bullish channel – selling should only be tactical and short-term.
Watch US political headlines and end-of-month flows, as they could trigger volatility.
Stick to defined Fibo zones for best risk-to-reward setups.
💬 Community Discussion
Do you think Gold will test 3,900+ this week or will we see a deeper correction first? Share your charts and ideas below 👇

GOLD ATH: US Shutdown Drama! Buy The Dip, Yaar? Gold just smashed a new record at $3,833.37/oz (Sept 29) on high safe-haven demand due to the impending US Govt shutdown (Oct 1) and solid FED rate cut hopes. USD pullback (0.2%) also playing its part.
The sudden dip to $3,794 looks like pure end-of-month profit-booking, not a proper reversal. If US tensions worsen, the Buy opportunity is still very much active!
📈 Technical View & Intraday Trade Setup
Gold has done a major flush, stopping out the weak hands. Selling pressure is there, but the drop without big news suggests caution. Look for a technical bounce to fill the FVG before a potential continuation lower.
Key Levels:
Resistance: $3827 / $3846 / $3870
Support: $3787 / $3778 / $3763
Detailed Trading Strategy (US Session):
1. BUY Zone (Aggressive Dip Buy):
Entry: $3784 - $3782
SL: $3774
TP: $3792 / $3812 / $3832
2. SELL Scalp (Quick Short):
Entry: $3827 - $3829
SL: $3833
TP: $3824 / $3814 / $3804
3. SELL Zone (Main Short Entry):
Entry: $3866 - $3868
SL: $3876
TP: $3858 / $3838 / $3818
⚠️ Alert! The US Government Shutdown news is the main event. If budget talks are positive, Gold might see a sharp fall. Manage risk (SL) like a boss!
Kya lagta hai? Will Gold fly to $4K or take support near $378x? 👇
#XAUUSD #Gold #MCX #TradingStrategy #USShutdown #FED #TechnicalAnalysis #Intraday #MarketUpdate #Commodities

Elliott Wave Analysis XAUUSD – 01/10/2025📊
________________________________________
🔹 Momentum
• D1:
Momentum is still rising but already entering the overbought zone → buying power is weakening. Price may continue to rise or move sideways in the short term, but the risk of reversal is increasing.
• H4:
Momentum is still pushing upward. Until it reaches the overbought zone and reverses, price can continue to rise or consolidate sideways.
• H1:
Momentum is moving into oversold territory and preparing to turn upward. This aligns with H4, suggesting another short-term push higher.
________________________________________
🔹 Wave Structure
• D1 Wave:
Price is still within Wave 5. Yesterday it reached the second target zone – a strong resistance area and potential top.
Once D1 momentum reverses in overbought territory, a major correction will be confirmed.
Note: If a correction occurs on D1, it will likely last longer than Wave 2 and Wave 4 → avoid catching swing bottoms too early.
• H4 Wave:
A strong drop yesterday gave sellers momentum, but price quickly recovered and is now testing highs.
With both D1 and H4 momentum showing more room to rise, price may still push higher.
→ Use the H4 price channel as a key observation tool.
• H1 Wave:
A 5-wave structure (12345 black) is forming. Wave 5 is usually the hardest to predict due to FOMO-driven buying.
As warned yesterday, long swing trades are risky. After a sharp drop, price rebounded but momentum signals weakness.
Multiple Wave 5 structures are converging near 3885, making this a high-probability reversal zone.
________________________________________
🔹 Trade Plan
• Sell Zone: 3885 – 3887
• Stop Loss: 3895
• Take Profit:
o TP1: 3830
📌 Notes:
• This is a sensitive potential top zone → volatility is usually unpredictable.
• If selling at 3885, use small position size and strict SL discipline.
• Best approach: wait for further confirmation before committing heavily.

Gold Sets Record Close, Will Bulls Push Toward 3900 Next?Gold printed another all time high yesterday and closed with the strongest daily, monthly, and quarterly close on record. As expected with month-end and EOQ flows, we saw a phase of profit booking, but price quickly found support around the psychological 3800 level and Weekly R1 (3806), which is holding as a key demand zone for now. The overall structure remains bullish, and today gold is attempting to break above the previous day high / previous month high. A confirmed H4 close above this level would likely fuel continuation toward the next psychological milestone at 3900. On the downside, a breakdown below 3800 could open room for a corrective move into lower supports. For the near term, the market is trading within a range of 3810–3865/70, and a decisive breakout from this band will likely define the next directional leg.

XAUUSD / GOLD / GC Analysis 01-OCT-2025LTP 3863
Supports: 3355/3110/2721/1921
As long as Gold supported by the above levels, we can see 3991-4385 next.
Bigger picture targets: 3748(done)-3991-4385 (Min target)
Further targets:
4934
5420-5655-6036 (Normal target)
7082-7334-8116 (ultimate target)
Extension 11225.
NOTE: I expect big correction between 3748-3991-4385 levels to 3355-3110-2721 before next bull run towards 5K+.
BUY ON DIPS VIEW
