Gold (XAUUSD) Short ViewPrice faced rejection near the recent high and broke down from the consolidation zone, indicating potential bearish momentum. If the price sustains below 3778, we can expect a further decline toward 3767.
Futures market

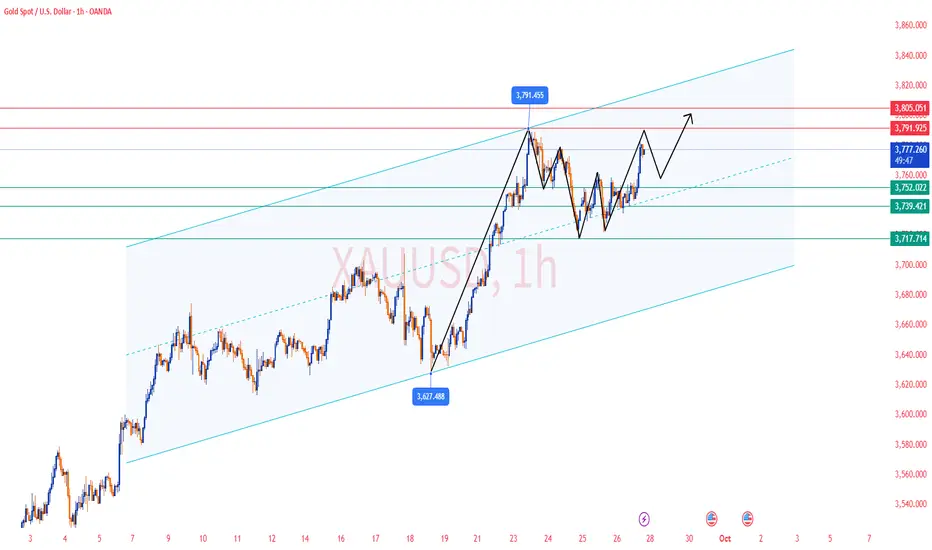
Gold Trading Strategy for Friday Late-Session✅ From the 4-hour chart, gold pulled back after hitting the 3791 high, dropping to the 3717 level, and then consolidating in the 3744–3755 range. The current candlestick has moved back above the MA5 and MA10 and is approaching the upper Bollinger Band, indicating that short-term bullish momentum is regaining strength.
The moving averages are turning upward in the short term, suggesting potential for further upside momentum. The Bollinger Bands are opening upward, with price near the upper band, showing the risk of a short-term rally but also the possibility of a pullback.
At present, gold is in a high-level consolidation phase, with a short-term bullish bias. However, dense resistance above makes a pullback likely after any rally.
✅ From the 1-hour chart, gold rebounded sharply after testing the 3722 level, reaching as high as 3783, and is currently consolidating near 3775. Consecutive bullish candles indicate strong short-term momentum.
The moving averages (MA5 and MA10) have formed a bullish alignment, showing a short-term uptrend. However, with the candlesticks approaching the upper Bollinger Band, a technical pullback may occur. The short-term trend remains bullish, and if price can hold above 3766, it may continue to test the 3783–3791 range, though there is still a risk of a rally followed by a pullback.
🔴 Resistance Levels: 3783 / 3791 / 3805
🟢 Support Levels: 3766 / 3752 / 3742
✅ Trading Strategy Reference:
🔰If gold pulls back to the 3766–3755 support zone and holds, consider entering long positions in batches, targeting 3783–3791.
🔰If gold rallies to 3783–3791 but faces resistance, consider light short positions, targeting 3766–3755.
🔥Trading Reminder: Trading strategies are time-sensitive, and market conditions can change rapidly. Please adjust your trading plan based on real-time market conditions. If you have any questions , feel free to contact me🤝
XAUUSDALWAYS TAKE TRADE WITH CONFIRMATION
Note : Trading in any financial market is very risky. I post ideas for educational purpose only. It is not financial advice. Do not hold us responsible for any potential loss you may incur. Please consult your financial adviser before trading.

Traders Watch Gold Surge Ahead of Fed’s Next MoveGold 1H – Consolidation Before Fed Clarity
Gold on the 1H timeframe is currently trading around 3,746, moving within a well-defined consolidation range. Price action highlights a premium supply zone at 3,775–3,773 and a discount demand zone at 3,723–3,725. The market structure shows earlier signs of BOS and ChoCH, with engineered liquidity sweeps becoming evident. A potential Mitigation → Expansion sequence is in play, where a liquidity grab near discount demand could fuel a bullish leg toward premium supply.
From a macro perspective, today’s headlines underscore the cautious stance across financial markets as investors await the Federal Reserve’s upcoming guidance. Lingering inflationary concerns, coupled with speculation around the timing of future rate cuts, have kept volatility elevated. Meanwhile, geopolitical risks continue to underpin safe-haven demand for gold, adding an extra layer of support at discount levels.
This combination of technical liquidity zones and macro uncertainty sets the stage for tactical plays: fading moves into the supply zone while remaining prepared for dip-buying opportunities at defined demand areas.
________________________________________
📌 Key Structure & Liquidity Zones (1H):
• 🔴 SELL GOLD 3,775–3,773 (SL 3,782): Supply zone coinciding with a buy-side liquidity pool above 3,780, offering downside targets at 3,760 → 3,745 → 3,730.
• 🟢 BUY GOLD 3,723–3,725 (SL 3,718): Discount demand aligned with liquidity grab potential, with upside targets at 3,745 → 3,760 → 3,775+.
________________________________________
📊 Trading Ideas (Scenario-Based):
🔻 Sell Setup – Supply Rejection (3,775–3,773)
• Entry: 3,775–3,773
• Stop Loss: 3,782
• Take Profits:
TP1: 3,760
TP2: 3,745
TP3: 3,730
🔺 Buy Setup – Demand Mitigation (3,723–3,725)
• Entry: 3,723–3,725
• Stop Loss: 3,718
• Take Profits:
TP1: 3,745
TP2: 3,760
TP3: 3,775+
________________________________________
🔑 Strategy Note
With the Fed’s next move looming, traders should anticipate engineered sweeps into both premium and discount liquidity pools before the market establishes clearer direction. The tactical edge comes from aligning intraday setups with liquidity hunts:
• Fade supply at 3,775–3,773 if rejection confirms.
• Buy dips into 3,723–3,725 if liquidity is swept cleanly.
The broader narrative of inflation concerns, dollar sensitivity, and safe-haven flows reinforces the case for two-sided opportunities. Expect gold to remain volatile within this consolidation range, with sharp moves likely as liquidity is targeted ahead of Fed clarity.

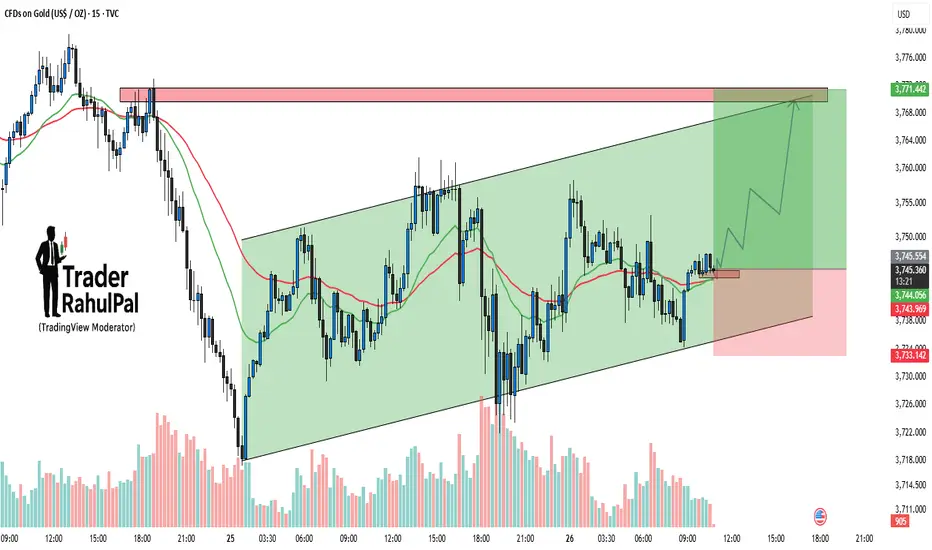
Gold – Channel Support Holding, Upside Target Towards 3770Gold is trading within a well-defined ascending channel on the 15-min chart. Price action has repeatedly respected both support and resistance lines, which makes this pattern highly reliable in the short term. Currently, the price is bouncing from the lower channel support and holding firmly above the 3740–3743 zone. As long as this support area is protected, the bullish momentum remains intact and the next upside target comes in around 3770, aligning with the channel resistance. A breakout above 3770 could trigger an even stronger rally, while a failure to hold below 3733 would invalidate the setup and shift the bias to the downside.
Disclaimer: This analysis is for educational purposes only and should not be taken as financial advice. Please do your own research or consult your financial advisor before investing.
Analysis By @TraderRahulPal (TradingView Moderator) | More analysis & educational content on my profile
👉 If you found this helpful, don’t forget to like and follow for regular updates.
XAUUSD SHOWING A GOOD UP MOVE WITH 1:10 RISK REWARD GOLD SHOWING A GOOD UP MOVE WITH 1:10 RISK REWARD
DUE TO THESE REASON
A. its following a rectangle pattern that stocked the market
which preventing the market to move any one direction now it trying to break the strong resistant lable
B. after the break of this rectangle it will boost the market potential for break
C. also its resisting from a strong neckline the neckline also got weeker ald the price is ready to break in the outer region
all of these reason are indicating the same thing its ready for breakout BREAKOUT trading are follws good risk reward
please dont use more than one percentage of your capitalfollow risk reward and tradeing rules
that will help you to to become a bettertrader
thank you

Gold ShortGold appears to be facing selling pressure as it is encountering strong resistance around the 113,200 level.
On the downside, there is a possibility of it moving lower towards the 111,700–111,100 range over the next 1–2 days.

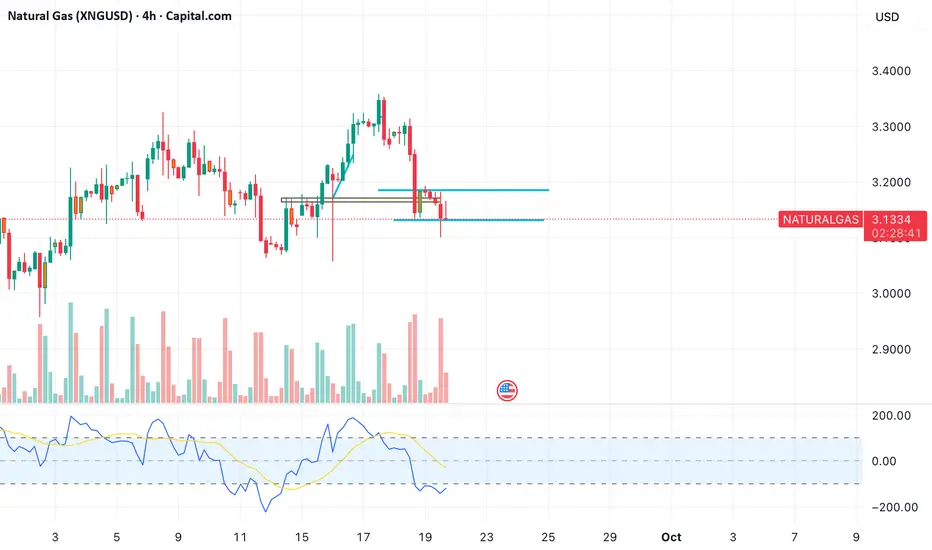
Gas fuelling in for an expiry rally!
Observations:
• Price broke down below the horizontal support zone (~$3.12–$3.13), but the candles show strong rejection wicks which indicats sign of bear trap.
• Bears tried to push below support, but volume did not confirm sustained selling.
• RSI (bottom panel) is in a deeply oversold region and attempting to curl back up with a momentum shift possible.
• Previous swing lows around $3.10–$3.12 held, confirming demand.
Buy:
• Entry Zone (Buy): $3.12 – $3.15 (current levels)
• Stop Loss: Below $3.05 (decisive breakdown level)
• Targets:
• T1: $3.22
• T2: $3.28
• T3: $3.34–$3.38 (major resistance supply zone)
Logic:
• The false breakdown below $3.12 triggered short positions (bears trapped).
• If price sustains above $3.12–$3.15, trapped shorts may cover, fueling an upside bounce.
• Risk–reward here is favorable since SL is tight (~10 cents risk for 20–25+ cents potential gain).
Part 4 Learn Institutional Trading 1. Introduction to Options and Their Importance
Financial markets have evolved to provide investors with a wide variety of tools to grow wealth, manage risk, and enhance returns. Among these tools, options stand out as one of the most versatile and powerful instruments.
Options belong to the family of derivatives, meaning their value is derived from an underlying asset such as a stock, index, commodity, or currency. Unlike direct ownership (buying a stock outright), options give the investor rights but not obligations, providing flexibility in trading.
Their importance lies in:
Allowing traders to profit in both rising and falling markets.
Offering leverage (control larger positions with smaller capital).
Serving as a hedging instrument to reduce portfolio risks.
Providing a platform for sophisticated strategies that balance risk and reward.
In today’s markets — whether on Wall Street, the NSE, or other global exchanges — option trading has grown from being a niche practice for institutional investors to a mainstream financial strategy accessible to retail traders as well.
2. Basic Concepts: Calls, Puts, and Premiums
At the core of option trading are call options and put options.
Call Option: A financial contract that gives the buyer the right (not obligation) to buy the underlying asset at a predetermined price (strike price) within a specific time frame.
Example: Buying a Reliance call at ₹2,400 strike allows you to buy Reliance shares at ₹2,400 even if the market price rises to ₹2,600.
Put Option: A contract that gives the buyer the right to sell the underlying asset at a fixed strike price within a specific time frame.
Example: Buying a Nifty put at 20,000 strike allows you to sell at 20,000 even if Nifty drops to 19,500.
Premium: The price paid by the option buyer to the seller (writer) for obtaining this right. Premiums are determined by factors like volatility, time to expiry, and demand-supply.
Strike Price: The fixed level at which the buyer can exercise the right.
Expiration Date: Options are time-bound contracts. At expiry, they either get exercised (if in the money) or expire worthless.
These basic concepts form the foundation of all option strategies and trading approaches.

Bearish on gold As previous gold has been rallied for more then week and we see bearishness in daily and weekly time frame and I expect gold to retrace and continue going higher

Jobs vs. Inflation: Gold Steady Before PCE ShowdownHello, investors!
Gold saw only a marginal 0.1% gain, closing at $3,739.42/oz on September 25. This struggle was due to better-than-expected US jobs data (jobless claims dropped sharply), which slightly pared back the market's expectation for a Fed rate cut in October (down to 85%).
However, Gold maintains support from dovish Fed comments and potential political instability (like Trump's proposed 100% drug tariff). The entire market focus now shifts to today's (Sept 26) PCE Inflation Report.
Expert Alert: If the PCE data is hotter than anticipated, Gold could face sharp, temporary downward pressure.
Technical Analysis & Strategy
Gold is currently consolidating within a triangle pattern and has yet to break the $375x resistance. While more selling pressure is possible before the PCE release, the long-term trend remains bullish.
Outlook: Prioritize Buy if the price maintains above the Key Level $373x. If the news causes the price to break $373x, be ready to flip the strategy to Sell.
Key Resistance: $3755, $3768, $3778
Key Support: $3738, $3727, $3712
Suggested Trading Strategy (Strict Risk Management):
BUY SCALP
Zone: $3739 - $3737
SL: $3733
TP: $3742 - $3747 - $3752 - $3757 - $3767
BUY ZONE
Zone: $3704 - $3702
SL: $3694
TP: $3712 - $3722 - $3732 - $3742 - $3762
SELL ZONE
Zone: $3776 - $3778
SL: $3786
TP: $3768 - $3758 - $3748 - $3728 - $3708
The market is at a critical juncture. What is your game plan for today? 👇
#Gold #XAUUSD #PCE #Fed #Inflation #TradingView #ATH

Part 3 Learn Institutional Trading 1. Definition
Options are financial derivatives that give the buyer the right, but not the obligation, to buy or sell an underlying asset at a specified price within a specified time.
2. Types of Options
Call Option – Right to buy the underlying asset.
Put Option – Right to sell the underlying asset.
3. Option Premium
The price paid by the buyer to the seller (writer) for acquiring the option.
4. Strike Price
The predetermined price at which the underlying asset can be bought or sold.
5. Expiry Date
The date on which the option ceases to exist and becomes worthless if not exercised.
6. In-the-Money (ITM)
Call: Market price > Strike price
Put: Market price < Strike price
7. Out-of-the-Money (OTM)
Call: Market price < Strike price
Put: Market price > Strike price
8. At-the-Money (ATM)
Market price ≈ Strike price; option has no intrinsic value, only time value.
9. Intrinsic Value
Difference between the underlying asset’s current price and the strike price (if favorable).
10. Time Value
The portion of the option premium that reflects the time remaining until expiry.
11. Option Writers
Sellers of options who receive the premium and are obligated to fulfill the contract if exercised.
12. American vs European Options
American: Can be exercised anytime before expiry.
European: Can only be exercised on expiry date.
13. Hedging
Options are used to protect against price movements in the underlying asset.
14. Speculation
Traders use options to bet on price movements with limited capital and defined risk.
15. Leverage
Options allow traders to control a large position with small capital, amplifying both gains and losses.
16. Volatility Impact
Higher volatility generally increases option premiums, as the likelihood of profitable moves rises.
17. Greeks
Metrics that measure option risk:
Delta – Sensitivity to underlying price changes
Gamma – Rate of change of Delta
Theta – Time decay
Vega – Sensitivity to volatility
Rho – Sensitivity to interest rates
18. Strategies
Common strategies include:
Covered Call
Protective Put
Straddle & Strangle
Butterfly & Iron Condor
19. Risk
Buyers: Limited risk (premium paid)
Sellers: Potentially unlimited risk if naked (unhedged)
20. Market Participants
Retail traders
Institutional investors
Hedgers, speculators, and arbitrageurs

Gold Trade Plan - Nov ExpirtyMCX:GOLDM1! Might give entry once again. Booked more than 10R in last trade. Let's see how it goes.

Wave 5 is about to start – today just time your Buy right!📊 Wave Perspective
The market is still following the scenario of one more wave 5 increase.
It is expected that on Friday morning, the price may move around 3765 to confirm the continuation trend.
After confirmation, there will be 2 important zones to time your Buy for the big wave.
✅ Trading Plan
Zone 1: High Entry – Main Priority
Entry: 3749 – 3751
SL: 3746
TP: 3792
This is the first buying point, suitable for those who want to enter the wave early following the trend.
Zone 2: Backup Entry – Last Support
Entry: 3738 – 3736
Maximum SL: 3730
TP: 3792
This is a strong support zone, if the price breaks zone 1, this will be the "timing" zone to re-enter.
Note: Since this is a backup entry, reduce Lot size, widen SL a bit, and tighten SL when the price matches to optimize risk.
📌 Capital Management Note
Every order must comply with SL to avoid risks.
Prioritize entering orders according to the big wave plan, avoid FOMO.
EA setup: should be set to Only Buy according to the upward wave perspective.
Analysis perspective is for reference only, combine with personal view before entering orders.
🎯 Expectation
If the scenario is correct, the price may complete wave 5 at target 3792.
Upon reaching TP, partial take profit can be done to secure profits.

XAUUSD – FIBO MATRIX Trading Plan | Key Levels for TodayMarket Snapshot
Gold is attracting steady buying interest as dovish Fed expectations keep the USD capped near 3-week highs.
At the same time, geopolitical tensions and tariff concerns add to safe-haven demand.
Focus now shifts to US PCE inflation data, which could trigger the next big move.
📍 Important Price Zones (M30)
🔴 SELL Reaction Zones
3767 – 377x → Major rejection area (Fibo 0.786).
3810 – 3817 → Strong SELL zone (Fibo 1.5 – 1.618).
🟢 BUY Support Zones
3725 → First support zone.
3690 – 3695 → Deep pullback support (Fibo confluence).
🎯 Trading Ideas
1️⃣ SELL Setup
Entry: 3767 – 377x (if rejection signal shows).
Targets: 3750 → 3725.
SL: Above 3778.
2️⃣ BUY Setup
Entry: 3725 with bullish confirmation.
Targets: 3760 → 377x.
SL: Below 3715.
3️⃣ Deep BUY Opportunity
Entry: 3690 – 3695 zone.
Targets: 3725 → 3760.
SL: Below 3685.
⚡ Trading Insights
Respect the Fibo reaction levels for clean entries.
Risk range: 6–8 USD to avoid stop hunts.
Book profits in steps: 1R → 2R → 3R for strong RR balance.
💬 Community Talk
Do you see gold breaking above 3770 first, or dropping to 3725/3695 before bouncing back? Share your chart view 👇

XAUUSD – Range 3735–3755 now serves as trend confirmation zoneXAUUSD – Range 3735–3755 now serves as trend confirmation zone
Technical Analysis
Gold (XAUUSD) is moving within a narrow range of 3735–3755, and this price zone currently acts as a “pivot point” to confirm the next direction.
Short-term resistance: 3755–3772, price has reacted strongly multiple times. If not decisively broken, selling pressure may continue.
Key support: 3735, this is the decisive zone – breaking it will confirm a downward trend, targeting lower levels.
Stronger resistance: 3790–3793, confluence of several previous peaks, where strong selling pressure may form.
EMA200 H1 (3723) still supports the major uptrend, but the price has moved far and is now in the phase of retesting supply – demand zones.
RSI (14) around 45–48, not yet in oversold territory but leaning towards the sellers.
From a technical perspective, this is a market phase that requires confirmation: breaking above 3755 will reopen the upward momentum, while losing 3735 will reinforce short-term downward pressure.
Trading Scenarios
Sell Scenario (preferred if resistance holds):
Sell 3769–3772, SL 3775, TP: 3755 – 3746 – 3737
Sell 3791–3793, SL 3798, TP: 3783 – 3772 – 3760 – 3745
Sell when price confirms below 3735, SL 3742, TP: 3726 – 3715 – 3702 – 3690
Buy Scenario (trend-following on breakout):
Buy when price confirms above 3755, SL 3747, TP: 3766 – 3778 – 3790
Buy 3705–3702, SL 3697, TP: 3717 – 3726 – 3744 – 3763 – 3780 – 3790
Price Zones to Watch
3735–3755: trend confirmation range, most important in the short term.
3769–3772 and 3791–3793: strong resistance zones, potential Sell zone.
3702–3705: deep Buy zone, combined with strong support and EMA200.
3790: key resistance level, breaking it will reinforce the major uptrend.
Outlook
The gold market is in a decisive phase at the 3735–3755 range. Sellers have a short-term advantage, but if the price exceeds 3755, the uptrend may soon return. The best strategy is to trade based on price confirmation at key zones, combining profit-taking at each successive TP level to optimise gains.
This is a reference scenario based on technical analysis, not an investment recommendation. Stay tuned for earlier analyses in upcoming sessions.

Elliott Wave Analysis XAUUSD – September 26, 2025
________________________________________
🔹 Momentum
• D1: Currently decreasing → the corrective trend is likely to continue. It may take about 2 more D1 candles for momentum to enter the oversold zone, after which a reversal could occur.
• H4: Momentum is rising → today we may see a bullish move or sideways range.
• H1: About to enter the oversold zone → a short-term bullish reversal is likely.
________________________________________
🔹 Wave Structure
• D1:
o As analyzed previously, wave 5 (yellow) has already reached its first target at 3789.
o It may take around 2 more D1 candles for momentum to enter oversold → showing that the bearish leg is weakening.
o Considering depth and time, the market is likely within wave 4 of wave 5. Once the correction completes, the uptrend should resume toward the second target.
• H4:
o A WXY corrective structure is developing.
o The ABC (blue) has completed wave W → the market may now be in wave X, followed by a Y-wave decline to finish the correction.
• H1:
o Wave X appears to be forming a triangle, currently in the final wave e.
o However:
If price rises sharply above 3762, it would suggest the corrective phase is already completed.
The target area for wave e is around 3752 → potential Sell zone.
If price breaks below 3729, it confirms wave Y is in play, targeting 3713 and 3698 → potential Buy zones.
⚠️ Note: If the Buy target is reached first, the Sell setup will be canceled.
________________________________________
🔹 Trading Plan
🔻 Sell Zone
• Entry: 3751 – 3753
• SL: 3761
• TP: 3729
________________________________________
🔺 Buy Zone 1
• Entry: 3714 – 3712
• SL: 3704
• TP: 3751
________________________________________
🔺 Buy Zone 2
• Entry: 3699 – 3696
• SL: 3686
• TP: 3751

Public vs Private Banks in Trading1. Introduction
Banking institutions play a crucial role in the financial ecosystem, acting as intermediaries between savers and borrowers, facilitating economic growth, and influencing market stability. Within India, banks are broadly classified into public sector banks and private sector banks, both of which participate in trading activities but with different operational strategies, risk appetites, and market impacts.
Trading by banks refers to activities such as:
Equity trading: Buying and selling shares of companies.
Debt trading: Involving government bonds, corporate bonds, and other fixed-income instruments.
Derivatives trading: Futures, options, swaps for hedging or speculative purposes.
Forex trading: Buying and selling foreign currencies.
Commodity trading: Participation in commodity markets, often indirectly.
The distinction between public and private banks in these trading activities affects liquidity, market volatility, investor confidence, and overall financial stability.
2. Overview of Public and Private Banks
2.1 Public Sector Banks (PSBs)
Public sector banks are banks in which the government holds a majority stake (usually over 50%), giving it significant control over operations and policies. Examples in India include:
State Bank of India (SBI)
Punjab National Bank (PNB)
Bank of Baroda (BoB)
Characteristics:
Government ownership provides implicit trust and perceived safety.
Mandated to serve social and economic objectives, sometimes at the cost of profitability.
Larger branch networks, especially in semi-urban and rural areas.
Regulatory oversight tends to be stricter, focusing on stability rather than aggressive profits.
2.2 Private Sector Banks
Private banks are owned by private entities or shareholders with the primary objective of profit maximization. Examples include:
HDFC Bank
ICICI Bank
Axis Bank
Characteristics:
More technologically advanced and customer-centric.
Flexible, agile, and willing to explore new trading strategies.
High focus on efficiency, profitability, and risk-adjusted returns.
Typically have fewer rural branches but dominate urban and digital banking.
3. Role of Banks in Trading
Banks are central players in the financial markets. Their trading activities can be categorized as:
3.1 Proprietary Trading
Banks trade with their own capital to earn profits. Private banks often engage more aggressively due to higher risk appetite.
3.2 Client Trading
Banks execute trades on behalf of clients, such as corporates, mutual funds, or high-net-worth individuals. Both public and private banks participate, but private banks may offer more advanced advisory and trading platforms.
3.3 Hedging and Risk Management
Banks use derivatives and other instruments to hedge risks associated with:
Currency fluctuations
Interest rate changes
Commodity price movements
Public banks often hedge conservatively due to regulatory oversight, whereas private banks may engage in complex derivative strategies.
4. Trading in Different Market Segments
4.1 Equity Markets
Public Banks: Typically invest in blue-chip companies and government initiatives; tend to hold stable equity portfolios.
Private Banks: Active in IPOs, mutual funds, and portfolio management; may leverage proprietary trading desks for short-term gains.
4.2 Debt Markets
Public Banks: Major participants in government bonds, treasury bills, and large-scale debt issuance.
Private Banks: Active in corporate bonds, debentures, and structured debt instruments.
4.3 Forex Markets
Public Banks: Facilitate trade-related foreign exchange, hedging imports/exports; conservative trading.
Private Banks: Aggressive forex trading, currency swaps, and derivatives to maximize profits.
4.4 Commodity Markets
Public Banks: Minimal direct participation; may finance commodity traders.
Private Banks: May engage in commodity-linked derivatives for proprietary or client trading.
4.5 Derivatives Markets
Public Banks: Hedging-driven; lower exposure to high-risk derivatives.
Private Banks: Speculation and hedging; higher use of futures, options, and structured products.
5. Comparative Performance Analysis
5.1 Profitability
Private banks typically have higher net interest margins and return on equity.
Public banks focus on financial inclusion and stability; profits are secondary.
5.2 Risk Management
Public banks prioritize capital preservation; may carry higher non-performing assets (NPAs).
Private banks employ advanced risk modeling; NPAs are lower, but exposure to market risks is higher.
5.3 Market Impact
Public banks stabilize markets during crises due to government backing.
Private banks drive market innovation through new trading products and digital platforms.
6. Regulation and Compliance
Both public and private banks in India are regulated by the Reserve Bank of India (RBI).
Public Banks: Must follow government mandates on priority sector lending, capital adequacy, and lending limits.
Private Banks: While regulated, they enjoy more freedom in investment strategies, provided they adhere to Basel III norms and RBI guidelines.
7. Technological and Digital Edge
Public Banks
Historically slower in adopting technology.
Initiatives like Core Banking Solutions (CBS) have modernized operations.
Digital trading platforms are limited.
Private Banks
Early adopters of digital trading platforms, mobile banking, and AI-based trading analytics.
Focus on client-driven solutions like portfolio optimization, robo-advisory, and high-frequency trading.
8. Case Studies
8.1 State Bank of India (SBI)
Large-scale government bond trading.
Stable equity portfolio; focus on corporate and retail clients.
Conservative derivatives trading.
8.2 HDFC Bank
Active in equity derivatives and forex trading.
Aggressive risk-adjusted proprietary trading strategies.
Strong digital platforms for client trading.
9. Challenges and Opportunities
Public Banks
Challenges:
High NPAs, bureaucratic hurdles, and slower adoption of technology.
Limited risk-taking capacity restricts trading profits.
Opportunities:
Government support can stabilize during crises.
Potential for technology partnerships to modernize trading platforms.
Private Banks
Challenges:
Vulnerable to market volatility and regulatory scrutiny.
Aggressive trading strategies can backfire during crises.
Opportunities:
High profit potential through innovative trading and fintech integration.
Can attract high-net-worth clients and institutional investors.
10. Impact on Financial Markets
Public Banks: Act as stabilizers; provide liquidity during market stress.
Private Banks: Drive market efficiency and innovation; increase competition.
Combined Effect: Both types ensure a balanced ecosystem where stability and growth coexist.
11. Future Trends in Banking and Trading
Integration of AI and Machine Learning:
Private banks leading in algorithmic trading and predictive analytics.
Public banks adopting AI for risk management and operational efficiency.
Blockchain and Digital Assets:
Both sectors exploring blockchain for secure and transparent trading.
Cryptocurrency exposure remains limited but monitored.
Sustainable and ESG Investments:
Increasing focus on green bonds, socially responsible funds, and ESG-compliant derivatives.
Global Market Expansion:
Private banks expanding cross-border trading.
Public banks supporting government-backed international trade financing.
12. Conclusion
Public and private banks serve complementary roles in the trading ecosystem:
Public Banks: Conservative, stable, government-backed, stabilizing force in markets.
Private Banks: Agile, profit-oriented, technologically advanced, driving market innovation.
A robust financial system requires both sectors to function effectively. Public banks ensure economic stability, especially in times of crisis, while private banks provide innovation, efficiency, and competitive trading solutions. For investors, understanding these differences is critical when assessing bank stock investments, trading opportunities, or market trends.

XAUUSD – Trading Plan: Gold Awaits PCE Catalyst📊 Market Context
Gold remains in consolidation mode after a sharp run earlier this week, holding steady below 3750. The market is now laser-focused on the US Core PCE Index, which could provide fresh direction for both the dollar and precious metals. With US yields stabilising and risk sentiment shifting, gold’s safe-haven appeal remains intact — but traders are weighing whether the recent pullback is a healthy correction or the start of a deeper retracement.
Meanwhile, the geopolitical backdrop continues to offer underlying support, while positioning in ETFs and futures suggests investors are cautious, awaiting clearer signals from the Fed. The upcoming data will likely decide whether gold breaks higher towards fresh highs or retests deeper liquidity zones.
🔎 Technical Analysis (H1/H4)
Price capped near short-term resistance at 3770–3772.
Immediate supports are 3741 and 3722, with deeper demand zones at 3690–3688 and 3670–3668.
The structure indicates possible liquidity sweeps before a decisive move.
🔑 Key Levels
Resistance / Sell Zone: 3770–3772
Support / Buy Zones: 3690–3688, 3670–3668
📈 Scenarios & Trading Plan
BUY ZONE 1: 3690–3688
SL: 3684
TP: 3695 - 3700 - 3710 - 3720 - 3730 - ???
BUY ZONE 2: 3670–3668
SL: 3664
TP: 3675 - 3680 - 3690 - 3700 - 3710 - ???
SELL ZONE: 3770–3772
SL: 3777
TP: 3765 - 3760 - 3750 - 3740 - ???
⚠️ Risk Notes
Watch for false breakouts at 3770–3772 before reversal.
PCE release may inject volatility across gold and USD pairs.
Position sizing and risk control are crucial into data.
✅ Summary
Gold is at a crossroads — safe-haven demand is still supportive, but technical resistance near 3770 remains a hurdle. Core strategy: buy dips into 3690–3670 zones, while staying cautious of short-term sell setups at 3770–3772. Manage exposure, wait for confirmation, and be prepared for volatility once PCE data hits.
📢 Follow MMFLOW TRADING for real-time updates and next-level trade setups.

Gold outlookYou can see in chart that there is a pattern formation. Gold can give a sell side entry. Wait for it.

LiamTrading – Gold may fake a move before dropping
Gold is trading around the 375x region and might exhibit a "fake breakout" upwards before adjusting downwards. The price structure on the H4 chart shows:
Strong resistance is located at the 3770–3773 region, coinciding with the 0.786 – 1.0 Fibonacci extension area. This is a confluence zone prone to a downward reaction.
The main trendline remains upward, but the RSI is gradually weakening, indicating that the buying force is not as strong.
Short-term support is at 3710–3713, also the 0.5 – 0.618 fibo zone, suitable for buy scalping orders.
A larger support area is at 3688–3691, where it converges with the trendline bottom and important Fibonacci, considered a sustainable "buy zone."
Trading Plan Reference
Sell: 3770 – 3773, SL 3778, TP 3756 – 3743 – 3725 – 3710
Buy scalping: 3710 – 3713, SL 3705, TP 3725 – 3736 – 3748 – 3760
Buy zone: 3688 – 3691, SL 3684, TP 3699 – 3710 – 3725 – 3736 – 3745 – 3760
In summary, gold may create a false upward move to the resistance zone 3770–3773 before reversing to adjust. Traders should patiently wait for confirmation signals at key price zones to enter optimal orders and manage risks tightly.
This is my personal view on XAUUSD. If you find it useful, follow for the fastest updates on upcoming scenarios, continuously updated at comulity

Gold under EMA pressure Buy at support,short scalp at resistance🟡 XAU/USD – Captain Vincent ⚓
🔎 Captain’s Log – Context & News
FED : Probability of a 25bps cut in October is 91.09% → almost certain.
US Calendar today : GDP, Jobless Claims, Durable Goods Orders, and especially speeches from 3 FED officials → strong volatility expected.
Gold yesterday : Dropped deeply but reacted precisely at key support → according to Vincent, this sell-off was mainly due to investors being cautious ahead of tomorrow’s CPI data.
⏩ Captain’s Summary : Short-term waves are pressured by EMAs, but the bigger voyage remains bullish – sailors prioritize Buy at Golden Harbor, only Quick Boarding 🚤 when facing Storm Breaker.
📈 Captain’s Chart – Technical Analysis (H30, EMA 34 & EMA 89)
EMA : EMA 34 (yellow) crossing below EMA 89 (red) → short-term bearish signal.
Trend : Overall still bullish, with Bullish OBs and Buy Zones below acting as strong supports.
Storm Breaker (Resistance / Sell Zone)
3,769 – 3,777 (Bearish OB)
Golden Harbor (Support / Buy Zone)
3,734 – 3,718 (Bullish OB)
3,687 – 3,685 (Buy Zone OB)
3,650 – 3,648 (Deeper Buy Zone, confluence with EMA 89)
🎯 Captain’s Map – Trade Plan
⚡ Sell (short-term scalp)
Entry: 3,776 – 3,773
SL: 3,783
TP: 3,770 – 3,765 – 3,760 – 3,755 – 3,750
✅ Buy (main priority)
Buy Zone 1 (OB)
Entry: 3,687 – 3,685
SL: 3,678
TP: 3,700 – 3,705 – 3,710 – 3,715 – 3,720
Buy Zone 2 (Deeper OB)
Entry: 3,650 – 3,648
SL: 3,638
TP: 3,665 – 3,670 – 3,675 – 3,680 – 3,685
⚓ Captain’s Note
“The Golden sails are facing headwinds from short-term EMAs, but Golden Harbor 🏝️ (3,734 – 3,650) remains a solid support dock. Storm Breaker 🌊 (3,769 – 3,777) is only suitable for short Quick Boarding 🚤 scalps. Tonight, the US sea will bring big waves from data & FED speeches – sailors, tighten your sails and manage trades with discipline.”
📢 If you find Captain’s Log useful, don’t forget to Follow for the latest updates.
💬 Do you have a different view on Gold? Drop a comment and join the crew discussion!

LiamTrading XAUUSD Scenario Today Fibo & Volume Profile AnalysisLiamTrading XAUUSD Scenario Today:Fibo & Volume Profile Analysis
Gold, after testing the 375x zone, has shown clear signs of weakening. On the H1 chart, the price structure is forming an adjustment phase aligning with key Fibonacci and Volume Profile levels. This is the time when the market starts to “filter” liquidity, creating opportunities for both short sell orders and buy orders at strong support zones.
Technical Analysis
Fibonacci indicates the 0.786 – 1.0 zone around 3756–3758 coincides with strong resistance and FVG, with a high potential for a reversal.
Volume Profile points out the POC area around 3735–3740, if breached, it will pave the way for deeper downward pressure.
The confluence support zone of 0.618 fibo + large volume around 3688–3691 is suitable for scalping buy.
Further, the area 3648–3651 is reinforced by VAL and the bottom of the volume profile, making it a strong long-term “Buy zone.”
Trading Plan Reference
Sell zone: 3756 – 3758, SL 3763, TP 3750 – 3748 – 3736 – 3710 – 3690 – 3655
Buy scalping: 3688 – 3691, SL 3685, TP 3701 – 3715 – 3728
Long-term Buy zone: 3648 – 3651, SL 3640, TP 3670 – 3688 – 3700 – 3718 – 3733 – 3755
In summary, gold is moving in accordance with the technical structure confirmed by Fibonacci and Volume Profile. Today's scenario prioritises observing reactions around the sell zone 3756–3758 to find short opportunities, and waiting to buy at value zones 369x and 365x for the recovery wave.
This is my personal view on XAUUSD. If you want the fastest updates on the next gold scenarios, follow me and join the community to stay informed.
