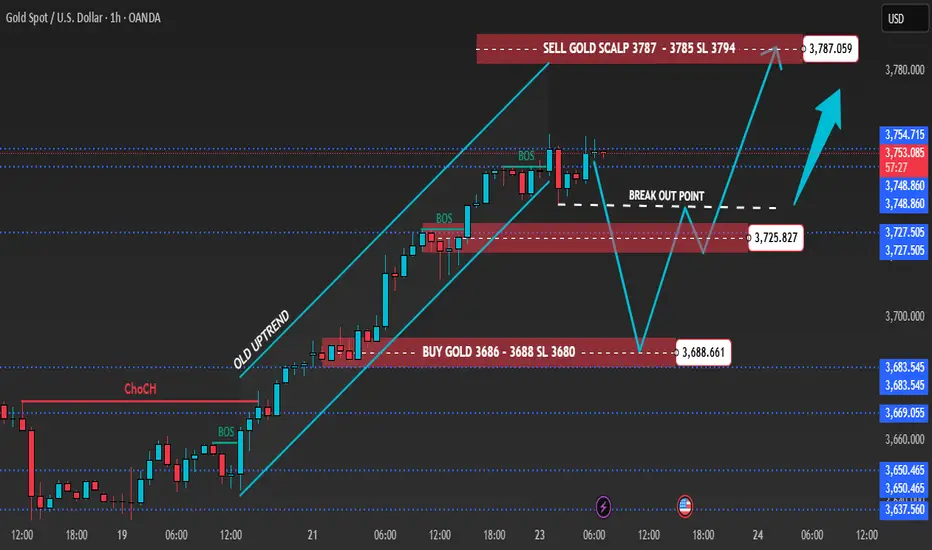
Gold 1H – Inflation Worries & Risk Sentiment Guide MovesGold on the 1H chart is hovering near 3,753 after multiple BOS confirmations, holding a firm bullish bias yet approaching premium resistance. Liquidity sits above 3,787–3,785, while fresh demand zones are placed at 3,725–3,723 and deeper at 3,688–3,686.
Today’s narrative around sticky U.S. inflation expectations and renewed geopolitical tensions in Eastern Europe is boosting safe-haven appetite. Still, intraday price action suggests possible liquidity sweeps into resistance before price retraces back towards demand zones.
________________________________________
📌 Key Structure & Liquidity Zones (1H):
• 🔴 SELL SCALP 3,787–3,785 (SL 3,794): Premium resistance where liquidity runs may spark short-term selling towards 3,780 → 3,775 → 3,770.
• 🟢 BUY ZONE 3,725–3,723 (SL 3,718): Pullback demand aligned with structure, favouring longs towards 3,740 → 3,755 → 3,770+.
• 🟢 BUY ZONE 3,688–3,686 (SL 3,680): Deeper discount demand area, attractive for positional buys targeting 3,700 → 3,715 → 3,730+.
________________________________________
📊 Trading Ideas (Scenario-Based):
🔺 Buy Setup – Pullback Demand (3,725–3,723)
• Entry: 3,725–3,723
• Stop Loss: 3,718
• Targets:
TP1: 3,740
TP2: 3,755
TP3: 3,770+
🔺 Buy Setup – Discount Demand (3,688–3,686)
• Entry: 3,688–3,686
• Stop Loss: 3,680
• Targets:
TP1: 3,700
TP2: 3,715
TP3: 3,730+
🔻 Sell Setup – Liquidity Sweep (3,787–3,785)
• Entry: 3,787–3,785
• Stop Loss: 3,794
• Targets:
TP1: 3,780
TP2: 3,775
TP3: 3,770
________________________________________
🔑 Strategy Note
Rising inflation concerns and safe-haven flows from geopolitical risks are keeping gold buyers in play. However, smart money could drive engineered stop-hunts near premium resistance before retracements set in. The bias remains buy-on-dips around key supports, while short-term scalps against liquidity sweeps near 3,787–3,785 should be approached with caution. Volatility is expected as markets digest U.S. inflation updates and risk headlines.
Futures market
Gold Neowave UpdateFX:XAUUSD Namaskaram Everyone
Welcome to intelligent investor, we provide market insights by synchronising and combining all the price action waves from different time frames and gives you single trend.
GOLD & BTCUSD Video Analysis
How To Read My Charts...Click Below

XAUUSD : 24/09/25 - SL HIT 1. Entered a pullback trade at sell side during NY session
2. Anticipated price to fall once resistance candle has formed
3. Took Sell side entry once running candle low was broken after making top wick
4. SL was hit ( Managed risk )
Mistakes:
1. The resistance confirmed candle body is not big, Also , the resistance candle wick is over extended
2. The running candle ( Entry candle ) first formed directly bottom wick with 15 pips , the price has moved down 15 pips already and i have entered on break of low of that running candle , which is over extended


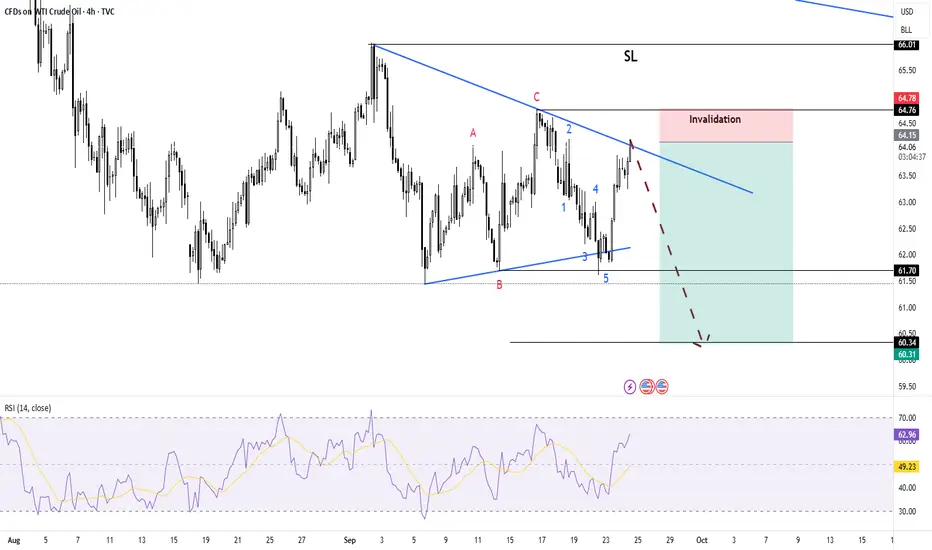
US OIL ready to shortI sse USOil with good R/R setup. Impulse down at day TF and abc upward and again impulse downward.
XAUUSD – Pressure at the 3777 zone, adjustment scenario and trenXAUUSD – Pressure at the 3777 zone, adjustment scenario and trend-following buy
Technical Analysis
After a strong rally, gold (XAUUSD) is now approaching the resistance zone of 3777–3780, where it converges with the Fibonacci expansion cluster and the old resistance structure. This is a price zone prone to short-term selling pressure and is a decisive point for the next trend.
EMA200 (H1: 3685) is still clearly sloping upwards → the main trend remains bullish, but the market is in a state of range expansion, with the possibility of a correction before continuing upward.
RSI (14) is currently oscillating around 57–60, indicating that the upward momentum has cooled, not yet entering the overbought zone but posing a risk of divergence if the price forms a new peak without accompanying momentum.
The Volume Profile levels and support zones 3738–3740 / 3719–3722 / 3661–3665 will be where buyers can react to protect the main trend.
Trading Scenarios
Scenario 1 – Sell adjustment at resistance zone:
Entry: 3777–3780
SL: 3784
TP: 3755 – 3742 – 3730 – 3705
Scenario 2 – Short-term Buy scalping:
Entry: 3738–3740
SL: 3734
TP: 3747 – 3755 – 3770
Scenario 3 – Trend-following Buy (preferred when deep correction):
Entry: 3719–3722
SL: 3715
TP: 3728 – 3740 – 3765 – 3780
Price Zones to Watch
3777–3780: important resistance, potential Sell zone.
3738–3740: near support, suitable for Buy scalping.
3719–3722: main Buy zone for recovery, confluence with support structure.
3705: deep support, target if correction trend expands.
Outlook
The major trend for gold still leans towards bullish, however, the 3777–3780 zone currently plays a decisive role. Sellers can take advantage of short-term Sell to catch the correction, while buyers should wait for the price to retreat to support zones to enter trend-following orders.
This is a reference scenario based on technical analysis, not an investment recommendation. Stay tuned for earlier analyses and prepare well for your trading plan.

BUYER FOMO: BREAK ALL THE RULES📌 GOLD – Trading Plan OANDA:XAUUSD
Follow Signals On weekend Linda published you got SELL PLAN 3720 +120PIPS
Absolutely that up first down after:
1. Market Context (H1)
Main trend: Bullish (following several upward BOS).
The price has just broken the peak and created new liquidity above the 3715 – 3720 zone.
Below, there are CP Orders + FVG at 3693 / 3669 / 3650 → the price may retrace to test demand before continuing to rise.
Above: the 3749 – 3750 zone is a strong resistance, likely to see liquidity sweeps.
2. Main Scenario – BUY with the trend
Entry 1: CP ORDER + Trend Timing
Zone: 3693 – 3695.
Stoploss: 3685.
TP1: 3715.
TP2: 3730+.
R:R ratio: ~1:3.
Entry 2: Deeper CP ORDER
Zone: 3669 – 3670.
Stoploss: 3660.
TP1: 3710.
TP2: 3730+.
R:R: ~1:4.
Entry 3: Final FVG
Zone: 3650 – 3655.
Stoploss: 3640.
TP: 3710 – 3720.
This is the final entry; if it breaks, consider the trend reversed.
3. Alternative Scenario – SELL counter-trend (scalp)
Entry Sell
Zone: 3749 – 3750 (resistance + liquidity).
Stoploss: 3757.
TP1: 3730 – 3735.
TP2: 3695 – 3670 (if selling pressure is strong).
Confirmation required on M5/M15:
MSS down.
Bearish engulfing.
Long wick rejection.
4. Capital Management
Total risk for the day: max 3 – 4% of the account.
Each trade risk 1 – 1.5%.
Prioritize Buy, Sell is just a small scalp.
If the price hits TP1 → move SL to entry, let the rest run.
5. Notes
Main trend: Bullish, don't attempt too many counter-sells.
Only sell when clear signals appear at 3749 – 3750.
The 3693/3669 mark is a key zone → if it breaks strongly, wait for trend confirmation.

Part 2 Ride The Big Moves 1. Option Pricing and Valuation
Option prices are determined by two main components:
1.1 Intrinsic Value
The difference between the current price of the underlying asset and the option’s strike price.
1.2 Time Value
The remaining portion of the premium, reflecting time until expiration and volatility. Options with longer time to expiration usually have higher time value.
1.3 Factors Affecting Option Prices
Underlying Asset Price: Movement in the underlying asset directly affects the option’s value.
Strike Price: Determines whether the option is ITM, ATM, or OTM.
Time to Expiration: Longer expiration provides higher flexibility and premium.
Volatility: Higher volatility increases option premiums.
Interest Rates: Rising interest rates can increase call option values and decrease put option values.
Dividends: Expected dividends reduce the value of call options.
1.4 Option Pricing Models
Black-Scholes Model: Widely used for European options, factoring in asset price, strike price, time, volatility, and risk-free rate.
Binomial Model: Flexible and suitable for American options, where early exercise is possible.
2. Risk and Reward in Options Trading
2.1 Risk for Option Buyers
The maximum risk for buyers is limited to the premium paid. If the market moves unfavorably, the option can expire worthless, but the loss cannot exceed the initial investment.
2.2 Risk for Option Sellers (Writers)
Sellers face potentially unlimited risk:
For a call writer without owning the underlying asset (naked call), losses can be infinite if the asset price rises sharply.
For put writers, losses occur if the asset price falls significantly below the strike price.
2.3 Reward Potential
Buyers have unlimited profit potential for calls and substantial profit for puts if the market moves favorably.
Sellers earn the premium as maximum profit, regardless of market movement, assuming they manage positions correctly.
3. Hedging and Speculation Using Options
3.1 Hedging
Options are a powerful tool for risk management. For instance:
Investors holding a stock can buy put options to protect against downside risk.
Traders can use options to lock in profit targets or minimize losses.
3.2 Speculation
Speculators use options to capitalize on market movements with limited capital. Examples:
Buying calls to profit from an anticipated rise.
Buying puts to profit from an anticipated fall.
Using complex strategies to exploit volatility or time decay.
4. Options in Different Markets
4.1 Stock Options
Options on individual stocks are most popular and widely traded. They provide leverage and hedging opportunities.
4.2 Index Options
Options on market indices like Nifty or S&P 500 allow traders to speculate on broader market trends.
4.3 Commodity Options
Used in commodities markets like gold, crude oil, and agricultural products for hedging or speculation.
4.4 Currency Options
Provide protection or speculation opportunities in the forex market against currency fluctuations.

Gold Soars: Will a Weak USD Open the Door for New Highs?Hello traders, it’s clear that gold is rising sharply, supported by the weakening of the USD. Can gold continue to conquer new highs?
On the chart, the price is moving within a clear upward channel. The key support level at 3,750,000 has been tested multiple times, and if the price holds above this level, gold could continue rising towards 3,827,000. The areas near recent highs also show an increase in trading volume, reinforcing the bullish trend.
Forecasts indicate that the U.S. labor market is slowing down, with 233K jobs created, slightly higher than the previous 231K. This weakens the USD, creating an opportunity for gold to continue its rise, as gold typically benefits from a weaker USD.
With strong technicals and a weakening USD, XAU/USD could continue its upward momentum. Get ready for some exciting opportunities!

Gold 1H – Should We Hold or Fade Liquidity at 3800?On the 1-hour timeframe, gold is trading near 3,776 within a corrective channel. Premium liquidity remains clustered above 3,800–3,798, while discount demand is positioned at 3,725–3,727. Recent BOS (Break of Structure) signals confirm bullish intent, but engineered sweeps into premium zones are still likely before price retraces toward discount levels.
Today’s headlines on the Federal Reserve’s cautious approach and ongoing geopolitical tensions in the Middle East are reinforcing safe-haven demand. However, intraday volatility may continue to produce liquidity grabs before clear direction is established.
________________________________________
📌 Key Structure & Liquidity Zones (1H)
• 🔴 SELL GOLD LIQUIDITY 3,800–3,798 (SL 3,807):
Premium resistance where liquidity sweeps may cause rejections towards 3,770 → 3,760 → 3,755.
• 🟢 BUY ZONE 3,725–3,727 (SL 3,720):
Discount demand in line with BOS, with upside targets at 3,740 → 3,760 → 3,775.
________________________________________
📊 Trading Ideas (Scenario-Based)
🔻 Sell Setup – Liquidity Run (3,800–3,798)
• Entry: 3,800–3,798
• Stop Loss: 3,807
• Take Profits:
o TP1: 3,770
o TP2: 3,760
o TP3: 3,755
🔺 Buy Setup – Discount Demand (3,725–3,727)
• Entry: 3,725–3,727
• Stop Loss: 3,720
• Take Profits:
o TP1: 3,740
o TP2: 3,760
o TP3: 3,775+
________________________________________
🔑 Strategy Note
With the Fed’s cautious stance and geopolitical risks supporting gold, the broader bias remains buy-the-dip. At the same time, fading engineered sweeps into premium liquidity zones can offer tactical short-term opportunities. Expect volatility around 3,800 liquidity runs before retracements into well-defined discount zones.

Understanding the Psychology of Trading1. The Role of Psychology in Trading
Trading is a mental battlefield. Financial markets are complex systems influenced by countless variables, from economic data and geopolitical events to investor sentiment. However, the human mind is inherently emotional, often reacting irrationally to market fluctuations.
Even the most robust trading strategies can fail if a trader cannot manage emotions such as fear, greed, overconfidence, or frustration. Psychological discipline ensures traders follow their plans consistently, avoid impulsive decisions, and maintain a long-term perspective. Studies suggest that over 80% of trading mistakes are rooted in poor psychological management rather than technical errors.
Key aspects of trading psychology include:
Emotional regulation: Maintaining composure in the face of gains and losses.
Cognitive control: Avoiding biases that cloud judgment.
Discipline: Following trading rules and strategies without deviation.
Resilience: Recovering quickly from losses and mistakes.
2. Common Emotional Traps in Trading
2.1 Fear
Fear is perhaps the most pervasive emotion in trading. Fear manifests in several ways:
Fear of losing: Traders may hesitate to enter positions, missing opportunities.
Fear of missing out (FOMO): Conversely, traders may impulsively enter trades to avoid missing profits, often at unfavorable prices.
Fear after losses: A losing streak can lead to panic and overly cautious behavior, reducing trading effectiveness.
Example: A trader sees a strong upward trend but hesitates due to fear of a sudden reversal. By the time they act, the price has already surged, causing frustration and regret. This cycle often leads to indecision and missed profits.
2.2 Greed
Greed is the desire for excessive gain, often leading to poor risk management. Traders may hold on to winning positions too long, hoping for unrealistic profits, or take excessive risks to recover previous losses.
Example: A trader makes a small profit but refuses to exit, hoping for a bigger gain. Suddenly, the market reverses, and the profit evaporates, turning into a loss.
2.3 Overconfidence
After a series of successful trades, traders may develop overconfidence, believing they are infallible. This often leads to reckless trades, ignoring risk management rules, and underestimating market volatility.
2.4 Impatience
Markets do not always move predictably. Impatience causes traders to enter or exit positions prematurely, deviating from their strategy. The result is frequent small losses that accumulate over time.
3. Cognitive Biases in Trading
Cognitive biases are systematic thinking errors that affect decision-making. Recognizing these biases is crucial for traders.
3.1 Confirmation Bias
Traders often seek information that confirms their existing beliefs while ignoring contrary evidence. This bias can lead to holding losing positions or entering trades without proper analysis.
3.2 Anchoring Bias
Anchoring occurs when traders fixate on specific price levels or past outcomes, influencing future decisions irrationally. For instance, a trader may refuse to sell a stock below their purchase price, even when fundamentals have deteriorated.
3.3 Loss Aversion
Humans are naturally more sensitive to losses than gains. In trading, loss aversion may prevent traders from cutting losses early, hoping the market will turn, which often worsens financial outcomes.
3.4 Recency Bias
Traders give undue weight to recent events, assuming trends will continue indefinitely. This bias can cause chasing performance or overreacting to short-term market moves.
4. The Importance of Discipline in Trading
Discipline is the bridge between strategy and execution. A disciplined trader follows a clear set of rules and adheres to risk management, regardless of emotional fluctuations.
4.1 Developing a Trading Plan
A trading plan is a blueprint that defines:
Entry and exit criteria
Risk-reward ratio
Position sizing
Trade management rules
Example: A trader may decide to risk only 2% of their account on a single trade and exit if losses reach that limit. Following this plan consistently prevents emotional decisions and catastrophic losses.
4.2 Sticking to Risk Management
Risk management is the cornerstone of psychological stability. Setting stop-losses, diversifying trades, and controlling leverage ensures that no single loss can devastate your account or trigger panic.
5. Emotional Control Techniques
Successful traders develop mental strategies to control emotions and maintain focus.
5.1 Mindfulness and Meditation
Mindfulness techniques improve awareness of thoughts and feelings, helping traders remain calm during volatility. Meditation has been shown to reduce stress and improve decision-making under pressure.
5.2 Journaling
Maintaining a trading journal helps identify recurring emotional patterns and mistakes. By recording each trade, the rationale behind decisions, and emotional states, traders can objectively review performance and refine their strategies.
5.3 Routine and Preparation
A structured daily routine reduces emotional fatigue. Preparation includes reviewing charts, setting alerts, and defining trading goals before market hours.
5.4 Breathing and Relaxation Techniques
Simple breathing exercises can reduce stress during high-pressure trading moments, preventing impulsive decisions.
6. Building a Resilient Trading Mindset
6.1 Accepting Losses as Part of Trading
Losses are inevitable in trading. Accepting them as a natural part of the process prevents emotional spirals and promotes learning from mistakes.
6.2 Focusing on Probabilities, Not Certainties
Markets are probabilistic. Traders must view each trade as a calculated bet, not a guaranteed outcome. Focusing on risk-reward ratios and statistical probabilities reduces emotional overreactions to individual trades.
6.3 Continuous Learning and Adaptation
Markets evolve, and so should traders. A resilient mindset embraces learning from both successes and failures, adapting strategies to changing market conditions.
7. Psychological Traits of Successful Traders
Through observation and research, several psychological traits consistently appear in successful traders:
Patience: Waiting for the right setup rather than forcing trades.
Discipline: Adhering to plans and strategies without deviation.
Emotional stability: Remaining calm under pressure.
Self-awareness: Recognizing personal biases and tendencies.
Confidence without arrogance: Trusting analysis without reckless behavior.
Adaptability: Adjusting strategies as markets evolve.
8. Avoiding Psychological Pitfalls
8.1 Overtrading
Overtrading is driven by boredom, greed, or the desire to recover losses. It usually results in higher transaction costs and emotional exhaustion. Limiting the number of trades and focusing on quality setups can mitigate this.
8.2 Revenge Trading
After a loss, some traders attempt to “win back” money through aggressive trades. This emotional reaction often leads to larger losses. Accepting losses calmly and returning to a plan is key.
8.3 Chasing the Market
Jumping into trades based on hype or short-term trends often results in poor entries and exits. Patience and adherence to trading plans prevent this behavior.
9. Developing Mental Strength Through Simulation and Practice
Simulation trading or “paper trading” allows traders to practice strategies without financial risk. This helps build psychological resilience, test reactions to losses, and develop disciplined trading habits. Reviewing simulated trades offers insights into emotional patterns and decision-making flaws.
10. Integrating Psychology Into Strategy
Successful trading requires the integration of psychological awareness into technical and fundamental strategies. Some approaches include:
Pre-trade checklist: A psychological and analytical checklist ensures readiness for trades.
Post-trade reflection: Assessing decisions objectively to identify emotional interference.
Routine review sessions: Weekly or monthly analysis of trades to refine strategy and mindset.
11. Real-World Examples of Psychological Trading
George Soros: Known for his high-risk trades, Soros emphasizes the importance of understanding one’s own psychology and the market’s reflexive behavior. His success stemmed from disciplined risk management and emotional control, even in volatile markets.
Jesse Livermore: Despite enormous successes, Livermore’s career was marked by the dangers of emotional trading, including overconfidence and revenge trading. His life highlights the balance between psychological mastery and the destructive power of unchecked emotions.
Retail Traders: Many retail traders fail due to emotional decision-making, overtrading, and lack of risk discipline. Psychological resilience differentiates consistent winners from occasional profitable traders.
12. Conclusion
Trading is as much a psychological pursuit as it is a technical or analytical one. Emotional regulation, cognitive control, discipline, and resilience are crucial for consistent success. Understanding one’s own mind, recognizing biases, and developing a disciplined, patient approach transforms trading from a high-stress gamble into a strategic, probabilistic endeavor.
Mastering the psychology of trading is an ongoing journey. It requires self-awareness, continuous learning, and practice. By integrating psychological insights into trading strategies, traders can navigate market volatility with confidence, make rational decisions, and achieve long-term profitability.
In short, the mind is the ultimate trading tool. Sharpen it, discipline it, and respect it, and the markets become not just a place of opportunity, but a mirror reflecting your mastery over fear, greed, and uncertainty.

xau usd- LONGxauusd - 1h mss+golden zone +fvg=3800. smc -sell side liquidity sweep and buy side mss .waiting for pullback for long entry

Gold hits record 3,759 | Safe-haven flows surge back🟡 XAU/USD – 23/09 | Captain Vincent ⚓
🔎 Captain’s Log – Context & News
Today Gold surged nearly +2% , hitting a record $3,759/oz .
Geopolitical tensions : Israel launched missiles into Lebanon, killing 5 (including 4 US citizens) → safe-haven demand rushed back into Gold.
USD weakened , capital flowed out of stocks & bonds → strong support for precious metals.
ETFs & speculators : heavy buying amplified the rally.
Silver : jumped to its highest level in 14 years, reinforcing strength in the precious metals sector.
⏩ Captain’s Summary : Gold is fueled by geopolitics, macro factors, and safe-haven demand. But after a hot rally, the big question: continue breaking highs or face sharp swings if the FED shifts tone?
📈 Captain’s Chart – Technical Analysis (H45)
Storm Breaker (Resistance / Sell Zone)
3,771 – 3,787 (Fibo 0.5–0.618 confluence, ATH test zone)
Golden Harbor (Support / Buy Zone)
Near support: 3,740 (previous high turned support)
OB Dock: 3,717 – 3,723
Breakout Harbor: 3,689 – 3,691
Market Structure
Gold broke out to Higher High around 3,755 – 3,759.
Main trend remains bullish, but prone to volatility / pullback after a hot rally.
🎯 Captain’s Map – Trade Plan
✅ Buy (trend-follow priority)
Buy Zone 1 (OB)
Entry: 3,717 – 3,723
SL: 3,707
TP: 3,725 – 3,730 – 3,735 – 3,740 – 3,750
Buy Zone 2 (Breakout Retest)
Entry: 3,689 – 3,691
SL: 3,678
TP: 3,699 – 3,710 – 3,7xx
⚡ Sell (short-term scalp if overbought)
Sell Zone (ATH test)
Entry: 3,783 – 3,785
SL: 3,795
TP: 3,759 – 3,740 – 3,717
⚓ Captain’s Note
“The geopolitical storm pushed the Golden sails past 3,759. Golden Harbor 🏝️ (3,717 – 3,689) is the safe dock for sailors to board the northbound trend. Storm Breaker 🌊 (3,771 – 3,787) may raise heavy waves, suitable for short Quick Boarding 🚤 scalps. The main voyage remains bullish, but after a hot rally, sailors must keep a firm hand on the helm to avoid being thrown off by choppy swings.”

LiamTrading – XAUUSD H1LiamTrading – XAUUSD H1: Adjustment structure formed, awaiting confirmation below 3685
After the surge to 375x, gold is entering a correction phase in line with the structural pattern. On H1, the price clings to the upper edge of the rising wedge, with RSI cooling off from overbought levels, indicating that supply pressure is starting to dominate. Today's plan focuses on the adjustment structure, prioritising selling upon confirmation signals.
Key price zones (as per the attached chart)
Sell strong resistance 3775–3785: confluence of channel top + 2.618 extension. Look for weakening reactions to initiate short/medium-term sell orders.
Buy zone volume 3726–3720: a thin support area providing momentum for a rebound. Holding this zone could push the price to retest 3750–3775; conversely, losing 3720 may lead to a deeper decline.
Resistance + FVG 3715–3698: as the price drops, this area turns into supply; a failed retest here is an early signal for further decline.
Confirm sell 3688–3685: closing H1 below this zone confirms a short-term downtrend, targeting a lower buy zone.
BuyZone 3652–3646: confluence of channel bottom + old liquidity, expecting a strong bullish reaction if revisited.
Reference trading scenarios (adhering to risk management)
Sell reaction at peak: 3778–3783, SL 3792, TP 3755 → 3738 → 3722.
Sell on confirmation: wait for H1 to close below 3685, enter sell 3684–3682, SL 3696, TP 3673 → 3656 → 3648.
Buy scalp by volume: 3726–3720, SL 3715, TP 3738 → 3750 (only short-term if the larger structure remains corrective).
Buy swing at strong zone: 3652–3646, SL 3639, TP 3673 → 3698 → 3712 → 3740.
Operational notes
Prioritise waiting for rejection/closing signals at the mentioned zones; avoid chasing orders in between.
Order volume should be allocated according to confirmation levels (confirmation zone < breakdown < failed retest).
Avoid excessive leverage; adjust SL according to structure when in profit.
This is a personal perspective, not an investment recommendation. If you want the quickest updates on the next XAUUSD scenarios, follow me and join my community for discussions.

XAUUSD 09/24 – Scenario after the Fed's Key SpeechHello everyone,
Gold continues its upward momentum in recent sessions. Yesterday, the price touched the 1.618 Fibonacci level on the H4 chart and then declined, indicating a slight rejection right after the PMI news.
Technical Perspective
The Wolfe Waves structure remains intact, not yet broken.
If the price returns inside the trendline, the signal confirming the Wolfe pattern will become clearer.
Current key resistance area: 3790 – 3825, coinciding with Fibonacci 361.8.
Noteworthy short-term support area: 3650 – 3647.
Fundamental Perspective
In yesterday's speech, Chairman Powell emphasised: “If monetary policy is eased too quickly, efforts to curb inflation will fail.”
This indicates that the Fed continues to prioritise price stability over the market's expectations for rate cuts. This is a factor to consider when trading gold in the current phase.
Today's Trading Scenario
Sell Setup
Entry: 3825 – 3827
SL: 3833
TP: 3810 – 3790 – 3768 – 3755
Buy Setup
Entry: 3650 – 3647
SL: 3642
TP: 3672 – 3688 – 3695 – 3710 – 3750
Summary
In the short term, gold is in a correction phase after hitting resistance. Prioritise observing signals around 3790 – 3825 to find Sell opportunities, while 3650 is a notable buying point for a recovery scenario.
This is today's XAUUSD trading scenario according to the Wolfe Waves model. You can refer to and adjust according to your personal strategy.
Follow me for the latest analyses as the market changes.
Wishing you successful trading!

Elliott Wave Analysis XAUUSD – September 24, 2025📊
________________________________________
🔹 Momentum
D1
• Daily momentum is currently rising.
• So far, we have counted 4 bullish candles, which is the minimum requirement to complete a momentum cycle.
• There may be 1–2 more daily candles before momentum enters the overbought zone and reverses.
H4
• H4 momentum is in the oversold zone and about to reverse.
• The upcoming H4 bullish swing is critical:
o If it breaks the previous high → the uptrend continues, and we can expect another 1–2 daily bullish candles before reversal.
o If it fails to break the high → we must prepare for a reversal scenario.
H1
• H1 momentum is also heading into the oversold zone.
• This creates a confluence between H4 and H1, signaling a possible bullish move ahead.
________________________________________
🔹 Wave Structure
D1
• The yellow wave ⑤ has reached its first target at 3789.
• This is a strong resistance zone because:
o It aligns with the 0.382 Fibo retracement of waves ①–③ yellow.
o Wave ⑤ equals the length of wave ① yellow.
• If D1 momentum enters the overbought zone and price fails to break 3789, this may mark the top of wave ⑤ yellow, potentially triggering a sharp and prolonged decline.
H4
• Price has already seen a 5-candle decline on H4, with momentum in the oversold zone → this correction is near completion.
• Two possibilities:
1. It is wave ④ of wave ⑤ yellow.
2. It is the start of wave ① of a new bearish structure.
• If the next bullish move fails to break the previous high, the bearish wave ① scenario is confirmed, leading to a wave ③ decline with strong and steep characteristics.
H1
• A deeper and longer correction than previous ones has appeared, which is unusual, especially since price already reached the first target of wave ⑤ yellow.
• However, we should not rush to catch the top, as this unusual behavior is only visible on H1, while H4 and D1 still look normal.
• If this is wave ④, or wave ① of a bearish structure, or even just wave A → the next move should still bring a bullish swing confluence, providing an opportunity to look for Buy entries.
________________________________________
🔹 Key Support Zones
• 3747 – 3737
• 3729
________________________________________
🔹 Trading Plan
Scenario 1:
• Buy Zone: 3747 – 3744
• SL: 3735
• TP: 3774
Scenario 2:
• Buy Zone: 3730 – 3727
• SL: 3720
• TP: 3767

Gold Sets New Record: Rate Hopes Driving Price HigherHello, traders!
Gold surged to a record high of $3,726.19/oz on September 22, fuelled by growing investor expectations for a clearer Fed rate-cutting path. Traders are now betting on two more rate cuts this year with a very high probability.
The growth drivers have shifted from being primarily central bank and Asian demand to now include strong buying from Western investors, as shown by increased holdings in gold ETFs. Upcoming speeches from Fed officials and the core PCE inflation data this week will be key in determining the market's next direction.
Technical Analysis & Strategy
Gold is in a strong uptrend and is continuously setting new highs. While there was a minor correction, the bullish momentum remains intact. Shorting near resistance levels is highly risky.
Outlook: Continue to prioritize Buy positions if gold holds above $370x.
Resistance: $3785, $3794, $3804
Support: $3774, $3764, $3754
Suggested Trading Strategy:
Buy Scalp: Zone $3765 - $3763, SL $3759
Buy Zone: Zone $3754 - $3752, SL $3744
Sell Zone: Zone $3800 - $3802, SL $3810
The market is highly volatile. Do you think gold can hit the $3,800 mark this week? Share your thoughts! 👇
#Gold #XAUUSD #Fed #GoldAnalysis #TradingView #InterestRates #Inflation #ATH

SILVERHello & welcome to this analysis
Silver in daily time frame appears to be in its 5th wave.
The larger impulse could end anywhere between $43.50 - 45 / INR 125000 - 129000. From there I expect it to retrace to $38 /INR 116000
MCX Silver will depend largely on $:INR movement.
Silver remains a strong commodity for medium to long term and all dips should be used to add.
All the best

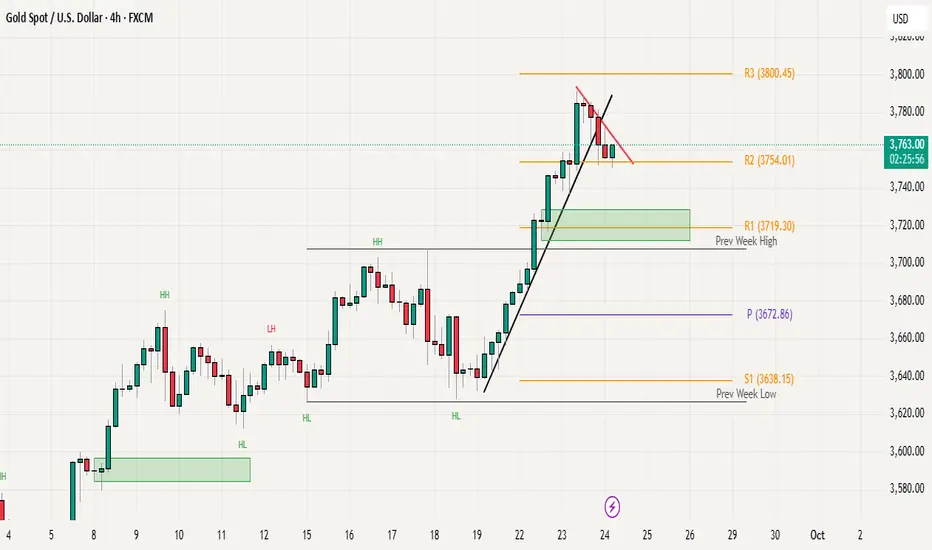
Gold Price Action: Trendline Break but Bulls Still in ControlGold posted a fresh all-time high yesterday near 3790 before entering a healthy pullback phase after an extended intraday rally. The higher-timeframe structure remains constructive, with the market still maintaining its higher-highs and higher-lows sequence. However, price action has broken below the rising trendline support we discussed in yesterday’s update, signaling a short-term pause in momentum.
At the moment, gold is consolidating just above R2 (3754), which continues to act as an important intraday support. For bulls to regain momentum and extend the rally, price needs to break above the declining red resistance trendline and sustain above the 3790–3800 zone. A breakout here could open the door for further upside continuation.
On the other hand, a confirmed H4 close below 3750 could invite deeper profit-taking, with the 3700–3710 area (previous week’s high) remaining the key demand zone and primary downside support.
Overall, the broader trend remains bullish, but price action is currently in a consolidation phase. Watching for either a breakout above resistance or a close below 3750 will provide clarity on the next directional move.
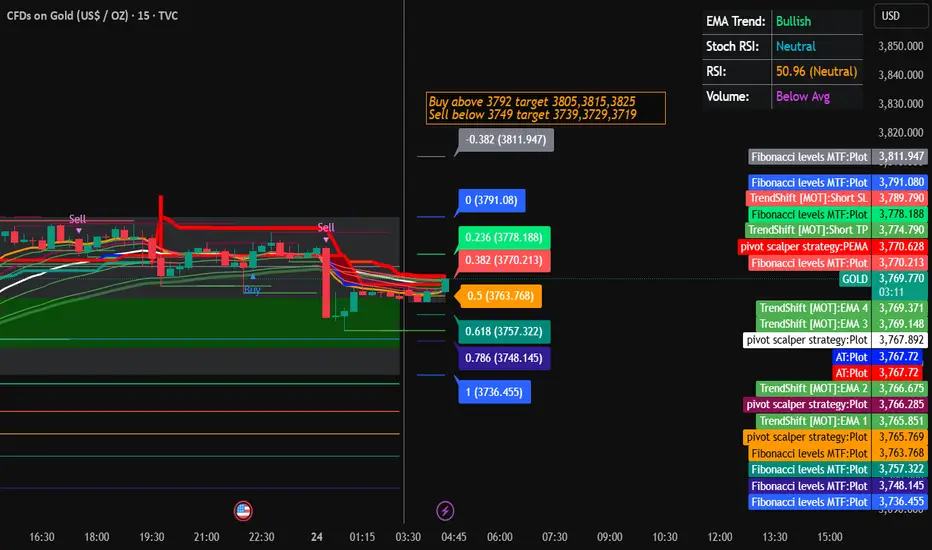
Gold Trading Strategy for 24th September 2025 (IST 0445 AM)📊 GOLD TRADING SETUP (XAU/USD)
✨ Buy Setup
🔼 Entry: Buy above the high of 1-hour candle close above 3792
🎯 Targets:
🥇 3805
🥈 3815
🥉 3825
🛡️ Stop Loss (SL): Place SL a few points below 3792 (manage according to risk appetite).
⚡ Sell Setup
🔽 Entry: Sell below the low of 15-min candle close below 3749
🎯 Targets:
🥇 3739
🥈 3729
🥉 3719
🛡️ Stop Loss (SL): Place SL a few points above 3749 (manage according to risk appetite).
📌 Key Notes
📉 Always wait for candle close confirmation before entering trade.
📈 Position sizing should match your risk tolerance.
🔍 Monitor news/events impacting gold volatility (USD data, Fed updates, geopolitical events).
⚖️ Do not over-leverage.
⚠️ Disclaimer
This analysis is for educational and informational purposes only. It is not financial advice or a buy/sell recommendation. Trading in gold and financial markets involves high risk, including possible loss of capital. Always do your own research or consult a financial advisor before making trading decisions.
Gold Trading Strategy | September 23-24✅ 4H Chart Analysis: Gold has been trending upward since stabilizing around 3613, reaching as high as 3791, where it encountered resistance and pulled back into consolidation at high levels. The overall trend remains bullish, but there is short-term correction pressure. The moving averages are still in a bullish alignment, with the MA20 rising and providing support below. Gold is currently in a strong upward trend but consolidating at the highs; if it fails to break through 3791–3810, there is a risk of a short-term pullback. Key supports to watch are 3760 and 3726.
✅ 1H Chart Analysis: On the 1-hour chart, gold pulled back quickly after meeting resistance at 3791 and is now fluctuating between 3770–3780, entering short-term consolidation. The short-term moving averages have turned down, with price hovering around the MA10. If gold cannot quickly reclaim 3790, further downside consolidation may follow.
🔴 Resistance Levels: 3790–3795 / 3800–3810
🟢 Support Levels: 3765–3760 / 3738–3726
✅ Trading Strategy Reference:
🔰 Long Setup (Buy on pullback, trend-following)
● Entry Zone: 3760–3765
● Stop Loss: Below 3750
● Take Profit Target: 3790–3810
🔰 Short Setup (Sell on resistance)
● Entry Zone: 3790–3795
● Stop Loss: Above 3805
● Take Profit Target: 3765–3738
🔥Trading Reminder: Trading strategies are time-sensitive, and market conditions can change rapidly. Please adjust your trading plan based on real-time market conditions.

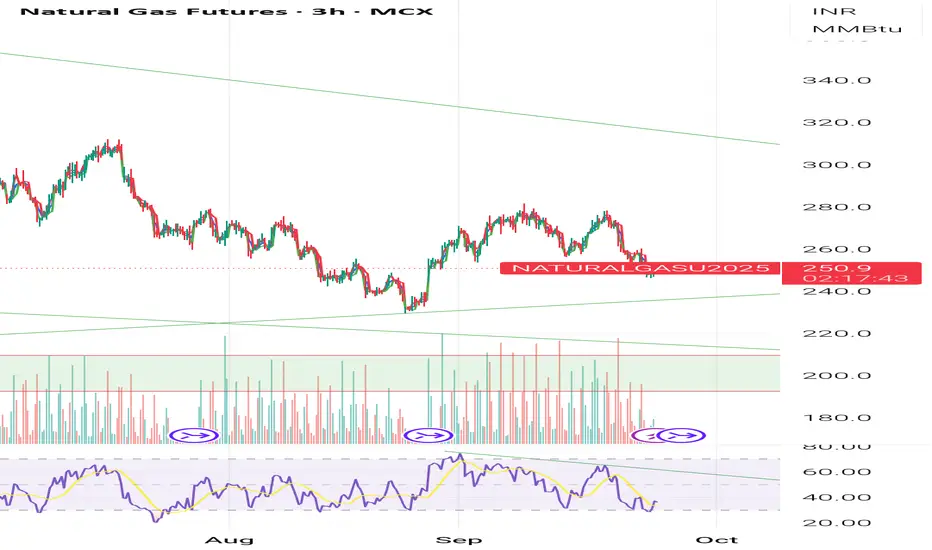
Natural Gas My last analysis about natural Gas was failed now it is in no trade zone , update you soon as I will see a trade opportunity.