XAUUSD – Inverse Head and Shoulders Pattern Still Active...XAUUSD – Inverse Head and Shoulders Pattern Still Active, Continue to Prioritise Buying at POC
I maintain the view that the current dominant trend is buying based on the inverse head–and–shoulders structure, and the bullish wave is not yet complete. The plan is to wait for price to retrace into the POC zone to re-enter with the trend, avoiding chasing buys at the highs.
🎯 Main Scenario – BUY THE DIP AT POC
Buy: 4,133 – 4,130
SL: 4,123
TP: 4,155 – 4,178 – 4,200 – 4,250 – extended targets if momentum remains strong
For me, total risk per trade never exceeds 1–2% of the account. A good setup with poor risk management is still a bad trade.
1. Fundamental Context
Gold is maintaining its upward momentum, trading near its highest levels in about two weeks.
The US Dollar is weakening as markets increase bets on the Fed cutting rates soon, following data showing continued cooling in inflation.
Lower yields and a softer USD reduce the opportunity cost of holding gold, supporting the flow back into safe-haven assets.
With this backdrop, I do not prioritise large sell setups. Most pullbacks are mainly opportunities for me to accumulate long positions.
2. Technical Analysis & Market Sentiment
On the H1 timeframe, gold has formed and activated an inverse head–and–shoulders pattern, confirming a bullish reversal phase.
Price is retracing to retest the POC zone around 4,133–4,130, overlapping the previous accumulation area where heavy sell orders were absorbed. This is the zone I prioritise for buying.
Below this lies a deeper FVG acting as secondary support; however, I’m not waiting for price to drop too far to avoid missing the core move of the pattern.
Regarding price behavior, recent pullbacks have been absorbed quickly, with multiple long-wick candles showing buyers are still in control. I’m waiting for a clean pullback into POC with a strong bullish reaction to trigger the entry.
3. Action Plan
Only enter positions when price returns to the 4,133–4,130 zone — absolutely no FOMO buying at higher levels.
Take partial profits at 4,155 – 4,178 – 4,200 – 4,250, leaving the remaining position open if gold continues to extend its bullish leg.
If price breaks below 4,123 and closes under that level, I will cut the trade immediately and reassess the structure — never hold on to a bias when the market has changed.
If this analysis is helpful, follow my TradingView channel and leave your comments. I always read feedback to improve and refine my future posts.
Futures market

XAU/USD: Gold Bullish, Waiting for Perfect Buy Pullback📊 Market Structure
Gold is maintaining a strong bullish structure after a series of BoS from the bottom region. The most recent rally broke the 4,130 mark and continues to hold above the small OB area, indicating that the BUY side is still in control.
Currently, the price is slightly retracing to retest the structure — the target is to test the area:
• OB 4,130 – 4,126 USD
• Or deeper to FVG 4,104 – 4,089 USD
In both cases, these are discount areas to continue BUYING according to the main trend.
The larger trend still targets the upper liquidity levels including:
• 4,151
• 4,181
• 4,207
• 4,243
💎 Key Technical Zones
• OB Retest Zone: 4,130 – 4,126 (quick bounce area)
• FVG Zone: 4,104 – 4,089 (best discount area to BUY)
• Large Bearish OB: 4,045 – 4,060 (final area if price adjusts deeply)
• Target Zones: 4,151 – 4,181 – 4,207 – 4,243
🎯 Trading Plan – BUY (priority)
1️⃣ BUY 1 – Retest OB 4,130
• Entry: 4,126 – 4,131
• SL: below 4,115
• TP1: 4,151
• TP2: 4,181
• TP3: 4,207
• TP4: 4,243
→ This is a quick setup – for a short retracement before continuing.
2️⃣ BUY 2 – FVG 4,104 – 4,089 (best)
• Entry: 4,089 – 4,104
• SL: 4,070
• TP1: 4,151
• TP2: 4,181
• TP3: 4,207
• TP4: 4,243
→ This FVG area is a strong confluence: fibo, small demand, and trendline.
3️⃣ BUY 3 – OB Bearish shift (deep entry)
• Entry: 4,045 – 4,060
• SL: 4,020
• TP1: 4,104
• TP2: 4,151
• TP3: 4,207
→ Only activate when the market shakes strongly, but RR is extremely good.
🎯 SELL Scalp (secondary – only short trades)
Only SELL when the price reaches strong resistance areas and rejection signals appear:
• 4,151
• 4,181
• 4,207
• 4,243
Entry SELL: only enter when there is H1 rejection
SL: 10–15 USD
TP: back to 4,151 → 4,130
→ This is counter-trend, not a priority setup.
🧠 Vincent’s View
The overall trend is still bullish. The current retracements are just a “breathing phase” – the market is accumulating energy to continue pushing up to higher liquidity areas.
As long as the price stays above 4,089 – the bullish trend is not threatened.
“Smart Money buys the dip — Retail buys the breakout.” ⚜️
⏰ Timeframe: 1H
✍️ Analysis by: Captain Vincent

Gold Awaits PPI & GDP – Buy Dips, Sell Rallies🟡 XAU/USD – PPI & GDP Data to Define Range Expansion
🔍 Market Context
Gold remains range-bound between $4000–$4100, consolidating after last week’s liquidity sweep.
This week’s key U.S. data — Core PPI, Retail Sales, GDP, and Core PCE — will likely dictate the next major move.
Slight improvement in inflation and consumption data could strengthen the USD temporarily, but overall bias remains bullish mid-term as the Fed is expected to maintain a dovish stance into Q1.
📊 Technical Outlook (4H Chart)
Main Sell Zone (Super OB): 4170–4200 → potential reversal supply zone.
Fair Value Gap (FVG): 4130–4160 → short-term reaction zone if price retraces.
Sell Zone: 4090–4095 → short opportunity aligned with intraday bearish structure.
Buy Zone 1: 4024–4025 → minor demand, expecting internal liquidity sweep.
Buy Zone 2 (Main OB): 4003–4001 → strong order block with multiple rejections; key liquidity pool.
Structure: H4 BOS (Bullish) intact, suggesting a liquidity sweep before next expansion upward.
🎯 Trade Plan
1️⃣ SELL Setup – Short-term reaction from FVG
Entry: 4090–4095
Stop Loss: 4100
Take Profit 1: 4055
Take Profit 2: 4040
Take Profit 3: 4025
➡️ Reasoning: Price is likely to tap the lower edge of FVG and sweep local liquidity before a downside reaction toward internal range demand.
2️⃣ BUY Setup – First demand zone test
Entry: 4024–4025
Stop Loss: 4022
Take Profit 1: 4065
Take Profit 2: 4080
➡️ Reasoning: Expecting a short-term liquidity grab below the mid-range before bullish continuation.
3️⃣ BUY Setup – Main OB accumulation zone
Entry: 4003–4001
Stop Loss: 3998
Take Profit 1: 4045
Take Profit 2: 4075
Take Profit 3: 4090
➡️ Reasoning: Deep liquidity zone aligning with higher-timeframe OB. If macro data disappoints, this area can trigger the next impulsive leg to retest 4170+.
🧭 Overall Bias
→ Ranging bias before Core PCE
→ Buy dips – Sell rallies within 4000–4100 until a clear breakout post-GDP/PCE data.
→ Watch for false breakouts around FVG and maintain risk control before U.S. session releases.

XAUUSD is skyrocketing after the Adam & Eve pattern!OANDA:XAUUSD is really interesting right now. The price seems likely to rise further after the formation of the Adam & Eve pattern. With such an easy-to-remember name, the Adam & Eve pattern is one of the most memorable. Below, I’ll explain the reasons and how to easily recognize it.
The Adam pattern is characterized by a sharp drop, followed by a quick recovery, forming a "V" on the chart. High, sharp, and aggressive! You could say it's more "masculine."
On the other hand, the Eve pattern develops more slowly. The price becomes more rounded, forming a wider and smoother base before rising again, creating a shape similar to the letter "U." Softer, more curved, and more "feminine."
Combining these two elements gives us the Adam & Eve pattern, which often signals a potential trend reversal. Especially when accompanied by fundamental analysis or other strong technical indicators.
This pattern will stick in your mind when you connect its shapes to the male and female aspects. A pattern that's truly hard to forget.

Gold Trading Strategy for 28th November 2025Trade plan (15-minute close rules)
Long (Buy) Plan 🟢
Entry: place a buy order after a 15-min candle closes above $4170 (you may use a market order on the next candle open or a buy-stop just above the high).
Primary targets:
Target 1: $4182 — partial take profit (TP1). 🎯
Target 2: $4195 — add/scale out or move stop to breakeven (TP2). 🎯🎯
Target 3: $4210 — final target (TP3). 🎯🎯🎯
Suggested stop placement:
Conservative: place stop just below the low of the breakout 15-min candle (preferred — price-action based). ⛔
Alternative fixed buffer: $10–$15 below entry (choose based on volatility and your timeframe). ⛔
Short (Sell) Plan 🔴
Entry: place a sell order after a 15-min candle closes below $4143. (Enter market on next open or use a sell-stop just below the low.)
Primary targets:
Target 1: $4132 — TP1. 🎯
Target 2: $4119 — TP2. 🎯🎯
Target 3: $4105 — TP3. 🎯🎯🎯
Suggested stop placement:
Conservative: stop just above the high of the breakdown 15-min candle. ⛔
Alternative fixed buffer: $10–$15 above entry.
Avoid averaging into shorts if price returns above the breakdown candle high — better to re-evaluate.
Risk management & rules (non-negotiable)
Always use a stop. Never trade without one. ⛔
Size to risk: keep risk per trade ≤ 1–2% of account (adjust to your plan). 📊
DISCLAIMER (must read) ⚠️
This is educational / informational only and not financial advice. Trading precious metals involves significant risk and you can lose more than your initial capital. Always do your own research and consider consulting a licensed financial advisor before trading. The trade rules above are based on technical levels you provided and general risk principles — they do not guarantee profit.

Update 3: GOLD BUY POINTS Buy point:
4148
4140
Target : 4172 - 4205
entry are valid only when you see 5 min CHoCH any candle touch a the zone and then any minor support breaks then punch a trade with Close base Sl on top and Vice versa
Sell side only when : if this triangle give breakout and then sell at 4168 and book near at 4145 and then again plan for a buy just play the move..
these are the points of reversal i already published this if you dont want to buy then just check the analysis tomorrow night

GOLD preparing for a big move. gold is trading in close consolidation range. wait for a break out or break down with price action for entry.

XAU/USD Bullish Continuation Setup Toward 4,223 After Liquidity 1. Market Structure
The chart highlights a COCH (Change of Character) followed by a BOS (Break of Structure), signaling a shift from bearish to bullish structure.
Several smaller coch points confirm internal bullish structure building.
2. Liquidity & POI Zones
There is a clear liquidity sweep near the PDL (Previous Day Low), where price dipped into a demand zone to collect orders.
An Extreme POI (Point of Interest) sits below current price — this acted as the strong reaction zone for the bullish move.
PDH (Previous Day High) is marked as an early short-term target/liquidity area.
3. Expected Move
The projection (zig-zag line) indicates bullish continuation after a pullback into the POI zone.
The target is marked around 4,223.629, matching the red horizontal resistance line.
The EMA (9) serves as dynamic support, showing price respecting the bullish trend.
4. Probability Outlook
As long as price stays above the trendline and POI, the bias remains bullish.
A break below the POI would invalidate the setup and open the lower liquidity region again.

GOLD 1H | PDH/PDL Compression Breakout • Cup & Handle + Rising WGOLD 1H – ICT + Price Action Analysis
Price is currently compressing between PDH (Previous Day High) and PDL (Previous Day Low) forming a rising wedge inside a broader cup & handle pattern.
🔹 Cup formation shows accumulation
🔹 Handle retest confirming buyers stepping in
🔹 Rising wedge indicates volatility squeeze
🔹 Price staying above PDL = bullish protection
🔹 PDH breakout expected if liquidity stays intact

Divergence Secrets Tips for Successful Option Trading
Always use stop-loss
Track IV and IV percentile
Learn market structure (trend, range, breakout)
Avoid buying options in low IV environments
Avoid selling options in highly trending markets
Maintain proper risk-to-reward
Never hold naked options till expiry if inexperienced
Focus on quality setups, not quantity

My Gold Trade Plan Gold is moving in a Triangle 🪭
Possible a short trade move can be made till tomorrow

USD Stunned: Buy Gold at the Adjustment Bottom!1. Fundamentals Quick Take
US Data: Positive (Jobless Claims 216K, lowest in 7 months, Durable Goods +0.5%).
Fed Policy: Extremely Dovish. Fed officials hint at a 25bps rate cut as early as December.
Impact: Low interest rate expectations push DXY down: Strong support for Gold.
2. Technical Outlook - H1
Trend: Strong Uptrend.
Position: Price is below Resistance/Supply (CP Zone - around 4,175 - 4,195). High likelihood of short-term adjustment.
Strategy: Focus on BUY (Long) at strong Demand/Support zones, do not Short based on short-term reactions.
Ideal Long Zone: Around 4,129 or 4,096.
Conclusion: Wait for price to adjust to the Demand zone to enter Long orders following the main trend, based on the USD's decline momentum from Fed signals.
#XAUUSD #Gold #Fed #DXY #TradingView

Gold may continue rising — Trading around 4,150–4,200 range📊 Market outlook:
• Spot gold is currently around 4,150 USD/oz.
• It is up roughly +0.20% (≈ +8 USD) over the past 24 hours.
• The rise is supported by expectations that the Federal Reserve (Fed) may cut interest rates soon, making non-yielding assets like gold more attractive.
📉 Technical view (short-term):
• Support zone: ~ 4,130 – 4,140 USD/oz — watch for a retracement bounce.
• Resistance zone: ~ 4,180 – 4,200 USD/oz — a breakout could trigger further gains.
• In a low-interest environment and with ongoing macro uncertainties, gold remains a safe-haven asset — bullish bias continues.
📌 Interpretation:
• In the short term, gold is likely to rise further if expectations of rate cuts remain strong.
• If U.S. economic data comes in stronger and the Fed turns hawkish → a minor correction is possible.
• Current bias: upside, but sensitive to U.S. economic data and Fed signals.
💡 Trading Strategy:
🔺 BUY XAU/USD: 4,135 – 4,132
🎯 TP: 40 / 80 / 200 pips
🛑 SL: 4,129
🔻 SELL XAU/USD: 4,185 – 4,188
🎯 TP: 40 / 80 / 200 pips
🛑 SL: 4,192

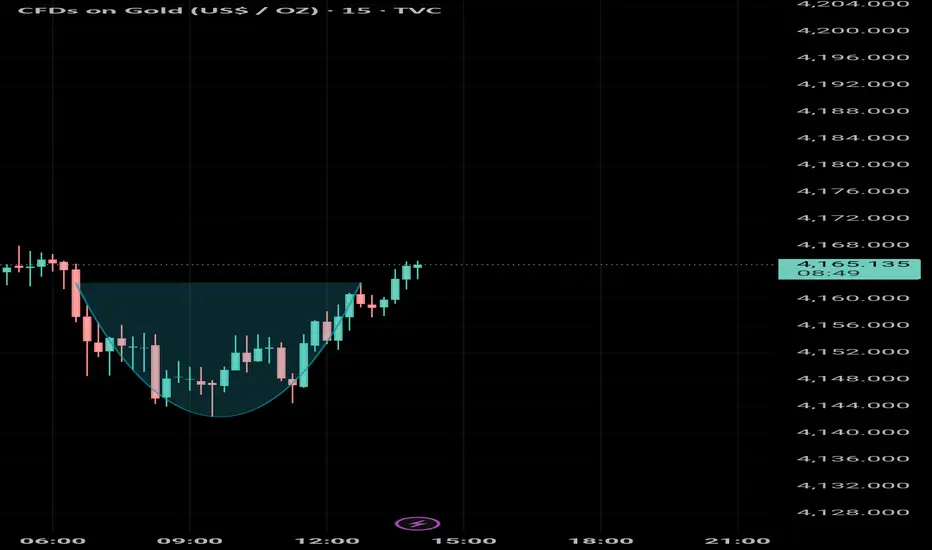
Round Bottom BreakOut Above 4162 more RISE awaited 🤞
Expected to hit :
TP 1: 4174
TP 2: 4180
TP 3: 4184+
XAU/USD: Gold Stagnates, Poised for a Strong Surge📊 Market Structure
Gold is moving in a tight accumulation phase (compression) between two important zones:
• OB Support: 4,130 – 4,126
• Resistance – Small Supply: 4,148 – 4,166
The previous trend remains a strong uptrend (clear BoS sequence from 4,089), and currently, the price is retesting the newly formed peak-bottom structure.
The BUY side is still in control as long as the price stays above:
• 4,130 – Main OB Support
• 4,104 – Discount FVG
• 4,089 – Key Low Confirming Trend
If gold holds these zones, the next targets will be the upper liquidity levels:
• 4,166
• 4,181
• 4,207
• 4,243
💎 Key Technical Zones
• OB Support 1: 4,130 – 4,126
• FVG Zone: 4,104 – 4,089 (best discount)
• Deep Bearish OB: 4,060 – 4,045 (if price drops sharply)
• Upper Liquidity Targets: 4,166 → 4,181 → 4,207 → 4,243
🎯 Trading Plan (Priority BUY)
1️⃣ BUY 1 – Retest OB 4,130
When the price touches the OB support zone 4,130 – 4,126 and shows a bounce signal (rejection / engulfing).
• Entry: 4,130 – 4,126
• SL: below 4,115
• TP1: 4,166
• TP2: 4,181
• TP3: 4,207
• TP4: 4,243
→ Quick setup, good RR, trend aligned.
2️⃣ BUY 2 – Discount FVG 4,104 – 4,089
This is the best BUY zone if the market drops sharply before rising.
• Entry: 4,104 – 4,089
• SL: 4,070
• TP1: 4,166
• TP2: 4,181
• TP3: 4,207
• TP4: 4,243
→ Strong confluence: FVG + fibo discount + key liquidity.
3️⃣ BUY 3 – Deep Accumulation at Bearish OB Shift
• Entry: 4,060 – 4,045
• SL: 4,020
• TP: 4,104 → 4,166 → 4,207
→ Only activate if “flush liquidity” appears.
🎯 SELL Scalp (secondary – not priority)
Only SELL when there is a clear rejection reaction at:
• 4,166 – first liquidity sweep zone
• 4,181 – strong reaction zone
• 4,207 – main bearish OB
• 4,243 – large liquidity peak
• SL: 10–15 USD
• TP: 4,148 → 4,130
→ For scalpers only, not a main setup.
🧠 Vincent’s View
The market structure remains completely bullish. The market is accumulating energy in a narrow range before breaking strongly to the upper liquidity targets.
As long as gold stays above 4,089 – the uptrend remains dominant.
“Patience builds the entry – liquidity completes the move.” ⚜️
⏰ Timeframe: 1H
✍️ Analysis by: Captain Vincent

Advantages of Algorithmic Trading for Retail InvestorsIntroduction
In the modern financial markets, technology has revolutionized trading, making it more accessible, efficient, and sophisticated. Algorithmic trading, often referred to as algo-trading or automated trading, is a prime example of this transformation. It involves using computer algorithms to execute trades based on predefined rules for price, volume, timing, and other market conditions. While algorithmic trading was initially the domain of institutional investors and hedge funds due to its complexity and technological requirements, retail investors are increasingly adopting these strategies. The rise of accessible trading platforms, advanced analytical tools, and educational resources has empowered individual investors to leverage algorithmic trading effectively. Understanding the advantages of algorithmic trading can help retail investors optimize their strategies, manage risk, and enhance profitability.
1. Speed and Efficiency
One of the most significant advantages of algorithmic trading for retail investors is speed. Financial markets are highly dynamic, with prices fluctuating within milliseconds. Human traders, regardless of their experience, cannot match the speed of a computer executing trades. Algorithms can instantly analyze market data, identify trading opportunities, and execute orders at the optimal price. This efficiency allows retail investors to capitalize on short-term price movements and market inefficiencies that would otherwise be missed.
Moreover, algorithmic trading reduces the impact of manual errors such as delays in order placement, incorrect entries, or missing trading signals. By automating the execution process, retail investors can achieve consistency and precision that is difficult to maintain manually.
2. Elimination of Emotional Bias
Emotions are a significant challenge for retail traders. Fear, greed, and overconfidence can lead to poor decision-making, resulting in losses. Algorithmic trading helps eliminate emotional bias by relying on pre-programmed rules. Decisions are made based on data and logic, not psychology. For instance, an algorithm can stick to a stop-loss strategy even when the market is highly volatile, preventing panic selling or impulsive buying.
This psychological discipline is crucial for retail investors who may lack the experience to manage stress during market swings. By removing emotions from trading, algorithms help investors maintain a systematic and disciplined approach, ultimately improving long-term performance.
3. Backtesting and Strategy Optimization
Another key advantage for retail investors is the ability to backtest trading strategies. Backtesting involves applying an algorithm to historical market data to evaluate its performance before deploying it in real-time markets. This allows investors to understand potential returns, risks, and drawdowns associated with a strategy.
Backtesting provides valuable insights that enable retail investors to optimize trading strategies. Algorithms can be fine-tuned to improve profitability, minimize risk, and adjust to different market conditions. This scientific and data-driven approach is particularly beneficial for retail investors, who may have limited capital and need to maximize efficiency.
4. Diversification of Trading Strategies
Algorithmic trading allows retail investors to manage multiple strategies simultaneously. Algorithms can monitor different markets, securities, and timeframes concurrently—something that is impossible for a human trader to achieve effectively. This diversification reduces overall risk and increases opportunities for profit.
For example, a retail investor can simultaneously run algorithms for trend following, mean reversion, and arbitrage strategies across equities, commodities, and forex markets. Diversification through automation ensures that an investor’s portfolio is not overly reliant on a single market or approach, thereby enhancing risk-adjusted returns.
5. Lower Transaction Costs
Contrary to popular belief, algorithmic trading can help retail investors reduce transaction costs. Algorithms can execute trades at optimal prices, taking advantage of market liquidity and minimizing slippage. High-frequency trading (HFT) algorithms, for instance, can split large orders into smaller trades to prevent price impact, ensuring the investor pays less than they might in manual trading.
Additionally, automated trading reduces the need for constant monitoring of the markets, which lowers the opportunity cost associated with manual trading. Retail investors can focus on research and strategy development rather than spending hours tracking price movements and executing trades manually.
6. Consistency in Strategy Execution
Consistency is vital for long-term trading success. Human traders often deviate from their strategies due to emotions, fatigue, or external influences. Algorithms, however, execute trades with absolute consistency according to predefined rules. This ensures that strategies are implemented exactly as intended, eliminating human error and maintaining a disciplined trading routine.
Consistency also allows retail investors to measure the performance of strategies accurately. By executing trades uniformly, investors can identify strengths and weaknesses in their approach and make informed adjustments without the noise introduced by inconsistent human behavior.
7. Access to Advanced Trading Techniques
Algorithmic trading provides retail investors with access to advanced trading techniques that were previously exclusive to institutional players. Strategies such as statistical arbitrage, pairs trading, and machine learning-based prediction models are now within reach due to modern trading platforms and affordable technology.
Retail investors can leverage algorithms to analyze large datasets, detect patterns, and execute complex strategies that would be impossible manually. This democratization of sophisticated tools levels the playing field, allowing individual traders to compete more effectively with larger institutions.
8. Risk Management and Control
Effective risk management is essential in trading, and algorithmic trading offers enhanced risk control mechanisms. Algorithms can be programmed to follow strict risk parameters, such as position sizing, stop-loss limits, and maximum daily loss thresholds. This ensures that retail investors avoid catastrophic losses and maintain capital preservation.
Moreover, algorithms can monitor multiple risk factors in real-time and adjust positions automatically. For instance, if volatility spikes, an algorithm can reduce position sizes or temporarily halt trading to prevent exposure to excessive risk. Such proactive measures are difficult to implement manually, particularly for retail investors with limited resources.
9. Time-Saving Benefits
For retail investors who balance trading with full-time jobs or other responsibilities, algorithmic trading offers significant time-saving advantages. Once a trading algorithm is developed and deployed, it can operate continuously without constant supervision. Retail investors no longer need to sit in front of screens for hours or react to every market fluctuation.
Automated trading allows investors to spend more time on research, strategy refinement, and portfolio analysis, rather than the mechanical task of order execution. This efficiency improves productivity and makes trading a more sustainable and enjoyable activity for retail participants.
10. Transparency and Record-Keeping
Algorithmic trading provides transparent and verifiable records of every trade executed. Each transaction is logged with precise time, price, and strategy details, making it easier for retail investors to track performance and audit their trading history. This transparency also aids in regulatory compliance and tax reporting.
Additionally, detailed records help investors analyze strategy effectiveness and identify patterns of success or failure. Over time, this data-driven feedback loop enables continuous improvement and more informed decision-making.
Conclusion
Algorithmic trading offers retail investors a host of advantages that were once limited to institutional players. By providing speed, efficiency, emotional discipline, strategy optimization, diversification, lower costs, and advanced techniques, algorithms empower individual traders to navigate complex financial markets more effectively. Enhanced risk management, consistent execution, and time-saving benefits further make algorithmic trading an indispensable tool for modern retail investors.
While algorithmic trading requires a learning curve, access to technology, and proper strategy development, the potential benefits far outweigh these challenges. As platforms and tools continue to evolve, retail investors are increasingly positioned to leverage algorithmic trading to achieve disciplined, efficient, and profitable trading outcomes. In a market where speed, data, and precision are critical, algorithmic trading is no longer an advantage—it is a necessity for retail investors seeking to compete at the highest level.
Gold H1 - Can Gold reject 4167 and fall to 4133 today?🟡 XAUUSD – Intraday Smart Money Plan | by Ryan_TitanTrader (27/11)
📈 Market Context
Gold is trading inside an intraday consolidation after a strong H1 displacement. The session is now primed for liquidity engineering before the next leg.
Key narrative drivers traders must respect today:
• Stronger USD expectations continue to shape risk sentiment
• Institutional desks frequently exploit sweep zones during consolidation
• Range-bound conditions favor fakeouts → displacement → expansion mechanics
• Headlines around U.S. monetary tone amplify intraday volatility
The current chart highlights balanced liquidity both above and below structure, supporting a two-way SMC playbook.
🔎 Technical Framework – Smart Money Structure (H1)
Market is holding a rising channel, but internally ranging — a typical liquidity map scenario:
• Buy-side liquidity pocket: 4180 → 4182 (premium extreme)
• Sell-side liquidity pool: 4110 → 4133 (discount extreme / origin zone)
• Internal equilibrium zone: 4150–4170 chop region (no-trade area)
We expect this sequence:
Sweep → CHoCH/BOS → Displacement → Retest → Expansion.
🎯 Trade Plans for Today
🔴SELL GOLD 4180–4182 | SL 4190
Thesis: Premium liquidity sweep above local highs before downside displacement.
Activation rules:
• Price sweeps 4182 liquidity
• Bearish CHoCH/MSS + BOS down on M5–M15
• Imbalance retest / FVG entry after structure break
Targets:
• 4167 (nearest reaction)
• 4150 (equilibrium raid)
• 4135–4133 (discount retest)
🟢 BUY GOLD 4135–4133 | SL 4125
Thesis: Sell-side liquidity sweep into the origin zone before upside impulse.
Activation rules:
• Price taps 4133 pool (sweep below structure)
• Bullish CHoCH/MSS + BOS up on M5–M15
• FVG fill / bullish rejection wick confirmation
Targets:
• 4155+
• 4167 (reclaim zone)
• 4180+ (premium raid target)
⚠️ Risk Management
• Do NOT trade inside 4150–4170 without clear displacement
• Wait for CHoCH + BOS before execution
• Treat the upper and lower zones as liquidity traps, not trend entries
• Reduce size during news spikes unless structure confirms
• SL = wave invalidation, no averaging in chop
📝 Summary
Gold is in accumulation/redistribution mode. Desks may:
• Run buy-side liquidity at 4182, then displace down → retest discount
or
• Sweep sell-side liquidity at 4133, confirm CHoCH up → expand with impulse
Today is a liquidity session, not early trend chasing. Execute only after confirmation.
📍 Follow @Ryan_TitanTrader for daily Smart Money updates.

XAUUSD Outlook: Recent Gains Have Been Quite Steady!The market outlook for XAUUSD remains clearly optimistic. The latest price movement has shown a steady recovery, pushing towards the upper boundary of the newly forecasted price channel. This presents another excellent opportunity to get involved.
The market may be in the early stages of a strong new bullish leg. We could also see some consolidation or a short-term pullback before continuing towards the upper boundary, but I believe the second scenario is more likely.
My target would be 4,350.

Bullish breakoutHello,
Silver is ready for the new High. If the fed cut the interest rate on 9th-10th of Dec. This will skyrocket and may break the all-time high.
My target will be
T1 ---> 166169
T2 ---> 172000
T3 ---> 184000
SL in Premium Group.

XAUUSD – SHORT-TERM TREND STILL UNCERTAIN, WAIT FOR PRICE TO ...XAUUSD – SHORT-TERM TREND STILL UNCERTAIN, WAIT FOR PRICE TO RETURN TO LIQUIDITY ZONES
1. Fundamental Analysis
In today’s session, gold is holding a mild pullback after touching its highest level in nearly two weeks.
Market sentiment has turned slightly more risk-on, causing capital to move away from safe-haven assets. This reduces short-term demand for gold and triggers profit-taking.
However, the Fed’s dovish expectations continue to keep the USD weak, which remains a supporting factor for gold in the medium term. Lana views the current phase mainly as a technical correction and prefers waiting for price to reach key liquidity zones before taking action.
2. Technical Analysis
On the H1 timeframe, after a strong upside move, price is slowing down and showing a confirmation of downward pressure from the upper resistance zone.
The rising trendline beneath is still holding the overall structure, suggesting the broader trend remains intact, but momentum is fading and the market is entering a more indecisive phase.
Below the price, the FVG demand zones around 4113–4111 and the deeper 4085–4088 represent liquidity areas where Lana expects buyers may step back in.
Above the price, the 4194–4196 zone is a key resistance area, aligned with supply and upper liquidity, suitable for a correction sell setup if price retests it.
3. Key Price Zones to Watch
Upper liquidity / major resistance:
• 4194 – 4196
Lower liquidity / support & FVG zones:
• 4113 – 4111: first demand zone, near the rising trendline
• 4085 – 4088: deeper FVG zone, stronger support if correction extends
4. Trade Setups
SELL: 4194 – 4196
SL: 4200
TP: 4175 – 4160 – 4122 – 4105
BUY: 4113 – 4111
SL: 4105
TP: 4133 – 4155 – 4170 – 4190
BUY: 4085 – 4088
SL: 4080
TP: 4095 – 4110 – 4133 – 4150 – 4185
👉 Follow Lana on TradingView to get the earliest gold analysis updates. 💛

Elliott Wave Analysis XAUUSD – 27/11/20251. Momentum
D1:
D1 momentum is contracting and preparing to reverse. We need to wait for today’s daily candle to close to confirm the reversal signal. If confirmed, the market may enter a downward phase lasting around 4–5 days.
H4:
H4 momentum continues to decline and is approaching the oversold zone. This indicates that the current downward move is weakening, and a corrective bounce is likely once H4 momentum reverses in the oversold area.
H1:
H1 momentum is also decreasing and moving toward the oversold zone. Therefore, we expect a mild bounce once H1 momentum turns upward.
________________________________________
2. Wave Structure
D1:
The wave structure on H4 remains unchanged from previous analysis. The key difference is that D1 momentum has now contracted and shows signs of reversal, strengthening the scenario of a continuation of the purple Y wave. The completion of this Y wave will likely align with the moment D1 momentum descends into the oversold zone and reverses.
H4:
On the H4 timeframe, the blue ABC corrective structure is close to completion, and the market is currently in the final stage of wave C.
Based on H4 momentum reversal cycles, a series of lower highs and lower lows suggests that the ABC structure is likely complete and price is in the final phase of wave Y.
H1:
On H1, a 5-wave black structure is forming. In yesterday’s analysis, I presented two scenarios and explained the characteristics of each. With D1 momentum now reversing, I am leaning toward the scenario where the 5 black waves represent the C wave of the blue structure.
Yesterday’s targets for wave 5 (black) and wave C (blue) were truncated — price only reached 4173.8 and failed to touch 4184. Since then, the market has been moving sideways within a wide range.
Key observations:
• Price rose but failed to break the 4173.8 high.
• Price later dropped near 4137.
• RSI showed bearish divergence from wave 3 (black): price made higher highs while RSI made lower highs → suggesting wave 5 likely completed as an Ending Diagonal.
At this stage, I want to see price break below 4137 before H4 momentum reverses upward. This would provide additional confirmation that the ABC corrective structure has completed.
The 4058 zone continues to be a strong liquidity area to look for sell entries under the assumption that wave 5 has finished.
________________________________________
3. Trading Plan
Sell Zone: 4158 – 4160
SL: 4178
TP1: 4081
TP2: 4020
TP3: 3958

XAUUSD BUY OR SELL TODAY?1. Main Market Context for Today
Jobless claims came in better than expected → USD strengthens, but gold did not drop — it continued to move sideways → the market is in accumulation and waiting for a breakout.
Today’s priority strategy is range trading:
Lower range: 4130–4135
Upper range: 4170–4175
Once price breaks clearly out of either range → switch to trend-following (pursuit) trading.
2. Range-Trading Plan (Primary Strategy for Today)
(A) Buy at the Lower Range – 413X Zone
Buy area: 4130–4135
SL: 100 pips
TP: 100 pips
Reason: This is the main demand zone and aligns with the ascending trendline shown on your chart.
➡️ Strategy:
Wait for price to “sweep” the lows → show confirmation → then take a quick BUY trade.
(B) Sell at the Upper Range – 417X Zone
Sell area: 4170–4175
Reason: Strong supply zone with repeated reactions.
➡️ Strategy:
Wait for a rejection candle (pin bar / bearish engulfing) → then SELL.
3. Current Reaction Zone – 414X
This is the zone price is currently testing.
Do not enter immediately; just observe:
If price bounces strongly from 414X → target is to retest 417X
If 414X breaks → price will likely retest 413X → better BUY entries there.
4. Deeper BUY Zones (If Price Breaks Downward)
Here are the levels you mentioned, organized clearly:
BUY Zone
4110–4108
4102–4100
4096–4094
→ These are deeper liquidity zones below the main range, activated only if gold breaks below 413X.
5. SELL Zones if Price Breaks Upward (Above 417X)
SELL Zone
4202–4200
4194–4190
4183–4180
→ These are upper supply retest zones, activated only after price breaks above 417X.
🟨 6. Main Scenarios for Today
Scenario 1 – Expected Sideway (Highest Probability)
Price moves within 413X – 417X, bouncing between the range limits.
→ Trade the range (scalp/intraday).
Scenario 2 – Break Below Range
If 4130 breaks → price will head to 4110 → 4100 → 4094
→ BUY at deeper zones.
Scenario 3 – Break Above Range
If 4175 breaks → price will aim for 4183 → 4194 → 4200–4202
→ SELL at higher zones.
✅ One-Line Trading Summary
Trade primarily within the 413X–417X range (buy low – sell high). If the range breaks, switch to trend-following using the deeper BUY zones or higher SELL zones provided above.

Plan the day - Trade the plan Hello traders , here is the full multi time frame analysis for this pairs, let me know in the comment section below if you have any questions , the entry will be taken only if all rules of the strategies will be satisfied. wait for more price action to develop before taking any position. I suggest you keep this pair on your watchlist and see if the rules of your strategy are satisfied.
