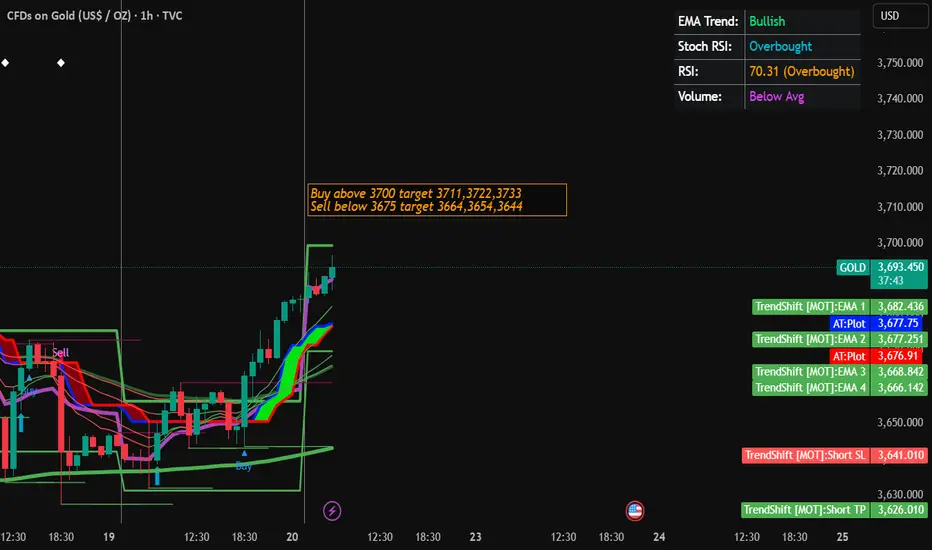
Gold Trading Strategy for 22nd September 2025GOLD TRADING STRATEGY (1-HOUR CHART)
🟢 BUY SETUP – Step by Step
🔍 Condition to Enter a Buy Trade:
Wait for a 1-hour candle to close above 3700.
Don’t rush — confirmation happens only after the candle closes, not during.
🚀 Buy Entry Point:
Place your Buy order slightly above the high of that confirmed candle.
This ensures momentum is in your favor.
🎯 Profit Targets for Buy Trade:
🎯 Target 1: 3711 → Quick intraday target.
🎯 Target 2: 3722 → Medium profit booking.
🎯 Target 3: 3733 → Extended move target.
🛑 Stop Loss (SL):
Place SL just below the breakout candle’s low.
This protects you if price reverses suddenly.
🔴 SELL SETUP – Step by Step
🔍 Condition to Enter a Sell Trade:
Wait for a 1-hour candle to close below 3675.
Confirmation is only valid after the candle closes below.
📉 Sell Entry Point:
Place your Sell order slightly below the low of that confirmed candle.
This ensures the bearish momentum is active.
🎯 Profit Targets for Sell Trade:
🎯 Target 1: 3664 → First level target.
🎯 Target 2: 3654 → Deeper decline.
🎯 Target 3: 3644 → Extended move target.
🛑 Stop Loss (SL):
Place SL just above the breakdown candle’s high.
This avoids large losses if trend reverses.
📌 Risk Management & Trading Tips
✅ Risk per trade: Never risk more than 1–2% of your capital.
✅ Position sizing: Adjust lot size according to your risk.
✅ Patience: Enter only after the 1-hour candle closes.
✅ Trail SL: Move stop loss in profit direction as price moves toward targets.
⚠️ Disclaimer
📢 This content is for educational purposes only.
📢 It is not financial advice or a guaranteed strategy.
📢 Trading in Gold and financial markets involves high risk.
📢 Always do your own analysis before taking any position.
📢 Past performance does not guarantee future results.
✨ Pro Tip: Mark levels 3700 (Buy Zone) and 3675 (Sell Zone) on your chart.
Wait for clear 1-hour candle closures before acting — this filters out false signals.
Futures market
Gold Trading Strategy for Monday✅ On Friday's US trading session, gold saw a strong upward movement and successfully broke the downward trendline on the 1-hour chart, indicating that bulls are in control of the market. The current short-term pullback is merely a correction and has not changed the overall uptrend. Due to the strong bullish momentum, the short-term pullback does not indicate a trend reversal and, in fact, provides an opportunity for buying on dips.
✅ On the 4-hour chart, gold has experienced short-term consolidation, but the overall trend remains bullish. The MACD is in a strong zone, and the KDJ indicator is still in a bullish zone, suggesting that the price may continue to rise in the short term.
In the short term, there is support around the 3660-3670 region. If the price pulls back to this level, consider buying. If the price breaks above 3685, further bullish movement can be expected.
🔴 Resistance levels: 3702-3707 / 3720-3730
🟢 Support levels: 3660-3670 / 3636-3640
✅ Trading strategy reference:
🔰 If gold price rebounds to the 3702-3705 area, consider selling in batches with a target of 3690-3680, and if broken, look for a further move to 3670.
🔰 If gold price pulls back to the 3665-3670 area, consider buying in batches with a target of 3685-3695, and if broken, look for a further move to 3705.
🔥Trading Reminder: Trading strategies are time-sensitive, and market conditions can change rapidly. Please adjust your trading plan based on real-time market conditions.

Gold Price Today: XAUUSD Sets Stage for Continued Bullish ExpansGold (XAUUSD) Market Report – September 21, 2025
Gold remains positioned near 3,685, with recent price behavior showing a structured climb despite short bursts of volatility. The market is cycling through phases of expansion and retracement, where each corrective leg has been followed by renewed upward momentum. This rhythm signals that buyers are steadily maintaining control of the broader trend.
The current setup reflects a market that is rebalancing efficiently. Short-term pullbacks are being absorbed quickly, keeping pressure aligned toward the upside. The sequence of structural shifts on the chart points to a continuation of this momentum, suggesting that higher valuations are within reach if the present flow persists.
Overall, gold’s tone is constructive, characterized by resilience and sustained demand. The pattern unfolding indicates a market preparing for further expansion, with the potential for continuation into higher ranges in the sessions ahead.

PLAN FOR SUNDAY EVENING SUNDAY TRADING CHEAT-SHEET (XAUUSD & USDJPY)
✅ General Rules
• Avoid thefirst 15–30 min of Sunday open (low liquidity, wide spreads).
• Always mark: PDH, PDL, Weekly Open, Friday Close.
• Trade only after confirmation:
Liquidity Grab → BOS/CHOCH → Retest → Conviction Candle.
• No confirmation = No trade.
• Risk ≤ 1% per trade.
⸻
🟡 GOLD (XAUUSD)
Bias: Bearish from supply unless broken.
🔻 Short Setup (preferred)
• Supply Zone: 3,693 – 3,701
• Entry: 3,695 – 3,700 (after BOS down on 3m–5m)
• SL: Above 3,710
• TP1: 3,660
• TP2: 3,640
• TP3: 3,615
🟢 Long Setup (counterplay)
• Demand Zone: 3,640 – 3,650 (deep: 3,615 – 3,630)
• Entry: After BOS up on 3m–5m
• SL: Below 3,600
• TP1: 3,670
• TP2: 3,700
• TP3: 3,720
⸻
💴 USDJPY
Bias: Range between 147.40–148.40. Short from premium, long from discount.
🔻 Short Setup (preferred)
• Supply Zone: 148.20 – 148.40
• Entry: 148.25 – 148.35 (after BOS down on 3m–5m)
• SL: Above 148.50
• TP1: 147.90
• TP2: 147.60
• TP3: 147.00
🟢 Long Setup (counterplay)
• Demand Zone: 147.40 – 147.60
• Entry: 147.45 – 147.55 (after BOS up on 3m–5m)
• SL: Below 147.20
• TP1: 147.90
• TP2: 148.20
• TP3: 148.40
⸻
⚡ Confirmation Checklist
✅ Liquidity sweep inside zone
✅ BOS / CHOCH in your favor (on 3m–5m chart)
✅ Retest OB/FVG from that BOS
✅ Conviction candle close (red near low for shorts, green near high for longs)
⸻
📌 Plan Summary:
• Gold: Watch 3,693–3,701 for shorts, 3,640–3,650 for longs.
• USDJPY: Watch 148.20–148.40 for shorts, 147.40–147.60 for longs.
• Always confirm with BOS/CHOCH before entry.

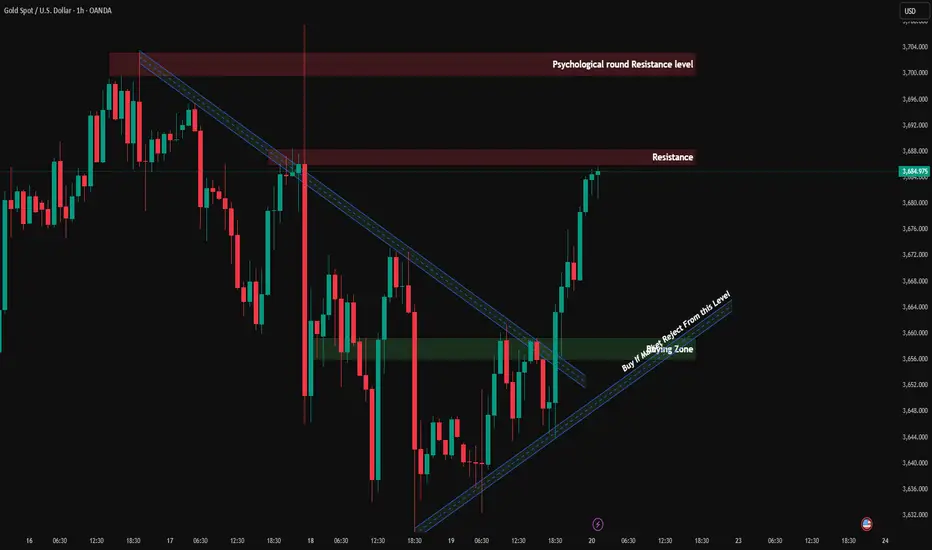
XAU/USD: Sideway or Waiting for a Breakout?Hello traders, gold is currently in a clear sideways phase , moving within a narrow trading range between support at 3,652 USD and resistance at 3,700 USD. The chart shows that gold continues to fluctuate in this area without any signs of a strong breakout.
Although there is no major immediate news impact, the recent Fed rate cut has created a slight bullish bias for gold, as it continues to be viewed as a safe-haven asset in a low-interest-rate environment. This may support gold in holding within the current range, with a slight upside potential if price stays above the 3,652 USD support level.
If gold breaks above the 3,700 USD resistance , the uptrend could continue. However, if it breaks below current support levels , the market may see a correction. We need to monitor market signals closely to determine any trend shift.

XAU/USD Technical Analysis: Major Levels, Market Structure, and 🔎 Current Snapshot
Price now: ~$3,684.98 per ounce.
Investing.com
Today’s trading range: ~$3,632.28 → $3,686.33.
Investing.com
Technical indicators (on sites like Investing.com) are showing a Strong Buy bias. Many moving averages & oscillators are in bullish territory.
⚙ Updated Key Levels (Support & Resistance)
Here are revised zones to watch, given the current price:
Immediate Resistance - $3700 Psychological round level; has been acting as near-term ceiling.
Immediate Support - $3,650 – $3,670 Zone of recent higher lows; a break below this could see more downside.
Stronger support - $3,600
Major Support Below - $3,500 – $3,550 A deeper correction zone; important in case of more aggressive downward moves.
🔄 Market Structure
Gold is in an uptrend, but there are signs of short-term weakening:
Some indicators are showing overbought conditions.
Price is consolidating just below resistance at ~$3,700 – so momentum is there, but pushing higher might require a catalyst.
On the downside, the structure holds so far — previous swings are supporting, but if support zones (like $3,650) fail, that could shift to a correction mode.
📝 Conclusion
XAU/USD is consolidating within a crucial range, balancing supply and demand forces. The dual-trendline structure signals a potential breakout in the coming sessions. Short-term traders can leverage the 5M CHoCH for early entries, while swing traders should focus on the interplay between the higher timeframe zones and trendlines.
📌 Reminder: Always wait for confirmation before entering trades and manage risk according to your trading plan.
🔔 Follow for updates! Let me know if you have any questions or want to discuss your own analysis. Happy trading! 🚀✨
PCR Trading Strategies1. Strategic Approaches to Options Trading
Options strategies can be simple or complex, depending on the trader’s risk tolerance, market outlook, and capital. These strategies are categorized into basic, intermediate, and advanced levels.
1.1. Basic Strategies
Buying Calls and Puts: Simple directional trades.
Protective Puts: Hedging against portfolio declines.
Covered Calls: Generating income from existing holdings.
1.2. Intermediate Strategies
Spreads: Simultaneous buying and selling of options to limit risk and reward.
Vertical Spread: Buying and selling options of the same type with different strike prices.
Horizontal/Calendar Spread: Exploiting differences in time decay by using options of the same strike but different expiration dates.
Diagonal Spread: Combining vertical and horizontal spreads for strategic positioning.
Collars: Combining protective puts and covered calls to limit both upside and downside.
1.3. Advanced Strategies
Iron Condor: Selling an out-of-the-money call and put while buying further OTM options to limit risk, profiting from low volatility.
Butterfly Spread: Exploiting low volatility by using three strike prices to maximize gains near the middle strike.
Ratio Spreads and Backspreads: Advanced plays to profit from skewed market expectations or strong directional moves.
2. Identifying Option Trading Opportunities
Successful options trading requires analyzing market conditions, volatility, and liquidity. Key factors include:
2.1. Market Direction and Momentum
Use technical indicators (moving averages, RSI, MACD) to gauge trends.
Trade options in alignment with market momentum for directional strategies.
2.2. Volatility Analysis
Historical Volatility (HV): Measures past price fluctuations.
Implied Volatility (IV): Market’s expectation of future volatility.
Opportunities arise when IV is underpriced (buy options) or overpriced (sell options).
2.3. Earnings and Event Plays
Companies’ earnings announcements, product launches, or macroeconomic events create volatility spikes.
Strategies like straddles or strangles are ideal to capitalize on such events.
2.4. Liquidity and Open Interest
Highly liquid options ensure tight spreads and efficient entry/exit.
Monitoring open interest helps identify support/resistance levels and market sentiment.
3. Risk Management in Options Trading
While options offer significant opportunities, risk management is crucial:
Position Sizing: Limit exposure to a small percentage of capital.
Defined-Risk Strategies: Use spreads and collars to control maximum loss.
Stop-Loss Orders: Protect against rapid adverse movements.
Diversification: Trade multiple assets or strategies to reduce concentration risk.
Implied Volatility Awareness: Avoid buying expensive options during volatility spikes unless justified by market events.

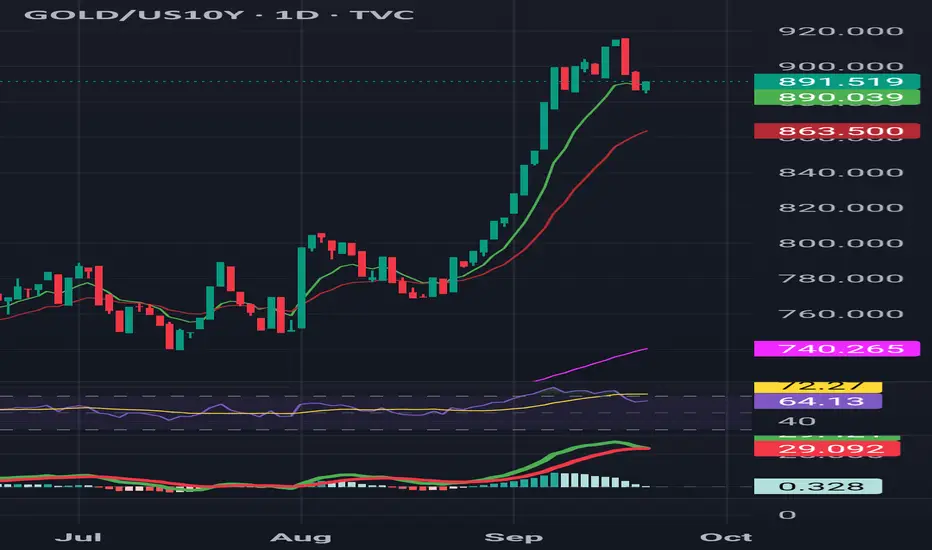
GOLD/US10Y RATIO ANALYSIS Gold vs. US 10Y yield ratio surged to extreme highs but is now showing weakening momentum. RSI has pulled back from overbought and MACD is cooling.
🔎 If this ratio rolls over, it may signal profit-taking in Gold as yields recover.
Geopolitical Risks and Their Impact on Global MarketsIntroduction
Geopolitical risks encompass a broad spectrum of political, economic, and military events that can disrupt the global economic landscape. These risks, ranging from armed conflicts and trade wars to policy shifts and regime changes, have profound implications for financial markets, investment strategies, and economic stability. Understanding the nature of these risks and their potential impacts is crucial for investors, policymakers, and businesses operating in an increasingly interconnected world.
1. Nature and Sources of Geopolitical Risks
Geopolitical risks arise from various sources, each with unique characteristics and potential consequences:
Armed Conflicts and Wars: Military engagements, such as the ongoing Russia-Ukraine conflict, can lead to significant disruptions in global supply chains, especially in energy and commodities markets. For instance, attacks on critical infrastructure can cause immediate price spikes and long-term supply shortages.
Trade Wars and Sanctions: Economic measures like tariffs, export controls, and sanctions can alter trade flows and affect the profitability of multinational corporations. The U.S.-China trade tensions are a prime example, influencing global supply chains and market sentiments.
Political Instability and Regime Changes: Shifts in political power, especially in key economies, can lead to policy uncertainties that affect investor confidence and market stability. Changes in leadership can result in abrupt policy shifts, impacting sectors such as energy, finance, and technology.
Cybersecurity Threats: Increasing reliance on digital infrastructure makes economies vulnerable to cyberattacks, which can disrupt financial systems, trade, and national security.
Environmental and Resource Conflicts: Competition for scarce resources, exacerbated by climate change, can lead to geopolitical tensions, particularly in regions dependent on natural resources.
2. Mechanisms of Market Impact
Geopolitical events influence markets through several channels:
Market Volatility: Uncertainty surrounding geopolitical events can lead to increased volatility in stock and bond markets. Investors often react swiftly to news, leading to sharp price movements.
Commodity Price Fluctuations: Conflicts in resource-rich regions can disrupt supply chains, leading to price increases in commodities like oil, gas, and metals. For example, tensions in the Middle East often result in spikes in oil prices due to concerns over supply disruptions.
Currency Instability: Geopolitical risks can affect investor confidence in a country's currency, leading to depreciation or volatility. Countries directly involved in conflicts may see their currencies weaken due to capital outflows.
Capital Flows and Investment Patterns: Heightened risks can lead to shifts in investment strategies, with investors seeking safe-haven assets like gold, government bonds, or stable currencies. Emerging markets may experience capital outflows as investors seek safer investments.
Supply Chain Disruptions: Conflicts and trade restrictions can interrupt the flow of goods and services, leading to shortages and increased costs for businesses and consumers.
3. Case Studies of Geopolitical Events and Market Reactions
Russia-Ukraine Conflict: The invasion of Ukraine by Russia in 2022 led to significant disruptions in global energy markets. Sanctions imposed on Russia resulted in soaring oil and gas prices, affecting global inflation rates and energy security.
U.S.-China Trade War: The imposition of tariffs between the U.S. and China in 2018-2019 disrupted global supply chains, affecting industries from electronics to agriculture. Markets experienced heightened volatility as investors adjusted to the changing trade landscape.
Brexit: The United Kingdom's decision to leave the European Union introduced uncertainties regarding trade agreements, regulatory standards, and economic relations, leading to fluctuations in the British pound and stock market volatility.
Middle East Tensions: Periodic conflicts and tensions in the Middle East, particularly involving Iran, have led to spikes in oil prices due to concerns over supply disruptions, impacting global markets.
4. Quantifying Geopolitical Risk
Measuring geopolitical risk is challenging due to its multifaceted nature. However, several indices and models have been developed to assess and quantify these risks:
Geopolitical Risk Index (GPR): Developed by Caldara and Iacoviello (2022), this index quantifies geopolitical tensions based on news coverage and policy uncertainty. It provides a historical perspective on the frequency and intensity of geopolitical events.
BlackRock Geopolitical Risk Indicator (BGRI): This indicator tracks market attention to geopolitical risks by analyzing brokerage reports and financial news stories. It helps investors gauge the level of concern in the market regarding specific geopolitical events.
Market-Driven Scenarios (MDS): Employed by institutions like BlackRock, MDS frameworks estimate the potential impact of geopolitical events on global assets by analyzing historical parallels and expert insights.
5. Investor Strategies in the Face of Geopolitical Risks
Investors can adopt several strategies to mitigate the impact of geopolitical risks:
Diversification: Spreading investments across various asset classes, sectors, and geographies can reduce exposure to specific geopolitical events.
Hedging: Utilizing financial instruments like options, futures, and currency swaps can help protect portfolios from adverse market movements.
Focus on Fundamentals: Investing in companies with strong fundamentals, such as robust balance sheets and resilient business models, can provide stability during turbulent times.
Monitoring Geopolitical Developments: Staying informed about global events and understanding their potential implications can help investors make timely and informed decisions.
Scenario Planning: Developing and regularly updating risk scenarios can prepare investors for potential geopolitical shocks and guide strategic responses.
6. Implications for Policymakers and Businesses
Policymakers and businesses must recognize the significance of geopolitical risks and take proactive measures:
Policy Formulation: Governments should develop policies that enhance economic resilience, promote diversification, and reduce dependence on volatile regions.
Crisis Management Plans: Establishing frameworks to respond to geopolitical crises can help mitigate their impact on national security and economic stability.
Public-Private Collaboration: Cooperation between governments and businesses can lead to more effective risk management strategies and resource allocation during crises.
Investment in Technology and Infrastructure: Strengthening digital infrastructure and cybersecurity can reduce vulnerabilities to cyber threats and enhance economic resilience.
Conclusion
Geopolitical risks are an inherent aspect of the global economic landscape, with the potential to influence markets, investment strategies, and economic policies. While these risks cannot be entirely eliminated, understanding their sources, mechanisms, and potential impacts allows investors, businesses, and policymakers to develop strategies to mitigate their effects. By adopting proactive risk management approaches and staying informed about global developments, stakeholders can navigate the complexities of geopolitical risks and maintain stability in an interconnected world.
Futures & Hedging Techniques1. Understanding Futures Contracts
1.1 Definition and Basics
A futures contract is a standardized agreement between two parties to buy or sell an underlying asset at a predetermined price on a specific future date. Futures are traded on regulated exchanges and cover a wide range of assets, including commodities (oil, gold, wheat), financial instruments (bonds, stock indices), and currencies.
Key characteristics:
Standardization: Contract size, expiration date, and quality of the underlying asset are predefined.
Leverage: Futures allow traders to control a large position with a relatively small margin, magnifying both gains and losses.
Obligation: Unlike options, both parties are obligated to fulfill the contract unless it is closed before expiration.
1.2 Types of Futures Contracts
Futures contracts can be broadly classified into:
Commodity Futures: Contracts for physical goods like crude oil, natural gas, metals, or agricultural products.
Financial Futures: Contracts based on financial instruments such as stock indices (e.g., S&P 500), government bonds, or currencies.
Currency Futures: Agreements to exchange a specific amount of one currency for another at a future date.
Interest Rate Futures: Contracts based on the future level of interest rates, often used to hedge bond positions.
2. The Concept of Hedging
2.1 What is Hedging?
Hedging is a risk management strategy used to offset potential losses in an investment by taking an opposite position in a related asset. It acts as a financial "insurance policy," protecting against price volatility.
Example:
A wheat farmer expects to harvest 10,000 bushels in three months. To protect against a price drop, he sells wheat futures. If prices fall, gains from the futures contract offset losses in the cash market.
2.2 Hedging vs. Speculation
Hedgers: Aim to reduce risk and protect profit margins.
Speculators: Take on risk to profit from price movements.
Hedgers use futures primarily, while speculators are attracted to leverage and profit potential.
3. Hedging Techniques
3.1 Long Hedge
A long hedge is used when an investor or business anticipates purchasing an asset in the future and wants to protect against price increases. It involves buying futures contracts.
Example:
An airline company expects to buy jet fuel in three months. To hedge against rising fuel prices, it buys fuel futures. If fuel prices increase, gains from the futures offset higher cash market costs.
3.2 Short Hedge
A short hedge is applied when the investor or business owns the asset and wants protection against price declines. It involves selling futures contracts.
Example:
A farmer expecting to sell corn in six months may sell corn futures. If market prices drop, gains from futures contracts compensate for lower cash sales prices.
3.3 Cross Hedging
Cross hedging occurs when the exact underlying asset is not available for hedging, so a related asset's futures contract is used. This method carries basis risk, as the hedge may not perfectly offset price changes.
Example:
A steel manufacturer might use iron ore futures to hedge against steel price fluctuations when no steel futures are available.
3.4 Rolling Hedges
Futures contracts have expiration dates. To maintain continuous hedging, traders roll over contracts from a near-month to a later-month contract, locking in protection over a longer horizon.
4. Advanced Hedging Strategies
4.1 Delta Hedging
Primarily used in options trading, delta hedging involves adjusting positions to remain neutral against price movements of the underlying asset. Though complex, it can minimize directional risk.
4.2 Ratio Hedging
This involves using a proportionate number of futures contracts to hedge a position. Over-hedging or under-hedging can be applied based on risk appetite.
4.3 Hedging with Options on Futures
Options provide asymmetric protection:
Buying put options hedges against price declines.
Buying call options hedges against price increases.
This approach limits losses while retaining upside potential.
5. Real-World Applications of Futures and Hedging
5.1 Commodities
Agriculture: Farmers hedge crops to lock in prices and stabilize income.
Energy: Airlines and utilities hedge oil, gas, and electricity prices to manage operational costs.
Metals: Industrial manufacturers hedge metals like copper and aluminum to control production expenses.
5.2 Financial Markets
Equities: Portfolio managers hedge against market downturns using index futures.
Interest Rates: Banks hedge bond portfolios against interest rate fluctuations using Treasury futures.
Currency Exposure: Multinational companies hedge foreign currency transactions to mitigate exchange rate risk.
5.3 Corporate Finance
Corporations employ hedging to:
Protect profit margins.
Secure predictable cash flows.
Reduce volatility in earnings reports.
6. Advantages and Limitations
6.1 Advantages
Risk Management: Reduces exposure to adverse price movements.
Liquidity: Futures markets are highly liquid.
Price Discovery: Transparent pricing aids decision-making.
Standardization: Contracts are uniform and regulated.
6.2 Limitations
Basis Risk: Imperfect hedging can leave residual risk.
Margin Calls: Leverage can lead to unexpected losses.
Market Volatility: Extreme events may cause margin strain.
Complexity: Advanced hedging requires financial expertise.
7. Practical Tips for Effective Hedging
Identify Exposures: Determine what risks need hedging—commodity prices, interest rates, currencies.
Choose the Right Instrument: Use futures, options, or combinations to optimize coverage.
Calculate Hedge Ratios: Apply statistical methods for precision.
Monitor Positions: Markets are dynamic; regular evaluation is critical.
Understand Costs: Consider transaction costs, margin requirements, and potential losses.
8. Case Studies
Case Study 1: Airline Fuel Hedge
A major airline facing volatile fuel prices purchased crude oil futures. When prices surged 12% in three months, the gains from futures offset the higher fuel costs, stabilizing operational expenses.
Case Study 2: Wheat Farmer
A farmer expecting to sell wheat in 90 days sold futures contracts. Prices fell by 8%, but the futures gain neutralized losses, ensuring predictable revenue.
Case Study 3: Multinational Corporation
A tech firm receiving payments in euros hedged using currency futures. Adverse EUR/USD fluctuations could have reduced earnings, but gains from futures mitigated the impact.
9. Emerging Trends in Futures and Hedging
Algorithmic Hedging: AI and quantitative models optimize hedge ratios in real-time.
ESG Hedging: Companies hedge exposure to carbon credits or renewable energy costs.
Cryptocurrency Futures: Digital assets now offer hedging tools for crypto portfolios.
Globalization: Increasing cross-border trade creates diverse hedging needs in multiple currencies and commodities.
10. Conclusion
Futures and hedging techniques are indispensable tools in modern finance. They allow market participants to manage risk, protect profits, and plan for uncertainties. While futures provide standardized, leveraged instruments for price speculation and risk management, hedging techniques enable businesses and investors to achieve stability amid market volatility.
Mastering these concepts requires a combination of theoretical knowledge, practical experience, and an understanding of market behavior. With careful planning, risk assessment, and strategy execution, futures and hedging can transform uncertainty into a manageable, predictable component of financial decision-making.

XAUUSD – The Decisive Zone and Trading ScenariosTechnical Analysis
Gold prices on the H4 chart are in a recovery phase after retesting the support at 3,661–3,662. The latest candle has rebounded strongly to the 3,684 zone, yet the structure still indicates a clear tug-of-war.
The upward trendline was breached in the previous decline, and currently, the price is retracing to test this area again. This is a crucial point to determine whether the short-term uptrend will continue.
The Fair Value Gap (FVG) formed around the 3,613–3,626 zone, along with the Fibonacci extension, becomes a point of interest for deeper pullbacks.
The Volume Profile indicates the main Point of Control (POC) lies lower, around 3,551, a potential target for gold to revisit if selling pressure increases.
The RSI (14) is at ~59, leaning towards the buyers but hasn't crossed into the overbought territory → the current momentum is more of a recovery rather than a sustainable uptrend.
Trading Scenarios
Scenario 1 – Buy following the short-term trend:
Entry: wait for a retest at 3,673–3,662
SL: below 3,655
TP1: 3,690–3,700
TP2: 3,708–3,715 (2.0–2.618 Fib extension)
Scenario 2 – Short sell after confirmed failure:
If the price fails to hold above 3,661 and there is a reversal signal on H4, consider selling.
Entry: 3,661–3,650 (after confirmation candle)
SL: above 3,673
TP1: 3,626–3,613 (FVG + support)
TP2: 3,579
TP3: 3,551 (POC Volume Profile)
Key Price Levels to Watch
3,708–3,715: extended resistance zone, Fibonacci confluence, important target for buyers.
3,661–3,662: short-term support, the boundary to determine the next trend.
3,613–3,626: FVG + intermediate support, a zone prone to reactions.
3,551: volume POC, a deeper target if the market breaks all support.
I will apply the long-term trading scenario in the new week, give me a follow for motivation to write more!

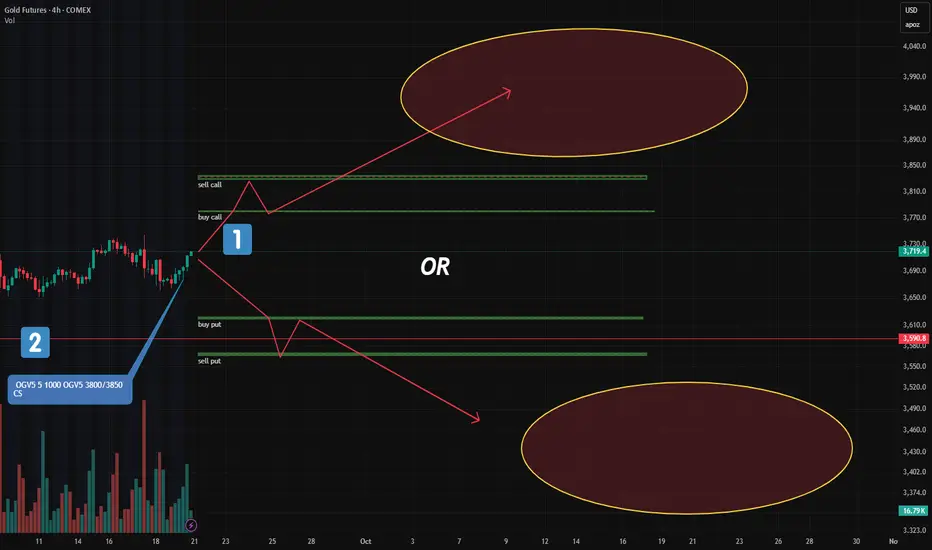
Gold: Major New Option Portfolios Signal Strong Moves AheadFriday’s CME report showed a surge in large option blocks in gold — two of them stand out.
🔹 1. "Long Condor" on December Futures (GCZ24)
This is the most significant structure added:
Targets a move below $3,620 or above $3,780
In other words: a breakout is expected, not consolidation
📌 Key point:
A "Long Condor" profits from volatility, not direction.
It wins if price moves sharply — up OR down — but loses if it stays flat.
🔹 2. Bull Call Spread (Oct Series): $3800–$3850
Another key play:
A classic bullish call spread at 3800/3850
Target: upside beyond current levels
But here’s the difference:
Unlike the "Long Condor", this one needs a clear upward move — and soon. Within a few days.
This isn’t about volatility.
It’s a directional bet that gold will rise.
🧠 Bottom Line:
One portfolio says: "Breakout coming — no matter which way."
Another says: "Gold goes up — and soon."
Are they aligned?
Contradictory?
Or could both win?
Trade smarter, not harder! Looking to boost your profits with valuable market insights and data-driven entry points? Join us or keep moving!
LiamTrading – Long-Term Trend for XAUUSD is Taking ShapeGold continues its robust upward momentum, currently trading around 3,680 – 3,685. After a series of consecutive bullish candles, the price is showing signs of consolidation and slight adjustment, paving the way for crucial scenarios in the upcoming phase.
Technical Analysis
On the Daily chart, the RSI has surpassed the 70 mark, indicating an overbought condition. This is often an early warning sign for a potential correction.
The price structure suggests that the FVG zone of 3,630 – 3,600 will be the first observation point if a short-term correction occurs.
A stronger support zone lies at 3,510 – 3,475, coinciding with Fibonacci levels 0.5 – 0.382, and also the previous resistance area that has been broken. This is considered a potential long-term 'Buy zone'.
If the correction completes, gold has the potential to return to its upward trend with a further target around 3,800 (Fibonacci extension levels 2.618 – 3.618).
Trading Scenarios
Short-term: Monitor the reaction at 3,630 – 3,600. If it holds, there might be a short recovery.
The price area around 3552-3562 should be watched for reactions.
Medium-term: Wait for the price to test the 3,500 – 3,475 zone to find more sustainable buying opportunities.
Long-term: The major trend still leans towards an increase, with an expected target towards 3,800.
This is my personal view on XAUUSD, and you can consider it to build your own plan. If you find it useful, follow me for the latest updates on gold's upcoming scenarios.

XAUUSD – Strong Resistance at 3760–3770 Await ConfirmationHello trader,
Gold continues to fluctuate within the accumulation zone after the recent recovery. Although the larger trend leans towards an increase, a clear confirmation at key resistance-support levels is needed for a stronger breakout.
Strong Resistance: 3760 – 3770, converging with the Fibonacci extension zone. This is a crucial level if the price aims to create a new ATH in the mid-term.
Key level Sell: 3685 – 3695, currently a short-term resistance zone. If the price fails to break through, gold may face downward pressure.
Important Support:
3564 – 3574: mid-term support.
3534 – 3540: deep support zone, aligning with previous liquidity.
MACD H4: Histogram remains weak, momentum is unclear → the market needs further confirmation to clearly define the trend.
Trading Scenario
Bullish Scenario
Condition: Price breaks above 3695 and holds.
Entry: Retest 3665 – 3668.
Target: 3680-3698-3715-3730 – 3760 – 3770.
Extension: If successfully surpassing 3770 → expect a move towards 3800+.
Bearish Scenario
Condition: Price fails at 3695 and reverses.
Entry: Sell at 3685 – 3695 zone upon rejection signal.
Target: 3672-3655-3635 – 3600 – 3574.
Extension: If breaking 3574, the decline may target 3540, or even deeper.
Mid-term Scenario
Price may retest 3534 – 3550 to gather liquidity, then rebound following the larger trend. This will be an attractive long-term Buy zone.
The gold market is at a crucial stage: buyers need to break 3695 to confirm the uptrend, while sellers still have opportunities at the short-term resistance zone. Deep support levels will continue to serve as a foundation for mid-term Buy strategies.
Keep a close watch on 3695 and 3760 – 3770 to determine the next direction.
Stay tuned for the latest scenarios as the price structure evolves.

Near month end - Poor RR on upside, scope for profit takingAs we approach the final week of September, it’s worth noting that Nifty has witnessed a strong rally through the first three weeks of the month. Going into the coming week and the remainder of the month, the risk–reward on the upside appears limited. This raises the possibility of profit-taking and a potential mean reversion toward lower levels. In such a scenario, key support zones to watch would include previous monthly highs and other established support levels.

Gold Hits New Record: Should You Buy or Sell in This Hot Market?Namaste traders,
This past week, gold surprised everyone by closing strong. On Friday (19/09), it moved higher again, marking its 5th consecutive weekly gain at $3,683.24/oz, while futures touched $3,718.50/oz. This surge followed the Fed’s rate cut, which many thought would cool the yellow metal. So, is this a genuine rally or just a bull trap?
Fundamentals: Rate Cut Pushes Gold Higher
Lower interest rates reduce the cost of holding gold.
Fed’s dovish signals raised expectations for more easing.
In India, physical gold demand is at a 10-month high, while China also shows strong appetite despite higher prices.
Technical Outlook
Gold broke its downward trendline, signaling bullish continuation. Buyers are in control.
This Week’s View: Focus on buying near-term targets at $372x and $373x, but stay alert to macro news.
Trading Setups (with strict risk management):
Buy Scalp: $3671–$3669 | SL: $3666 | TP: $3674–$3694
Buy Zone: $3657–$3659 | SL: $3647 | TP: $3669–$3709
Sell Scalp: $3713–$3715 | SL: $3719 | TP: $3705–$3785
Sell Zone: $3731–$3733 | SL: $3741 | TP: $3723–$3683
Will gold shine brighter and set another all-time high? Share your view! 👇

Part 8 Trading Master Class1. Introduction to Option Trading
Financial markets are constantly evolving, offering traders and investors a wide variety of tools to manage risk, speculate on price movements, or generate income. One of the most fascinating and versatile financial instruments is the option.
Unlike buying a share of a company directly, which gives you ownership, an option gives you rights, not obligations. This small distinction makes options powerful. They can amplify profits, reduce risks, and allow traders to play multiple angles of the market.
Option trading might sound complicated at first, but once you understand the foundation, it’s like learning a new language – everything starts connecting.
2. The Basics: What Are Options?
An option is a contract between two parties – a buyer and a seller – that gives the buyer the right, but not the obligation, to buy or sell an underlying asset at a predetermined price within a set time frame.
The underlying asset could be a stock, an index, a commodity (like gold or crude oil), or even currencies.
The predetermined price is called the strike price.
The time frame is defined by the expiry date.
In simple words:
Options are like a reservation ticket. You pay a small amount now (premium) to lock in the ability to buy/sell later, but you don’t have to use it if you don’t want to.
3. Types of Options: Call and Put
There are two main types:
Call Option: Gives the buyer the right to buy the underlying asset at the strike price.
Example: You buy a call option for Reliance at ₹2500. If Reliance goes to ₹2700, you can still buy it at ₹2500, making profit.
Put Option: Gives the buyer the right to sell the underlying asset at the strike price.
Example: You buy a put option for Infosys at ₹1500. If Infosys falls to ₹1300, you can still sell it at ₹1500.
Think of calls as a bet on prices going up, and puts as a bet on prices going down.
4. Key Terminologies in Options
To understand option trading, you must master its unique vocabulary:
Strike Price: The pre-agreed price at which you can buy/sell the underlying.
Expiry Date: The date on which the option contract expires.
Premium: The price you pay to buy the option.
In-the-Money (ITM): Option has intrinsic value. (E.g., stock is above strike for calls, below strike for puts).
Out-of-the-Money (OTM): Option has no intrinsic value.
At-the-Money (ATM): Stock price and strike price are nearly the same.
Option Writer: The seller of the option, who takes the opposite side.
Lot Size: The minimum quantity you can trade in an option contract.

XAU/USD – Captain Vincent Weekly Plan🔎 Captain’s Log – Context
📈 Main Trend : Strong uptrend after BoS.
📊 Price moving sideways within the rising channel, staying below Weak High 3674 .
📌 EMA 50 > EMA 200 → bullish trend remains solid.
🎯 Captain’s Map – Trading Scenarios
1️⃣ Golden Harbor (BUY – Main Priority)
🎯 Entry:
FVG Dock: 3602 – 3593
FVG Deep: 3567 – 3560
OB Harbor: 3535 – 3540
⛔ SL: below 3520
✅ TP1: 3674 (sweep Weak High)
✅ TP2: 3720 – 3740
2️⃣ Quick Boarding (Short-term SELL – Counter-trend)
Condition: If price breaks 3674 first → watch for false break.
🎯 Entry: 3670 – 3680
✅ TP: back to 3602 – 3567
⚠️ Note : scalp only, don’t hold long.
3️⃣ Storm Breaker Alert (Bearish Scenario)
If 3535 breaks → short-term uptrend invalidated.
🎯 Bearish target: 3480 – 3500
Captain’s Note ⚓
“The golden sail still catches the wind after BoS, leading the captain and crew on the bullish tide. Golden Harbor 🏝️ (3593 – 3560 – 3535) remains the preferred docking point to load cargo and continue the voyage. Quick Boarding 🚤 at Storm Breaker 🌊 (3670 – 3680) is only a short ride when the ship sweeps liquidity at Weak High 3674 . Should 3535 break, the ship might be dragged toward 3480 – 3500, but as long as it anchors at Golden Harbor, the grand journey still heads north toward 3720+.”

Gold Market Analysis: September 20, 2025Gold (XAU/USD) continues its remarkable bullish run in 2025, driven by persistent geopolitical tensions, central bank buying, a weakening US dollar, and expectations of further Federal Reserve rate cuts. As of today, the spot price stands at approximately $3,685 per ounce, marking a 1.06% increase from the previous day and a staggering 40.47% year-over-year gain. This follows a 26% rise in the first half of the year and nearly 41% year-to-date, with the metal recently touching an all-time high near $3,707 earlier this month. The market remains in a structural uptrend, though short-term volatility—exacerbated by the recent FOMC meeting—has led to some profit-taking and consolidation.
Technical Analysis
Gold's chart on the daily and H1 timeframes shows a bullish bias, with the price trading above key moving averages (50-day MA at $3,520 and 200-day MA at $3,200). The recent pullback from $3,707 appears corrective, testing demand zones around $3,638-$3,644 where buyers stepped in aggressively.Key Support Levels:Immediate: $3,644–$3,638 (recent demand zone; strong buying interest here).
Long term Support and resistance
Support : $3,525–$3,580
Key Resistance Levels: $3,900 - $4,000
Trend Bullish
~~ Disclaimer ~~
This analysis is based on recent technical data and market sentiment from web sources. It is for informational \ educational purposes only and not financial advice. Trading involves high risks, and past performance does not guarantee future results. Always conduct your own research or consult a SEBI-registered advisor before trading.
# Boost and comment will be highly appreciated.
XAUUSD - Flag PatternWhats your take on Guys.
#Institutions Consolidation going on - #Accumulation or #Distribution.
Kind of #Triangle #pattern in formation, ##Flagpattern. DO your analysis, Enter trade on Breakout and confirmation side. Trade with #confluence. i would say accumulate at bottom of pattern with SL and Participate in full swing before #Breakout.

GOLD – Breakout / Swept High – Where to BUY?1. Market Overview
Gold prices are consolidating around 3655 – 3660 after showing a short-term bearish structure.
On the H1 chart, we can see clear supply and demand zones:
• Liquidity Buy Zone near 3640 (potential demand area).
• Imbalance / Supply Zone around 3670 – 3680.
The broader higher-timeframe trend is still bullish, but in the near term the market is retesting liquidity levels.
________________________________________
2. Key Levels & Zones
• Liquidity Buy Zone: 3640 – 3645 → important support.
• Sell Scalp Zone / Imbalance: 3670 – 3680 → short-term resistance.
• Higher High Target (HH): 3700 – 3710 → strong higher-timeframe resistance.
• Long-term Support: 3620 – 3630.
________________________________________
3. Main Trading Scenarios
🟢 Long Setup (with trend)
• Wait for price to revisit the Liquidity Buy Zone (3640 – 3645).
• If bullish reversal signals appear (pin bar, engulfing candle, etc.), consider entering a Long position.
🎯 Targets:
• Short-term: 3678 (trendline break retest).
• Mid-term: 3700 – 3710 (higher high).
🔴 Short Setup (scalp only)
• If price pushes into the Sell Scalp Zone (3670 – 3680) and faces strong rejection → take a Short scalp.
• 🎯 Target: 3640 – 3645.
⚠ Note: Shorts go against the main bullish trend, so they should be managed quickly and not held for long.
________________________________________
4. Trade Management Notes
• Focus on Long trades near support, as higher timeframe bias is still bullish.
• Short positions should only be taken as scalp setups near resistance.
• Risk control: limit risk to 1–2% per trade, avoid holding trades against the main trend.
________________________________________
📌 Conclusion
Gold (XAUUSD) is currently testing the descending trendline and resistance zone.
• A successful breakout may lead price towards 3700+.
• Otherwise, the market is likely to dip back into 3640 before starting the next bullish leg.

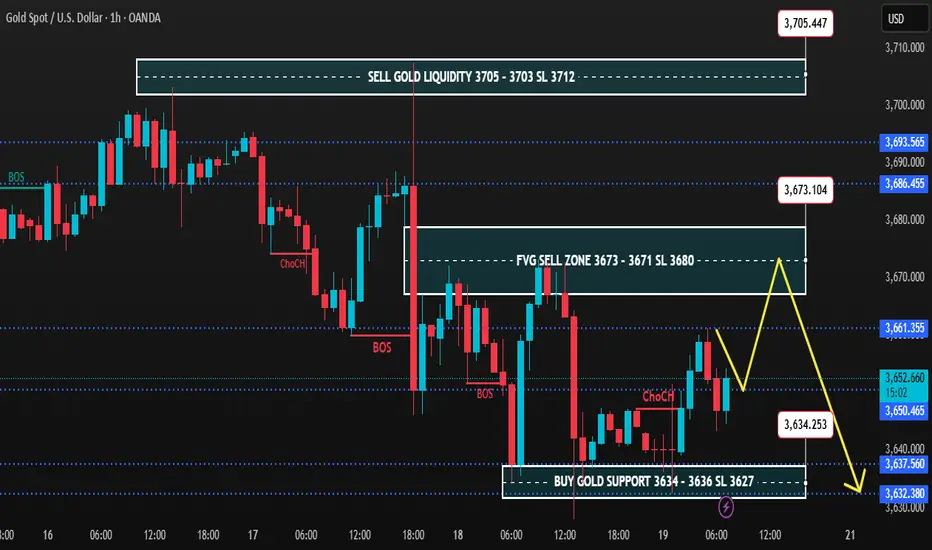
Gold 1H – Risk of Premium Sweeps Before ReversalOn the 1H timeframe, gold is consolidating after consecutive BOS and ChoCH signals, showing rejection from premium levels. The market is oscillating between the fresh FVG sell zone at 3,673–3,671 and the deep discount support at 3,634–3,636. Liquidity remains positioned above 3,705 and below 3,632, keeping scope for engineered sweeps before a clearer directional move emerges.
________________________________________
📌 Key Structure & Liquidity Zones (1H):
• 🔴 FVG SELL ZONE 3,673 – 3,671 (SL 3,680)
Premium intraday pocket for rejection, targeting 3,660 → 3,650 → 3,640.
• 🔴 SELL GOLD LIQUIDITY 3,705 – 3,703 (SL 3,712)
Major premium liquidity trap, likely to precede continuation lower towards 3,690 → 3,675 → 3,660.
• 🟢 BUY GOLD SUPPORT 3,634 – 3,636 (SL 3,627)
Discount demand zone, aiming for recovery towards 3,645 → 3,660 → 3,670 if defended.
________________________________________
📊 Trading Ideas (Scenario-Based):
🔻 Sell Setup – FVG Rejection (3,673–3,671)
• Entry: 3,673 – 3,671
• Stop Loss: 3,680
• Targets:
TP1: 3,660
TP2: 3,650
TP3: 3,640
👉 Expect engineered liquidity grab into the FVG before downside extension.
🔻 Sell Setup – Premium Liquidity Sweep (3,705–3,703)
• Entry: 3,705 – 3,703
• Stop Loss: 3,712
• Targets:
TP1: 3,690
TP2: 3,675
TP3: 3,660
👉 Smart money may sweep highs near 3,705 before resuming bearish leg.
🔺 Buy Setup – Discount Reversal (3,634–3,636)
• Entry: 3,634 – 3,636
• Stop Loss: 3,627
• Targets:
TP1: 3,645
TP2: 3,660
TP3: 3,670
👉 High risk-reward opportunity if gold defends discount demand; suitable for counter-trend scalps.
________________________________________
🔑 Strategy Note
Gold remains under pressure below 3,673–3,705, favouring short setups into premium sweeps. However, close attention is needed at 3,634–3,636, as buyers may attempt to accumulate and reclaim structure. Best practice: trade smaller lots until the New York session provides confirmation of direction.
XAUUSD Forecast – Gold Price Action and Market InsightsXAUUSD Forecast – Gold Price Action and Market Insights
Gold is showing signs of stabilization after recent fluctuations, with price consolidating around the mid-range levels. The chart highlights repeated sequences of structural breaks and shifts, indicating that liquidity has been actively swept on both the buy and sell side.
The latest market move shows a controlled decline, followed by an attempt to absorb selling pressure. Current positioning suggests the possibility of a short-term liquidity grab to the downside, which could fuel a stronger recovery leg in the sessions ahead.
The projected outlook favors a scenario where buyers regain momentum, aiming to retest the upper price zones. If this momentum develops, the market may establish a renewed upward leg in alignment with the broader bullish cycle observed across higher timeframes.
From a macro perspective, gold continues to be supported by demand for safe-haven assets amid ongoing global financial uncertainty and shifting monetary policies. This backdrop enhances the probability of gold sustaining its mid-term bullish trajectory despite temporary corrective phases.
