Gold XAUUSD feeling exhausted start sell on rise Gold sell on rise until recent high high 3705 not break and sustain above, profit booking will come , if break 3615 then short term downtrend will start , 3560, 3515 ,3480 downside target
Avoid any buy trade at current price risk of trapping on buy side at top
Futures market

Today's Gold Price: Short at HighsToday's Gold Price: Short at Highs
In the coming days, every rise in gold prices will be an opportunity for selling pressure, so consider shorting at high levels whenever possible.
As shown in Figure 2h:
1: Gold prices are testing macroeconomic support levels, with the strongest support currently in the 3635-3640 range.
2: Once this range is broken, gold prices will continue to fluctuate downward, testing support in the 3600-3620 range.
3: Due to a lack of policy and news stimulus, gold prices are unlikely to break new highs again this week.
4: Friday's trend will continue to fluctuate, with the range between 3620-3675.
5: Based on key support and resistance levels, the trading strategy is: short at highs and long at lows.
6: Support + Resistance Levels: 3600/3620/3635/3650/3660/3675/3700
7: Macro Trading Strategy:
Buy: 3620-3635
Stop Loss: 3615
Target: 3660
Sell: 3660-3675
Stop Loss: 3680
Target: 3620
8: Every subsequent rise in gold prices is likely the result of selling pressure. Therefore, whenever gold prices rise, shorting at high levels and following the trend is the most reliable strategy this Friday.

Gold holds firm at 3,63x | Caution for Friday session🟡 XAU/USD – 19/09 | Captain Vincent ⚓
🔎 Captain’s Log – Market Context
FED : Probability of a 25bps cut in October is 91.9%, while holding rates is only 8.9% → almost certain FED will continue easing.
US News : No major data today, market remains quiet.
Gold : Sharp moves in Asia session, but support 3,632 – 3,630 held strong.
Yesterday’s Buy at 3,62x delivered 200 pips , confirming this zone as a “fortress” support.
Note : Today is Friday – end of the week session, unexpected volatility may occur before the weekly close → strict risk management required.
⏩ Captain’s Summary : Gold remains bullish, but caution is needed with end-of-week swings. Golden Harbor around 3,63x continues to be a solid anchor.
📈 Captain’s Chart – Technical Analysis
Storm Breaker (Resistance / Sell Zone)
3,661 – 3,663 (intraday resistance)
3,683 – 3,685 (strong OB, likely profit-taking zone)
Golden Harbor (Support / Buy Zone)
3,602 – 3,605 (FVG zone – deeper support if 3,63x breaks, waiting for strong demand)
Market Structure
After rebounding from 3,62x, Gold consolidated around 3,65x – 3,66x.
Main trend stays bullish, but needs support retest to confirm buyers’ strength.
3,66x is the pivot barrier:
• Breakout → targets 3,68x
• Rejection → retest 3,64x – 3,62x
🎯 Captain’s Map – Trade Plan
✅ Buy (priority)
Entry: 3,602 – 3,605
SL: 3,588
TP: 3,629 – 3,661 – 3,683
⚡ Sell (short scalp)
Entry: 3,683 – 3,685
SL: 3,695
TP: 3,665 – 3,645
⚓ Captain’s Note
“The 3,63x fortress continues to hold, keeping the Golden ship safe on its northward journey. Golden Harbor 🏝️ (3,602 – 3,605) remains the main dock for sailors to gather strength. Storm Breaker 🌊 (3,683 – 3,685) may raise waves, suitable for short Quick Boarding 🚤 . Today is Friday – the sea can shift unexpectedly, so keep the sails full but hands steady on the helm.”

XAUUSD: Sideway Trading Opportunity Before Further Decline?Hello, fellow traders! Today, we will analyze XAUUSD and identify a great trading opportunity in the sideway trend before gold could potentially continue its downward adjustment.
Yesterday, although the Fed cut interest rates to 4.25% as expected (4.25% compared to 4.50% previously) , the cut did not exceed expectations, reducing the outlook for further policy easing. The USD may no longer weaken , putting downward pressure on gold.
In addition, the unemployment claims data came in lower than forecast (231K vs. 241K) , indicating a strong labor market, which will support the USD. When the USD strengthens, gold typically faces downward pressure, meaning gold prices could fall further if the USD continues to strengthen.
Gold is facing strong resistance at 3,700 , showing signs of a decline. The 3,660 zone is a key rebound level, and if support at 3,600 is not broken, gold could trade sideways before continuing the downward trend. Low trading volume and flow of funds suggest that the sideway trend could continue in the short term.
Don’t forget, our trading strategy needs to be flexible, seizing opportunities, and never missing any market changes.

Gold Dips After Fed Meeting: What's Next for the Market?Hey traders!
After a super volatile session, gold prices took a hit yesterday (September 18). The precious metal dropped 0.4% to $3,643.40/oz, while futures contracts lost 1.1% to $3,678.30/oz. This comes right after gold hit a new record of $3,707.40/oz in the previous session. Is this a signal for a major correction or just a bit of profit-taking? Let's break it down!
Fundamental Analysis: The Market 'Digests' the Fed's Message
While the Fed did cut rates by 0.25% as expected, the message from the meeting wasn't entirely 'dovish'. Fed Chair Jerome Powell raised doubts about the pace of future policy easing. He stressed that the rate cut was just a "risk management" move to address a weakening labor market, not a firm promise for aggressive easing.
USD Recovers: The Fed's cautious stance helped the USD index gain 0.5%, making gold more expensive for holders of other currencies.
Long-Term Drivers Still Strong: Despite the short-term dip, experts remain bullish on gold. The core drivers for its rally are still in place:
BRIC Central Bank Buying: Central banks, especially from China, continue to diversify their reserves, moving away from the USD.
Safe-Haven Demand: Ongoing geopolitical and trade tensions are still a key reason for investors to flock to gold.
Swiss Data Confirms: Data shows that gold exports from Switzerland to China jumped 254% in August 2025 compared to July, which proves that real demand is super strong.
Technical Analysis: Unpredictable Volatility
After the FOMC meeting, gold was all over the place, breaking through resistance and support levels in a flash. The market is reacting more to macro news than to technical patterns right now.
Resistance: $3671, $3686, $3694
Support: $3647, $3632, $3612, $3598
Outlook: Today, we should still prefer long positions if gold stays above the $365x level. However, if gold closes a candle below $364x during the US session, be cautious and consider a switch to sell positions.
Suggested Trading Strategy (Use Strict Risk Management):
SELL ZONE
Zone: $3686 - $3688
SL: $3696
TP: $3678 - $3668 - $3658 - $3648 - $3638
BUY ZONE
Zone: $3616 - $3614
SL: $3606
TP: $3624 - $3634 - $3644 - $3654 - $3664
The market is super sensitive to news right now. Always be careful and don't overtrade. Do you think this is a buying opportunity or a time to step back? Share your thoughts in the comments below! 👇
#Gold #XAUUSD #Fed #GoldAnalysis #TradingView #FinancialMarkets #TechnicalAnalysis #GoldTrading #USD #BRIC

GOLD - Breakout / Swept High appear - Where to BUY ? 🟡 OANDA:XAUUSD XAUUSD Daily Plan – September 19, 2025
1. Market Overview
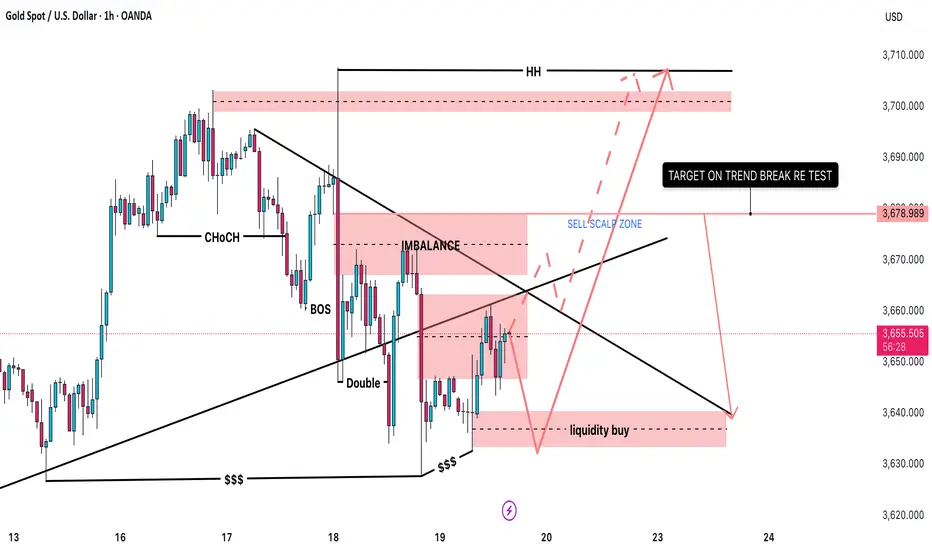
Price is consolidating around 3655 – 3660 after forming a short-term bearish structure.
On H1, several supply & demand zones are highlighted:
Liquidity Buy Zone around 3640 (potential demand).
Imbalance / Supply Zone around 3670 – 3680.
The overall higher-timeframe trend remains bullish, but in the short term, the market is retesting liquidity areas.
2. Key Levels & Zones
Liquidity Buy Zone: 3640 – 3645 → key support.
Sell Scalp Zone / Imbalance: 3670 – 3680 → short-term resistance.
Higher High Target (HH): 3700 – 3710 → strong higher-timeframe resistance.
Longer-term Support: 3620 – 3630.
3. Main Trading Scenarios
🟢 Long Setup (trend-aligned)
Wait for price to retest Liquidity Buy zone 3640 – 3645.
If reversal signals appear (pin bar, engulfing, etc.), consider opening Long.
Targets:
Short-term: 3678 (trendline break retest).
Mid-term: 3700 – 3710 (HH).
🔴 Short Setup (scalp only)
If price retraces into Sell Scalp Zone 3670 – 3680 and shows strong rejection → Short scalp opportunity.
Target: 3640 – 3645.
Note: Short trades are counter-trend, so manage quickly.
4. Trade Management Notes
Prioritize Longs from support zones since the higher-timeframe trend is still bullish.
Shorts should only be seen as short-term scalp opportunities near resistance.
Risk management: limit to 1–2% per trade, avoid holding against the main trend.
📌 Conclusion: XAUUSD is currently testing the descending trendline and resistance area. A successful breakout could target 3700+. Otherwise, the market is likely to revisit 3640 before launching the next bullish leg.
XAUUSD - 19/09/25 - BEP1. Breakout happened during Asian session
2. Expected price to retarce during the Asian session
3. Support confirmed during London session
4. Entered on BPCH
5. Candle flipped to red after my entry
6. Closed 70% of the position during flip
7. Remaining 30% closed at 1:1

Part 2 Support and ResistanceHow Options Work
Options allow traders to speculate or hedge in different market conditions. For example:
Buying a Call Option: If an investor expects a stock’s price to rise, they can buy a call option. If the stock price exceeds the strike price, the option holder can either sell the option at a profit or exercise it to buy the stock at a lower price.
Buying a Put Option: If an investor anticipates a decline in the stock price, they can buy a put option. If the stock price falls below the strike price, the option holder can sell the stock at a higher-than-market price or sell the option for a profit.
Options can also be sold/written, allowing traders to earn the premium as income. However, selling options carries significant risk because the seller may have unlimited loss potential if the market moves against them.
Options Pricing and Valuation
The value of an option is influenced by intrinsic value and time value:
Intrinsic Value: The difference between the underlying asset’s current price and the strike price. For example:
Call Option: Intrinsic Value = Max(0, Current Price – Strike Price)
Put Option: Intrinsic Value = Max(0, Strike Price – Current Price)
Time Value: The portion of the premium that accounts for the time remaining until expiry and the expected volatility of the underlying asset. Options with more time until expiration generally have higher premiums because there’s a greater chance for the underlying asset to move favorably.
Additionally, models such as the Black-Scholes model are used by traders and institutions to estimate theoretical option prices, considering factors like the underlying price, strike price, time to expiration, volatility, and interest rates.
Benefits of Options Trading
Options trading offers several advantages compared to traditional stock trading:
Leverage: Options allow investors to control a large number of shares with a relatively small investment. This amplifies potential gains (and losses).
Flexibility: Traders can use options to speculate, hedge, or generate income, offering multiple strategic possibilities.
Risk Management: Options can act as insurance for existing positions. For instance, buying a put option can protect a stock holding from a sharp decline.
Profit in Any Market Condition: Options strategies can be designed to profit in bullish, bearish, or even neutral markets.

XAUUSD – Correction Target on H4Technical Analysis
After reacting at the Sell Zone – FVG around 3,670, Gold could not sustain the upward momentum and is now showing signs of weakness. The H4 structure indicates that the correction phase is extending, with price likely to retest key support areas below.
On the chart, the support zones at 3,633–3,632 and 3,626 are acting as intermediate levels. If these zones fail to hold, selling pressure may push price deeper towards 3,614–3,612, before testing the major support confluence with Fibonacci extension and the potential Buy Zone at 3,579–3,560.
The RSI is currently hovering around 45–50, suggesting momentum is tilted towards a corrective move rather than a strong uptrend.
Trading Scenarios
SELL Setup (preferred):
Entry: on a retest of the 3,665–3,670 Sell Zone
SL: above 3,675
Targets: 3,633–3,632-3,626-3,614–3,612-3,579–3,560
BUY Setup (short-term / scalping):
Entry: consider buys around 3,626–3,625 support
SL: below 3,618
Targets:3,633-3,645-3,650
Key Levels to Watch
3,670: Sell Zone – confluence with FVG post-FOMC.
3,633–3,626: Short-term support; a break below confirms extended bearish pressure.
3,612: Key level for deciding near-term direction.
3,579–3,560: Potential Buy Zone and main corrective target on H4.
Traders may keep these levels on watch and align positions accordingly. Follow for quicker access to future updates.

XAUUSD –Today’s Trading Outlook | Sell Fill Liquidity & Buy Zone
Hello traders,
In the recent sessions, gold has continued to show strong volatility around important liquidity zones and support–resistance levels. The current structure indicates that sellers remain in control in the short term, while buyers are expected to return only if price reaches deeper support areas.
Technical View
Main Resistance: 3670 – 3680, aligning with the FVG zone → key area for Sell to Fill Liquidity.
Short-term Support: 3630 – 3627. A break below could open the way for a deeper decline.
Buy Scalping Zones: 3613 – 3615 and 3595 – 3598, suitable for quick intraday longs.
Medium-term Buy Zone: 3600 – 3590, confluence with strong liquidity zone and major support.
MACD Indicator: leaning bearish, with a negative histogram, showing selling pressure still dominant.
Trading Scenarios
Sell Setup (priority)
Sell Liquidity Zone: 3670 – 3680
SL: 3685
TP: 3650 – 3635 – 3627 – 3615 – 3600
Buy Scalping
Buy Zone 1: 3613 – 3615 | SL: 3608 | TP: 3625 – 3638 – 3645
Buy Zone 2: 3595 – 3598 | SL: 3590 | TP: 3610 – 3625 – 3638 – 3645 – 3670
Medium-term Buy
Zone: 3600 – 3590
SL: 3584
Extended TP: 3633 – 3660 – 3675
Conclusion
In the short term, gold is likely to retest the upper liquidity zone before continuing with further declines. Sellers remain in control for now, but deeper support zones will provide potential entry levels for medium-term buyers.
Keep a close watch on these key levels and align your trades with your personal strategy.
Follow along to get the earliest updates whenever market structure changes.

Gold Chart Analysis and Price PredictioinGold Chart Analysis and Price Prediction
The Gold Chart is seen to to making Cup and Handle pattern which indicates a bullish sign. Market completely absorbed FED interest cut decisions. Even though in the FED press meet he signed uncertainty in further anticipated rate cuts, Gold is showing bullish sign. A probable break out could be witness after 23 Sepetember'2025.

XAUUSD – Main Trend: SELL for TodayXAUUSD – Main Trend: SELL for Today
Technical View
In yesterday’s session, Gold reacted three times around the 363x zone but could not break it decisively. This shows the support here is still important, yet selling pressure has been quite strong and continuous.
This morning, the bounce almost absorbed the liquidity of the earlier H1 bearish candle, and price is now in a short-term pullback. The POC from the Volume Profile of the accumulation area has not been fully tested, so there is high probability that price will come back to check that zone before moving with the broader trend.
Overall, considering the technical factors, the main bias for today remains SELL, especially when price approaches key supply zones.
Trade Set-ups
SELL (preferred):
Entry: 3667–3670
SL: 3675
TP1: 3655
TP2: 3640
TP3: 3626
TP4: 3610
BUY (short-term counter move):
Entry: 3613–3615
SL: 3608
TP1: 3625
TP2: 3633
TP3: 3645
TP4: 3660
Key Price Levels
3670: Crucial resistance, aligned with POC – SELL bias is preferred here.
363x: Strong support, tested many times; if it breaks, downside pressure may get stronger.
3610–3615: Demand zone, could give a small pullback.

Elliott Wave Analysis XAUUSD – September 19, 2025
Momentum
• D1 timeframe: Momentum is currently declining, suggesting that the downtrend may continue until momentum enters the oversold zone. This process could take at least 2 daily candles, including the current one.
• H4 timeframe: Momentum is turning upward, but repeated reversals at the oversold zone, along with overlapping price action, indicate that the market is in a complex corrective phase.
• H1 timeframe: Momentum has already turned upward, with 3 H1 bullish candles formed. It is expected that within 1–2 more candles, momentum will likely reach the overbought zone.
Wave Structure
• D1 timeframe: The 5-wave black structure has been completed. The current correction is expected to last longer compared to the previous WXY triangle correction.
• H4 timeframe: Wave counting is complicated due to overlapping price movements. With momentum now recovering, wave B is likely unfolding, which will then be followed by the completion of wave C.
• H1 timeframe: A temporary channel can be drawn to observe price behavior. The market is likely in wave B (black), forming a Flat structure (ABC in blue). Wave C (blue) is projected to equal wave A (blue) at the 3667 level. This price zone also coincides with the boundary between high and low liquidity areas on the Volume Profile, making it a strong resistance zone for potential short entries.
Trading Plan
• Sell Zone: 3667 – 3670
• SL: 3680
• TP: 3644

Gold Today Intraday TradeDear Trader I,m Analysis
Gold has recently hit fresh highs around $3,700/oz, but now there’s profit-booking and resistance in that zone.
Support is seen near $3,640–$3,630/oz, which has acted as a demand zone in recent dips.
Some indicators are overbought (like RSI / Williams %R) or showing signs that upside momentum could be weakening unless price breaks certain resistance levels.
There is a possible bearish bias now if gold fails to clear resistance—to the upside, a breakout above ~$3,700+ could trigger further gains
---
📈 Key Levels to Watch
Level Type Approximate Price ($/oz)
Strong Resistance ~ $3,700–$3,707
Near Resistance ~$3,678–$3,680
Strong Support ~$3,640–$3,630
Deeper Support ~$3,600

GOLD SHOWING A GOOD UP MOVE WITH 1:10 RISK REWARD GOLD SHOWING A GOOD UP MOVE WITH 1:10 RISK REWARD
DUE TO THESE REASON
A. its following a rectangle pattern that stocked the market
which preventing the market to move any one direction now it trying to break the strong resistant lable
B. after the break of this rectangle it will boost the market potential for break
C. also its resisting from a strong neckline the neckline also got weeker ald the price is ready to break in the outer region
all of these reason are indicating the same thing its ready for breakout BREAKOUT trading are follws good risk reward
please dont use more than one percentage of your capitalfollow risk reward and tradeing rules
that will help you to to become a bettertrader
thank you

Gold Intraday Analysis: Range Play Until BreakoutGold is currently trading in a range-bound structure after pulling back from the 3700 level. The weekly pivot around 3632 is acting as strong support, while the 3700 zone serves as resistance, forming the upper boundary of the range. Price is showing signs of consolidation between these levels, suggesting a sideways market. For any breakout confirmation, we need to see a clear H1 or H4 candle close above 3700 or below 3632, along with volume or strong price rejection/follow-through. Until then, the price action favors range trading within these key levels.

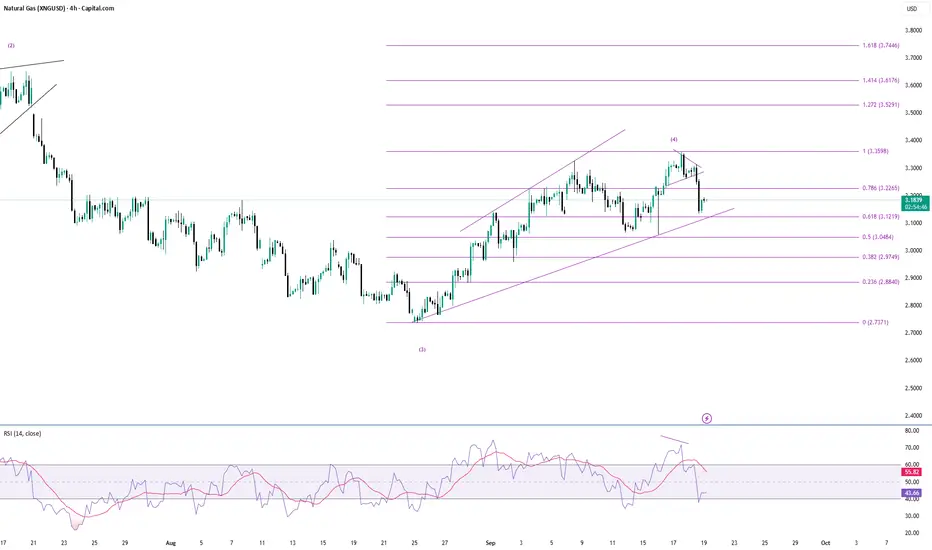
Natural Gas another leg of correction?Looks like natural gas is taking support at the 0.618 level of the previous swing. If this level (3.1228) is broken, we can expect a big move on the down side.
Gold longGold can touch 3654 SL is 3638, education purpose only you can monitor,if you trade there may be somewhat happen either side

Gold Trading Inside Channel – Key Support & Resistance Levels!Hello Traders!
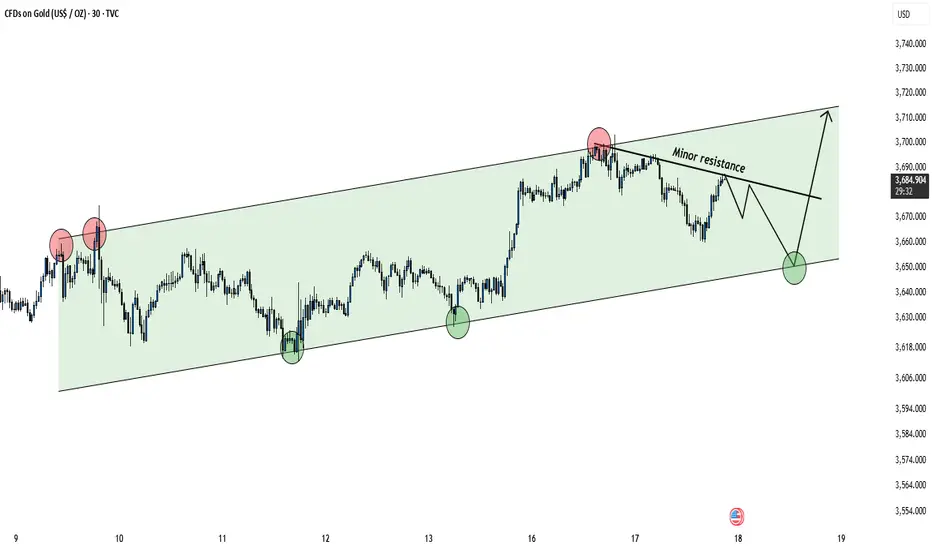
Gold is currently moving inside a well-defined ascending channel on the 30-min chart. Both buyers and sellers are respecting the levels of this channel, giving us clear trading opportunities.
Key Observations
Price has tested the upper channel resistance multiple times, facing rejection near $3,710–$3,720.
The lower channel support around $3,650 has been well respected, creating strong buying reactions.
A minor resistance trendline is now forming, which could temporarily limit upside momentum.
Short-term path suggests: rejection from minor resistance → retest of channel bottom → potential bounce back toward the upper channel.
Trading Plan
Bullish bias remains intact as long as Gold holds above $3,650 channel support.
A bounce from support may target $3,710–$3,720 zone again.
If support breaks, deeper correction may follow.
Rahul’s Tip
Always wait for confirmation near channel edges. Trading inside the channel can be tricky, but respecting support and resistance gives you high-probability setups.
Disclaimer: This analysis is for educational purposes only and should not be taken as financial advice. Please do your own research or consult your financial advisor before investing.
Analysis By @TraderRahulPal (TradingView Moderator) | More analysis & educational content on my profile
👉 If you found this helpful, don’t forget to like and follow for regular updates.
Gold Trading Strategy | September 18-19🎉 Congratulations to our members who followed our trading strategy - today's trades yielded a profit of over 300++ pips!
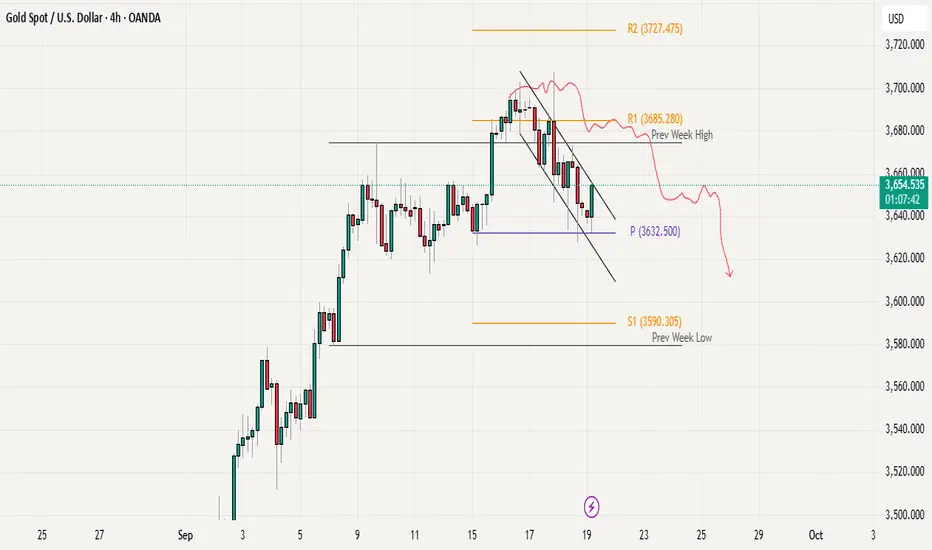
✅ Based on the 4-hour chart, gold formed a phase top at 3707 and has since pulled back in a consolidation.
The moving averages MA5 and MA10 have crossed downward, while MA20 near 3670 is acting as resistance.
The short- to medium-term trend shows weakening bullish momentum with bears gradually taking control. The Bollinger Bands’ midline is around 3670, and the price has broken below it, now moving near the lower band, indicating weakness. If it cannot quickly reclaim the midline, the trend is likely to remain bearish.
Currently, gold is trading in the 3640–3650 range. If this zone breaks, the price may further test the 3625–3630 support. A break below 3625–3630 would open more downside potential, with the next target around 3600.
🔴 Resistance levels: 3660–3670
🟢 Support levels: 3640–3630
✅ Trading Strategy Reference:
🔰 If the price rebounds to 3660–3670 and faces resistance, consider light short positions with targets at 3630–3625.
🔰 If the price drops to around 3625 and stabilizes, short-term long positions can be considered, targeting 3655–3660.
🔥Trading Reminder: Trading strategies are time-sensitive, and market conditions can change rapidly. Please adjust your trading plan based on real-time market conditions. If you have any questions , feel free to contact me🤝

FED slows down: Cuts 25bps, gold stays flat🟡 XAU/USD – 18/09 | Captain Vincent ⚓
🔎 Captain’s Log – News Context
FED : Cut rates by 25bps as expected, hinted at 2 more cuts this year → initially supported Gold to rebound around 3,65x.
Powell turned hawkish :
• “No need to move quickly on rate cuts.”
• “Today’s cut is mainly risk-management.”
This message signaled that the FED is not fully opening the easing door → Gold fluctuated and stalled its upside momentum.
Tonight: Awaiting Jobless Claims & Philly Fed for more clarity on the FED’s path.
⏩ Captain’s Summary
Gold is supported by the rate cut, but Powell’s “braking” caused volatility.
Zone 3,663 – 3,665 has become the pivot support to determine the next move.
📈 Captain’s Chart – Technical Analysis
Storm Breaker (Resistance / Sell Zone)
3,684 – 3,686 (strong OB)
3,717 – 3,719 (ATH Zone – very strong, likely heavy selling)
Golden Harbor (Support / Buy Zone)
Pivot Dock: 3,663 – 3,665 (new pivot support)
Main Harbor: 3,629 – 3,630 (BoS confluence & old sideway)
Market Structure
After breakout and profit-taking, Gold returned to test support.
3,663 – 3,665 : pivot support.
• If it holds → rebound to 3,684 – 3,717.
• If it breaks → deeper correction to 3,629.
🎯 Captain’s Map – Trade Plan
✅ Buy (priority)
Buy Zone 1
Entry: 3,663 – 3,666
SL: 3,655
TP: 3,684 – 3,717
Buy Zone 2
Entry: 3,629 – 3,630
SL: 3,618
TP: 3,663 – 3,684 – 3,717
⚡ Sell (only at resistance)
Sell Zone OB
Entry: 3,684 – 3,686
SL: 3,695
TP: 3,665 – 3,645
Sell Zone ATH NEW
Entry: 3,717 – 3,719
SL: 3,727
TP: 3,706 – 3,690 – 3,675
⚓ Captain’s Note
“The Golden sails caught wind as the FED cut rates, but Powell’s headwind slowed the advance. Golden Harbor 🏝️ (3,663 – 3,629) is the pivot dock to decide the next course. If it holds, the ship may rebound to test Storm Breaker 🌊 (3,684 – 3,719) . If it breaks, the ship will retreat deeper to gather strength. For now, Quick Boarding 🚤 should only be done at strong resistance, while the larger voyage still leans northward.”

Gold Breaking Limits – Trend Speaks for ItselfGold Breaking Limits – Trend Speaks for Itself
Gold Market Outlook
Gold continues to demonstrate a well-structured bullish cycle, characterized by steady momentum and clean trend development. The market has transitioned from a prolonged consolidation phase into a sustained directional move, where each breakout is validated by controlled retracements. This reflects strong participation and confidence from larger players.
The sequence of market shifts and break-of-structure signals highlight how short-term pullbacks are consistently absorbed, turning into fuel for further expansion. Price action is orderly, with no signs of erratic volatility, showing that buyers remain in control and liquidity is being managed efficiently.
Overall, gold is moving in line with the broader macro sentiment. The rhythm of accumulation, expansion, and continuation suggests that the current cycle has not yet exhausted its potential. While interim pauses are expected, the structural integrity of the trend continues to favor upside development over the medium term.
