LiamTrading – XAUUSD: A New Trend EmergingHello traders, gold has just formed a new structure as it began a sharp correction following Chairman Powell’s announcement of a Fed rate cut. On the H1 chart, a clear bearish Dow structure is developing, indicating potential medium-term sustainability.
Most buy-side liquidity has already been cleared, which makes the chances of a strong recovery quite low – except for a brief FVG right after the news. However, given overall market sentiment, trading activity in that phase was not significant. The gap formation signals that sellers are now confident in taking control after the Fed’s statement.
The current decline could push gold towards the 363x region, and possibly as far as 361x. A key confirmation level remains at the strong support of 3651, where price previously bounced more than 20 dollars immediately after the news.
Trading plan for today:
Sell 3656 – 3659, SL 3666, TP 3651 – 3646 – 3638 – 3634 – 3626 – 3615
Buy 3634 – 3632, SL 3628, TP 3640 – 3652 – 3660
Buy zone 3607 – 3604, SL 3600, TP 3616 – 3625 – 3638 – 3647 – 3660
This is my personal outlook on XAUUSD for today – use it as a reference for your own trading decisions. If you find this analysis helpful, do follow me for more gold trading scenarios and daily insights.
Futures market

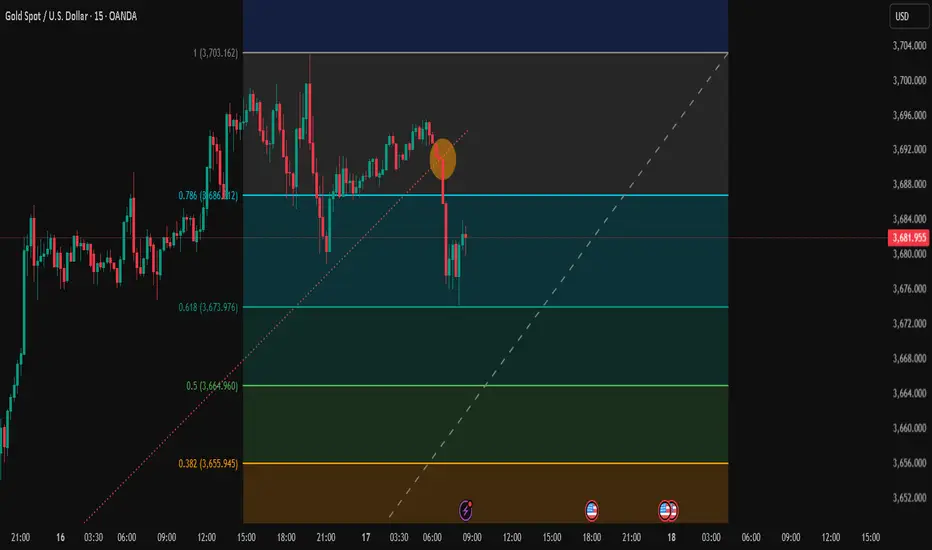
Trading Analysis for Gold Spot / U.S. Dollar (15-Minute Chart)Sell XAU/USD now at 3688.00 level and take a stop loss of 3703.00 and the targets will be as follows.
Entry range 3691.00 to 3687.00
Take Profit 1 = 3673.00
Take Profit 2 = 3665.00
Take Profit 3 = 3655.00
Take Profit 4 = 3645.00
Stock Loss 3703.00
Based on the provided 15-minute chart for Gold Spot / U.S. Dollar (XAU/USD), published by NaviPips on TradingView.com on June 30, 2025, at 17:53 UTC, here’s a suggested trading setup for a buy position:
Current Price and Trend: The current price is 3,241.875, with a slight increase of +0.250 (+0.01%). The chart shows a recent downtrend that appears to be stabilizing near the current level, suggesting a potential reversal point.
Buy Entry: Enter a buy position at 3,312.875 (current price), as it aligns with a support zone where the price has found a base, indicated by the horizontal dashed line and recent consolidation.
Stop Loss: Place a stop loss at 3,295.250, below the recent low, to protect against further downside. This level is approximately 10.625 points below the entry, defining the risk.
Take Profit Levels:
Take Profit 1: 3,317.875, a conservative target about 20.000 points above the entry, aligning with a minor resistance zone.
Take Profit 2: 3,324.750, a mid-range target approximately 31.875 points above the entry.
Take Profit 3: 3,332.500, a deeper target about 45.625 points above the entry, indicating a potential trend reversal.
Price Action: The chart indicates a downtrend with a possible bottoming pattern near the current level. The support zone and upward candlestick suggest a buy opportunity if the price holds.
Risk-Reward Ratio: The distance to the stop loss (10.625 points) compared to the take profit levels (20.000 to 45.625 points) offers a favorable risk-reward ratio, ranging from approximately 1:1.9 to 1:4.3.
Conclusion
Enter a buy at 3,241.875, with a stop loss at 3,295.250 and take profit levels at 3,317.875, 3,324.750, and 3,332.500. Monitor the price action for confirmation of an upward move, and be cautious of a potential continued downtrend if the price breaks below the stop loss level. (Note: I assume "take profot" was a typo for "take profit" and have corrected it accordingly.)
Pair Trading & Statistical Arbitrage1. Introduction
Financial markets are inherently volatile, influenced by macroeconomic trends, geopolitical events, corporate performance, and investor sentiment. Traders and quantitative analysts have developed sophisticated strategies to profit from these market movements while minimizing risk. Among these strategies, Pair Trading and Statistical Arbitrage have gained prominence due to their market-neutral nature, making them less dependent on overall market direction.
Pair trading is a type of market-neutral strategy that exploits the relative pricing of two correlated assets, typically stocks, to profit from temporary divergences. Statistical arbitrage, or Stat Arb, extends this concept to a broader portfolio of securities and uses advanced statistical and mathematical models to identify mispricings.
These strategies are widely used by hedge funds, quantitative trading firms, and institutional investors because they can generate consistent returns with controlled risk. In this essay, we will explore the conceptual framework, methodology, statistical underpinnings, practical applications, challenges, and real-world examples of pair trading and statistical arbitrage.
2. Understanding Pair Trading
2.1 Definition
Pair trading is a relative-value trading strategy where a trader identifies two historically correlated securities. When the price relationship deviates beyond a predetermined threshold, the trader simultaneously takes a long position in the undervalued asset and a short position in the overvalued asset. The expectation is that the price divergence will eventually converge, allowing the trader to profit from the relative movement rather than market direction.
2.2 Market Neutrality
The key advantage of pair trading is its market-neutral approach. Since the strategy relies on the relative pricing between two securities rather than the overall market trend, it is less exposed to systemic risk. For example, if the broader market declines, a pair trade may still be profitable as long as the relative relationship between the two securities converges.
2.3 Selection of Pairs
Successful pair trading depends on selecting the right pair of securities. The two primary methods of selection are:
Correlation-Based Approach: Identify securities with high historical correlation (e.g., 0.8 or higher). Highly correlated stocks are more likely to maintain their relative price behavior over time.
Example: Coca-Cola (KO) and PepsiCo (PEP), which often move in tandem due to similar business models and market factors.
Cointegration-Based Approach: While correlation measures the linear relationship between two assets, cointegration assesses whether a stable long-term equilibrium relationship exists. Cointegrated assets are statistically bound such that their price spread tends to revert to a mean over time, making them ideal candidates for pair trading.
2.4 Entry and Exit Rules
Entry Rule: Open a trade when the spread between the two securities deviates significantly from the historical mean, typically measured in standard deviations (z-score).
Example: If the spread between Stock A and Stock B is 2 standard deviations above the mean, short the overperforming stock and go long on the underperforming stock.
Exit Rule: Close the trade when the spread reverts to its historical mean, capturing the profit from convergence. Stop-loss rules are often applied to manage risk if the divergence widens further instead of converging.
2.5 Example of a Pair Trade
Suppose Stock X and Stock Y historically move together, but Stock X rises faster than Stock Y. A trader could:
Short Stock X (overvalued)
Long Stock Y (undervalued)
If the prices revert to their historical spread, the trader profits from the convergence. The market's overall direction is irrelevant; the trade relies solely on the relative movement.
3. Statistical Arbitrage: Expanding Pair Trading
3.1 Definition
Statistical Arbitrage refers to a class of trading strategies that use statistical and mathematical models to identify mispricings across a portfolio of securities. Unlike pair trading, which focuses on two assets, statistical arbitrage can involve dozens or hundreds of securities and uses algorithms to detect temporary pricing anomalies.
Statistical arbitrage aims to exploit mean-reverting behavior, co-movements, or price inefficiencies while keeping market exposure minimal.
3.2 Core Concepts
Mean Reversion: Many statistical arbitrage strategies assume that asset prices or spreads revert to a historical average. The idea is similar to pair trading but applied to larger groups of assets.
Market Neutrality: Like pair trading, statistical arbitrage attempts to remain neutral with respect to market direction. Traders hedge exposure to indices or sectors to isolate the alpha generated from relative mispricing.
Diversification: By analyzing multiple assets simultaneously, statistical arbitrage spreads risk and reduces dependence on any single asset, increasing the probability of consistent returns.
3.3 Methodology
Data Collection and Cleaning: High-quality historical price data is critical. This includes closing prices, intraday prices, volumes, and corporate actions like splits and dividends.
Model Selection:
Linear Regression Models: Estimate relationships between multiple securities.
Cointegration Models: Identify groups of assets that share long-term equilibrium relationships.
Principal Component Analysis (PCA): Reduce dimensionality and identify dominant market factors affecting securities.
Spread Construction: For a set of assets, construct linear combinations (spreads) expected to revert to the mean.
Trade Signal Generation:
Compute z-scores of spreads.
Enter trades when spreads exceed a predefined threshold.
Exit trades when spreads revert to mean or hit stop-loss levels.
Risk Management:
Limit exposure to any single stock or sector.
Monitor residual market beta to maintain neutrality.
Use dynamic hedging and stop-loss rules.
3.4 Examples of Statistical Arbitrage Strategies
Equity Market Neutral: Long undervalued stocks and short overvalued stocks based on statistical models.
Index Arbitrage: Exploit price differences between a stock index and its constituent stocks.
High-Frequency Stat Arb: Uses intraday price movements and algorithms to capture small, short-lived mispricings.
ETF Arbitrage: Exploit deviations between ETFs and the net asset value (NAV) of underlying assets.
4. Challenges and Limitations
Model Risk: Incorrect assumptions about mean reversion or correlations can lead to significant losses.
Changing Market Dynamics: Relationships between securities may break down due to macroeconomic events, mergers, or structural market changes.
Execution Risk: High-frequency stat arb requires fast execution; delays can erode profitability.
Capital and Transaction Costs: Frequent trades and leverage increase transaction costs, which can offset profits.
Overfitting: Overly complex models may perform well historically but fail in live markets.
5. Conclusion
Pair trading and statistical arbitrage represent a sophisticated intersection of finance, mathematics, and technology. Both strategies exploit mispricings in a market-neutral way, offering opportunities for consistent returns with reduced exposure to market direction. Pair trading focuses on two correlated securities, while statistical arbitrage extends the concept to multi-asset portfolios using statistical models. Despite challenges such as model risk and execution hurdles, these strategies remain fundamental tools for modern quantitative trading, especially in highly efficient markets where traditional directional strategies may struggle.
The future of these strategies is closely tied to technological advancements, from high-frequency trading to artificial intelligence, ensuring that quantitative finance continues to evolve toward more data-driven and precise market insights.
Blockchain & Tokenized Assets in Trading1. Understanding Blockchain in Trading
1.1 Blockchain Fundamentals
Blockchain is a decentralized ledger that records transactions across multiple computers, ensuring that records cannot be altered retroactively. Key characteristics include:
Decentralization: No single entity controls the network, reducing the risk of centralized failures or manipulation.
Immutability: Once recorded, transactions cannot be altered, enhancing transparency and trust.
Consensus Mechanisms: Networks use methods like Proof of Work (PoW) or Proof of Stake (PoS) to validate transactions.
Smart Contracts: Self-executing contracts with rules encoded directly on the blockchain automate processes, reducing human intervention.
In trading, these features eliminate many traditional inefficiencies, such as delayed settlement, dependency on intermediaries, and manual record-keeping.
1.2 Blockchain vs Traditional Trading Systems
Traditional trading systems, such as stock exchanges and commodity markets, are centralized and rely heavily on brokers, clearinghouses, and custodians. These systems often involve:
Settlement delays: Trades typically settle in T+2 or T+3 days.
Limited accessibility: Small investors may face restrictions due to high entry barriers.
Manual reconciliation: Back-office operations are labor-intensive and prone to errors.
Blockchain addresses these issues by providing:
Real-time settlement: Transactions can be settled almost instantly using digital tokens.
Global accessibility: Anyone with an internet connection can participate in tokenized markets.
Reduced costs: Automation through smart contracts lowers administrative and operational expenses.
2. Tokenized Assets: Definition and Scope
2.1 What Are Tokenized Assets?
Tokenized assets are digital tokens issued on a blockchain that represent ownership rights to real-world assets. These tokens can be broadly categorized into:
Security Tokens: Represent traditional securities like stocks, bonds, or real estate shares. They are often regulated and provide legal rights to holders, including dividends or interest payments.
Utility Tokens: Provide access to a service or platform rather than ownership of an asset. For example, tokens used in decentralized exchanges for transaction fees.
Commodity Tokens: Represent tangible assets like gold, oil, or other commodities.
NFTs as Assets: While traditionally linked to art and collectibles, NFTs can represent ownership of unique financial contracts or intellectual property.
2.2 Benefits of Tokenization
Fractional Ownership: High-value assets, like real estate or rare art, can be divided into smaller tokens, allowing retail investors to participate.
Liquidity: Tokenization enables trading of illiquid assets in secondary markets, improving asset liquidity.
Transparency and Security: Ownership and transaction history are recorded immutably on the blockchain.
Global Market Access: Investors worldwide can buy and sell tokenized assets without geographic restrictions.
Programmability: Smart contracts automate payouts, compliance, and corporate actions.
3. Blockchain-Powered Trading Platforms
3.1 Decentralized Exchanges (DEXs)
Decentralized exchanges allow peer-to-peer trading without intermediaries. Examples include Uniswap, Sushiswap, and PancakeSwap. Key advantages:
Users retain custody of their assets.
Automated Market Makers (AMMs) provide liquidity using smart contracts.
Cross-border and 24/7 trading is possible.
3.2 Security Token Exchanges
Security token exchanges, like tZERO and OpenFinance, cater to regulated security tokens. Features include:
Compliance with KYC/AML regulations.
Integration with traditional financial systems.
Fractional trading of securities like real estate, bonds, or shares.
3.3 Hybrid Trading Platforms
Hybrid platforms combine centralized and decentralized elements to provide regulatory compliance, liquidity, and efficient execution. Examples include Binance and FTX (prior to its collapse). They often provide:
Custody services.
Access to tokenized securities.
Integration with fiat onramps.
4. Applications of Tokenized Assets in Trading
4.1 Equity Tokenization
Companies can issue shares as digital tokens, making fundraising faster and accessible globally. Benefits include:
Reduced costs of IPOs and share issuance.
Increased liquidity for traditionally illiquid stocks.
Fractional ownership for small investors.
4.2 Bond Tokenization
Tokenized bonds offer programmable interest payouts and shorter settlement cycles. This reduces operational costs and increases market efficiency.
4.3 Commodity Tokenization
Gold, silver, and oil can be tokenized, allowing traders to buy small fractions of physical commodities. Advantages:
Reduced storage and transport costs.
Global access to commodities markets.
Instant settlement and 24/7 trading.
4.4 Real Estate Tokenization
Tokenizing real estate allows multiple investors to co-own properties without traditional paperwork. Benefits:
Liquidity in traditionally illiquid markets.
Diversification across geographies and asset types.
Automated rental income distribution via smart contracts.
4.5 Derivatives and Synthetic Assets
Blockchain enables tokenized derivatives and synthetic assets that mirror the price movements of traditional assets. Traders can gain exposure to equities, commodities, or currencies without holding the underlying asset.
5. Advantages of Blockchain and Tokenization in Trading
Efficiency and Speed: Trade settlement occurs almost instantly compared to traditional T+2/T+3 systems.
Reduced Counterparty Risk: Smart contracts automate settlement, reducing reliance on third parties.
Cost Reduction: Fewer intermediaries and automation lower transaction and operational costs.
Transparency: All transactions are recorded on a public ledger, reducing fraud risk.
Global Access: Investors across the world can participate without geographical restrictions.
Programmable Assets: Smart contracts allow automation of dividends, interest, or royalties.
6. Challenges and Risks
While the benefits are significant, blockchain and tokenized assets face several challenges:
6.1 Regulatory Challenges
Regulatory frameworks for tokenized assets are still evolving worldwide.
Different countries have varying rules for securities, taxation, and investor protection.
Compliance with anti-money laundering (AML) and know-your-customer (KYC) standards is mandatory but complicated in decentralized systems.
6.2 Security Concerns
Smart contract vulnerabilities can lead to hacks and loss of assets.
Private key management is critical; loss of keys results in irreversible loss.
6.3 Market Liquidity
Tokenized asset markets are still emerging; liquidity may not always match traditional markets.
Low liquidity can lead to price volatility and market manipulation.
6.4 Technological Risks
Blockchain scalability and transaction speed are ongoing challenges, especially during periods of high demand.
Interoperability between different blockchain networks is limited.
9. Conclusion
Blockchain technology and tokenized assets are reshaping the landscape of trading. By combining decentralization, transparency, and programmability, they address the inefficiencies of traditional financial markets. Investors can now access fractional ownership of assets, trade globally, and benefit from faster settlement cycles.
However, challenges remain—regulation, security, liquidity, and technological limitations need resolution for mainstream adoption. Despite these hurdles, the trajectory is clear: tokenized trading is moving from niche innovation to an integral part of global financial markets. The future may see fully decentralized exchanges for stocks, bonds, commodities, and real estate, offering unprecedented access, efficiency, and democratization of financial markets.
Blockchain and tokenized assets do not merely represent a new way to trade—they signal a paradigm shift in how value is represented, transferred, and monetized in the digital era. For traders, investors, and institutions, embracing this evolution is no longer optional; it is essential for staying ahead in the rapidly changing financial landscape.

Technology & Innovation in Trading1. Historical Context: From Open Outcry to Digital Platforms
1.1 The Open-Outcry Era
Traditionally, trading took place in physical exchanges using open-outcry systems, where traders would shout and use hand signals to execute orders. While this method facilitated human interaction and negotiation, it had significant limitations:
Time and geographical constraints: Trading required physical presence on the floor.
Limited access: Retail investors found it difficult to participate.
Risk of human error: Manual execution often resulted in mistakes.
1.2 Advent of Electronic Trading
The 1980s and 1990s marked the transition from floor-based trading to electronic systems. Exchanges like NASDAQ pioneered automated order matching, allowing trades to be executed faster and more efficiently. The introduction of electronic trading platforms democratized market access and laid the foundation for further innovations.
Key innovations included:
Real-time quotes and order books.
Electronic order matching.
Automated risk management tools for brokers and traders.
2. Algorithmic and High-Frequency Trading (HFT)
2.1 Algorithmic Trading
Algorithmic trading (algo trading) uses computer programs to execute trades based on predefined criteria. These algorithms analyze vast amounts of market data to identify patterns, trends, and opportunities that humans may overlook.
Advantages:
Increased execution speed.
Reduced transaction costs.
Minimized human bias and emotional decision-making.
Applications:
Trend-following strategies.
Arbitrage opportunities.
Market-making operations.
2.2 High-Frequency Trading
High-Frequency Trading represents a subset of algorithmic trading characterized by ultra-fast execution and extremely short holding periods. HFT relies on sophisticated algorithms, co-location facilities near exchange servers, and ultra-low latency networks.
Impact of HFT:
Liquidity provision: HFT firms often act as market makers.
Market volatility: While providing liquidity, HFT can amplify short-term volatility.
Technological arms race: Firms compete to reduce latency by microseconds, driving continuous innovation in network and hardware technology.
3. Artificial Intelligence and Machine Learning in Trading
3.1 Predictive Analytics
Artificial intelligence (AI) and machine learning (ML) enable predictive analytics in trading. By analyzing historical price patterns, market sentiment, and macroeconomic indicators, AI models can forecast market movements with increasing accuracy.
Applications:
Sentiment analysis: AI analyzes news articles, social media, and financial reports to gauge market sentiment.
Pattern recognition: ML algorithms identify recurring patterns that signal potential buy or sell opportunities.
Portfolio optimization: AI helps traders optimize asset allocation based on risk-return profiles.
3.2 Reinforcement Learning
Reinforcement learning, a branch of AI, is increasingly applied to trading. Here, algorithms learn through trial and error, optimizing strategies over time. These models are particularly useful in dynamic markets where traditional rule-based algorithms may fail.
4. Big Data and Market Intelligence
The explosion of digital information has given rise to big data, which is transforming trading decisions. Financial markets generate enormous volumes of structured and unstructured data, including:
Price and volume data.
News and macroeconomic indicators.
Social media trends.
Alternative data sources like satellite imagery, shipping logs, and consumer behavior metrics.
Big data technologies in trading:
Real-time data processing frameworks.
Advanced analytics platforms.
Data visualization tools for actionable insights.
Traders now leverage these tools to gain competitive advantages, optimize strategies, and identify market anomalies before competitors.
5. Blockchain and Decentralized Finance (DeFi)
5.1 Blockchain Technology
Blockchain introduces decentralized, immutable ledgers that enhance transparency and security in trading. Its applications in trading are vast:
Cryptocurrency exchanges: Platforms like Binance and Coinbase rely on blockchain for secure transactions.
Tokenized assets: Traditional assets such as stocks, bonds, and real estate can now be tokenized for fractional ownership and global trading.
5.2 Decentralized Finance
DeFi platforms use smart contracts to execute trades without intermediaries, reducing costs and settlement times. Innovations like automated market makers (AMMs) and decentralized exchanges (DEXs) are reshaping the conventional trading ecosystem.
6. Mobile Trading and Retail Empowerment
The proliferation of smartphones has democratized access to trading. Mobile trading apps enable retail investors to trade anytime, anywhere. Innovations include:
Real-time price alerts and notifications.
Fractional share trading.
Integration with AI-based advisory services.
Gamification features to enhance engagement and financial literacy.
This trend has increased market participation and encouraged the growth of retail trading, particularly among younger investors.
Conclusion
Technology and innovation have fundamentally reshaped trading, making it faster, more accessible, and more sophisticated. From algorithmic trading and AI-driven insights to blockchain, DeFi, and mobile platforms, the financial markets of today are more interconnected and data-driven than ever. While these innovations create unprecedented opportunities, they also pose challenges related to security, regulation, and systemic risk. The future of trading lies in the continuous interplay of technology, human ingenuity, and robust regulatory frameworks—ensuring that markets remain efficient, inclusive, and resilient.
The next decade promises even more radical transformations, as AI, quantum computing, and immersive technologies converge with finance. Traders, institutions, and regulators must adapt proactively to leverage opportunities while mitigating risks, ensuring that the financial markets continue to thrive in an era of rapid technological change.

Gold 1H – Fed Decision Looms After $3,700 BreakOn the 1H timeframe, Gold is consolidating around 3,675 after sweeping through the key $3,700 level. Price briefly touched 3,702 before retreating back into the 3,670s, showing engineered liquidity runs on both sides. With the Fed policy decision expected at 1 AM VN time, volatility is likely to spike. The market remains supported by easing USD, central bank flows, and geopolitical tensions, but short-term positioning indicates possible liquidity grabs before a clear directional move.
________________________________________
📌 Key Structure & Liquidity Zones (1H)
• 🔴 SELL SCALP 3,696 – 3,694 (SL 3,703)
Premium supply pocket for engineered rejection targeting 3,690 → 3,685 → 3,680.
• 🟢 FVG BUY ZONE 3,674 – 3,665 (SL 3,660)
Fair Value Gap demand zone for retracement into structure, targeting 3,685 → 3,695 → 3,700+.
• 🟢 BUY SUPPORT 3,636 – 3,638 (SL 3,630)
Deep discount accumulation zone targeting 3,655 → 3,670 → 3,680+.
________________________________________
📊 Trading Ideas (Scenario-Based)
🔺 Buy Setup – FVG Reclaim (3,674–3,665)
• Entry: 3,674 – 3,665
• Stop Loss: 3,660
• Take Profits:
o TP1: 3,685
o TP2: 3,695
o TP3: 3,700+
👉 Look for liquidity sweep into FVG before NY session/Fed.
🔺 Buy Setup – Deep Discount (3,636–3,638)
• Entry: 3,636 – 3,638
• Stop Loss: 3,630
• Take Profits:
o TP1: 3,655
o TP2: 3,670
o TP3: 3,680+
👉 High risk-to-reward setup if stops are hunted before Fed decision.
🔻 Sell Setup – Premium Trap (3,696–3,694)
• Entry: 3,696 – 3,694
• Stop Loss: 3,703
• Take Profits:
o TP1: 3,690
o TP2: 3,685
o TP3: 3,680
👉 Expect engineered stop-runs into premium before fading lower.
________________________________________
🔑 Strategy Note
Gold’s break above $3,700 highlights strong bullish sentiment, but the Fed decision risk suggests smart money may sweep liquidity both ways. Stay flexible: short from premium zone (3,696–3,694), and defend longs at demand zones (3,674–3,665 and 3,636–3,638). Use lighter position sizing until post-Fed clarity emerges.

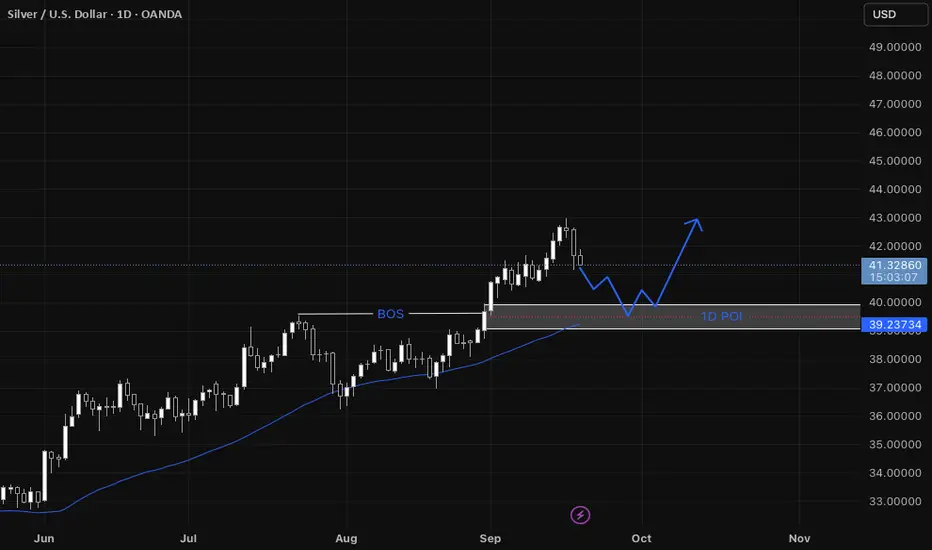
XAGUSD Step-by-step entry plan for XAGUSD
1. We have our Daily Point of Interest (POI)
- On the daily a zone that contains:
* a fair value gap (FVG),
* a break of structure (BOS) that previously acted as resistance and is now expected to act as support, and
* support from the 44 SMA.
2. Wait for price to return to the Daily POI
- Only consider the setup if price actually comes back into that daily POI zone.
3. Switch to the 1-hour timeframe to refine the entry
- Look for a shift in structure on the 1-hour (i.e., evidence that momentum is shifting bullish: BOS to the upside, higher highs/higher lows).
4. Confirm a 1-hour fair value gap forms
- The structure shift on 1-hour should create a 1-hour FVG (a short intraday imbalance).
5. Wait for the 1-hour FVG to be filled
- Let price fill that 1-hour FVG (price moves into/through the gap).
6. Look for a bullish confirmation on the filled 1-hour FVG
- After the fill, require a clear bullish formation on 1-hour (examples: bullish engulfing candle, strong demand candle, a higher-low + rejection wick).
7. Enter on the 1-hour bullish confirmation
- Enter when price breaks the confirmation level (e.g., breaks above the local 1-hour high formed by the bullish setup) or on a confirmed bullish candle close per your entry rules.
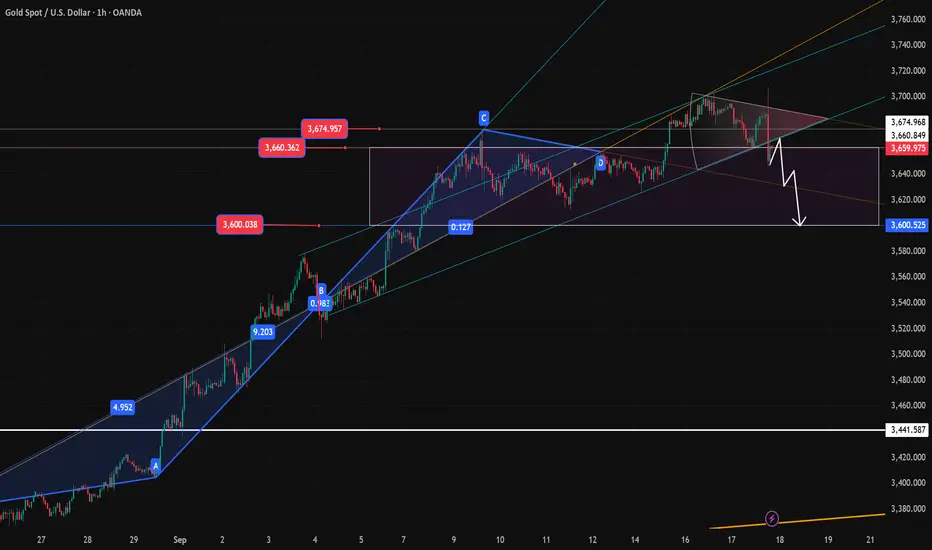
Elliott Wave Analysis XAUUSD – September 18, 2025
Momentum
• D1: Currently, D1 momentum is declining, therefore a downward move is likely to extend over the next 4–5 days.
• H4: Momentum is falling, so today we may see further downside to push momentum into the oversold zone before a potential reversal.
• H1: Momentum is still heading down, suggesting the bearish move is likely to continue.
________________________________________
Wave Structure
• D1: With momentum turning lower, it is highly probable that wave v black has completed and price has entered a corrective ABC phase. If this is the case, the correction will likely last for at least more than one week.
• H4: A 5-wave structure (1–2–3–4–5) within wave v black has been completed. The current decline could be wave A of the correction. We need to observe closely to confirm whether wave A is done. Note: during corrective phases, trading becomes more difficult; targets beyond 500 pips are rarely achieved as price tends to overlap. Toward the end of corrections, price often compresses and whipsaws both sides, so trade with smaller positions and manage risk carefully.
• H1:
o Scenario 1: Wave 1 of wave (5) black has formed, and the market is now in wave 2. This scenario is invalidated if price breaks below 3626.
o Scenario 2: Wave v black has already completed with a 5-wave structure. Price is now in a larger corrective phase (i–ii–iii–iv–v black on the D1). In this case, the correction will likely last longer than previous waves ii and iv – an important guide to prepare for an extended bearish or sideways phase.
On H1, the current drop is steep and impulsive, likely part of a 5-wave structure. The recovery was capped at the 38.2% Fibonacci retracement, which indicates:
• If this is wave 4 of the decline, price will break below 3649, with wave 5 of A projected toward 3632 → Buy zone.
• If price breaks above the minor high at the 38.2% Fibonacci level, it is more likely wave B of an ABC correction. In that case, the upside targets would be 3677 or 3694 → Sell zones.
⚠️ Note: Once price hits one target, the opposite entry setup will be canceled.
________________________________________
Trading Plan
Buy Zone:
• Entry: 3633 – 3630
• SL: 3620
• TP: 3649
Sell Zone 1:
• Entry: 3676 – 3679
• SL: 3686
• TP: 3657
Sell Zone 2:
• Entry: 3693 – 3696
• SL: 3703
• TP: 3677

Next Day's Trend: Short Gold on RalliesNext Day's Trend: Short Gold on Rallies
The following is a reassessment of gold's technicals following the Fed's rate cut decision:
1: Spot gold experienced a sharp correction, breaking through key support levels such as 3680 and 3650.
2: The short-term technical structure was broken, shifting the market from bullish to bearish, entering a technical correction.
3: The 4-hour and daily charts are clearly bearish.
Gold prices broke through the short-term moving average system with a large black candlestick pattern, forming a bearish "dark cloud cover" pattern.
4: Bears are currently in full control of the short-term trend. Any rebound is likely to face renewed selling pressure, and a trend reversal will take time to recover.
5. Key Resistance: $3620-3627 (previous support, now initial resistance)
6. $3655-3665 (stronger resistance). Any rebound in gold prices will first be tested at these levels.
Failure to break through these levels suggests a potential downtrend.
Macro Support Levels:
1. $3,600 (Important Psychological Level)
2. $3,570-3,580 (Near the 50-Day Moving Average)
3. $3,550 (Deeper Retracement Level)
Summary: $3,600 is crucial. A break below this level would open a downtrend towards the $3,550-3,580 area.
Trading Strategy:
Primarily short on rallies, watching for a rebound to resistance around $3,680 or $3,670. Any resistance below this level could be a shorting opportunity. Avoid blindly buying on dips.

FED countdown | Buy at support, Sell at resistanceXAU/USD – 17/09 | Captain Vincent ⚓
🔎 Captain’s Log – News Context
18/09, 01:00 (US time): FED rate decision + Dot Plot → policy outlook for upcoming meetings
01:30: Powell’s speech – the key market focus
Market consensus: FED almost certain to cut -25bps. However, the -50bps scenario still exists → if it happens, it will be a “big boost” for Gold
During Asia–Europe session, Gold faced early profit-taking, dropping quickly to 3,677 – 3,675, reflecting caution ahead of the FED
⏩ Captain’s Summary
Gold is making a technical pullback before the FED.
Medium-term trend remains bullish, but patience is needed to wait for better Buy entries.
📈 Captain’s Chart – Technical Analysis
Storm Breaker (Resistance / Sell Zone)
Nearby OB: 3,693 – 3,695 (short scalp)
ATH Zone: 3,717 – 3,720 (strong resistance, potential heavy selling)
Golden Harbor (Support / Buy Zone)
Shallow Dock: 3,656 – 3,657 (short-term)
Main Harbor: 3,629 – 3,630 (trendline confluence + old BoS)
Market Structure
Multiple BoS confirm bullish trend
Price retracing to support, likely to bounce back and test 3,693 – 3,717
Break above 3,720 → confirms new ATH
🎯 Captain’s Map – Trade Plan
✅ Buy (priority)
Buy Zone 1
Entry: 3,656 – 3,657
SL: 3,648
TP: 3,675 – 3,693 – 3,717
Buy Zone 2
Entry: 3,629 – 3,630
SL: 3,618
TP: 3,656 – 3,690 – 3,717
⚡ Sell (only at resistance)
Sell Zone OB
Entry: 3,693 – 3,695
SL: 3,705
TP: 3,690 – 3,685 - 3680 - 368x - 36xx
Sell Zone ATH
Entry: 3,717 – 3,720
SL: 3,727
TP: 3,715 – 3,710 – 3,705 - 37xx
⚓ Captain’s Note
“Before the FED countdown, profit-taking waves pulled the Golden ship toward Golden Harbor 🏝️ (3,656 – 3,629) .
Yet the main current still flows north, the bullish trend remains intact.
Storm Breaker 🌊 (3,693 – 3,720) is the big wave, suitable for short Quick Boarding 🚤 scalps.
Sailors must stay patient – the FED wind could be the force to propel Gold to new peaks.”

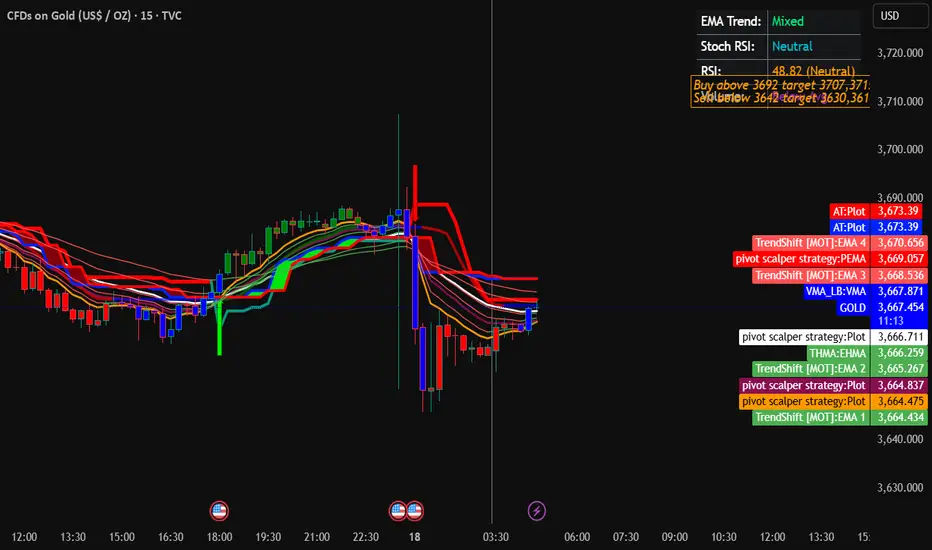
Gold Trading Strategy for 18th September 2025📊 Gold (XAU/USD) Trading Strategy
🔔 This is a structured intraday setup for Gold. Follow carefully with strict risk management.
✨ Buy Setup (Bullish Scenario)
🔼 Condition to Enter Long:
Wait for a 1-Hour Candle Close above $3692.
Entry is valid only if the candle closes above this level, not just a spike.
💰 Entry Price: Above $3692
🎯 Profit Targets:
1️⃣ First Target: $3707 (Quick scalp level)
2️⃣ Second Target: $3715 (Moderate resistance zone)
3️⃣ Third Target: $3728 (Extended bullish move)
🛡️ Suggested Stop-Loss: Place a protective stop below $3682 (approx. 10 points below breakout level).
✨ Sell Setup (Bearish Scenario)
🔽 Condition to Enter Short:
Wait for a 15-Minute Candle Close below $3642.
Entry is valid only if the candle closes below, not just a wick test.
💰 Entry Price: Below $3642
🎯 Profit Targets:
1️⃣ First Target: $3630 (Initial support break)
2️⃣ Second Target: $3618 (Deeper push)
3️⃣ Third Target: $3605 (Major support zone)
🛡️ Suggested Stop-Loss: Place a protective stop above $3652 (approx. 10 points above breakdown level).
⚠️ Risk Management & Notes
Always use strict stop-loss to protect capital.
Do not over-leverage; risk only 1–2% of your capital per trade.
Wait for candle close confirmation before entering. Avoid emotional entries.
If first target is achieved, consider trailing stop-loss to secure profits.
Trade only when market conditions align with your plan.
⚠️ Disclaimer
📌 This content is shared for educational & informational purposes only.
📌 This is not financial advice. Always do your own analysis before taking trades.
📌 Trading in gold, forex, and commodities carries significant risk of capital loss.
📌 Past performance does not guarantee future results.
Next Steps in Gold Day Trading: Shorting with the TrendNext Steps in Gold Day Trading: Shorting with the Trend
Spot gold experienced significant volatility during the Fed's interest rate decision and Powell's speech.
During Powell's speech, spot gold prices continued to decline, falling over 1% intraday to below $3,650/oz, nearly $60 below the intraday high.
While the market eagerly anticipated the expected 25 basis point rate cut, Powell's guidance on the path of future rate cuts clearly fell short of the dovishness expected by the market.
This "buy the expectation, sell the reality" strategy caused gold prices to initially rise, then rapidly fall.
Prior to the meeting, gold prices were significantly overbought and in need of a technical correction.
The Fed's news merely provided a catalyst for a pullback.
Technical Analysis:
Downside Support Levels:
Short-term Support Level: $3,645 (bullish flag breakout point)
Important Support Level: $3,633 (horizontal support); a break below this level could lead to a drop to the $3,610-3,600 range. Stronger support levels: $3562-3560 area and the psychologically important $3500 level.
Many analysts believe this pullback could be a healthy technical correction, and that gold's long-term bull market fundamentals remain solid.
Trading Strategy Recommendations:
For short-term traders, aim to profit on a rebound or further decline after a pullback, and maintain a tight stop-loss.
1: Cautiously long from now on:
First entry point: Around $3640-3645
Second entry point: $3620-3630 range
Consolidated stop-loss: Below $3610
First target: $3670-3680
Second target: $3700 (reduce or close positions)
Put on a technical rebound on a pullback to the "bullish flag" breakout point and horizontal support.
2: Short with the trend: Short on a rebound to the $3675-3685 range and stagnate.
Stop loss: above 3700 points
First target: 3650 points
Second target: 3630-3640 points
Bets that the Federal Reserve will not be as dovish as expected continue to persist. Capitalize on rallies to resistance levels and profit from pullbacks.
Analysis of the Most Likely Future Gold Price TrendAnalysis of the Most Likely Future Gold Price Trend
Watch for fluctuations above $3,600.
Based on the combination of expected rate cuts and hawkish dot plot guidance, the gold market logic has shifted:
Short-term trend:
Technical adjustments and downward volatility.
The market needs to digest the impact of a hawkish stance and previous heavy profit-taking.
The most likely trend for gold prices is a repeated struggle around the $3,600 mark.
If $3,600 is effectively broken, gold prices will fall further to $3,570-3,580 (50-day moving average) for support, and may even test $3,550.
A rebound would be an opportunity to short on rallies, not the start of a trend reversal.
The main resistance level for the rebound is around $3,620.
Summary: The Fed's tough rate cuts have dealt a heavy blow to gold bulls. The short-term technical outlook has turned bearish, and gold prices are entering a correction.
In terms of operations, we should shift from the previous "buy on dips" approach to "short on rebounds" and pay close attention to the rise and fall of the key level of $3,600.
Gold Trading Strategy | September 17-18🎉 Congratulations to our members who followed our trading strategy — today’s trades yielded over 500+ pips in profit!
✅With the Federal Reserve’s interest rate decision released, gold faced resistance above 3700 and entered a phase of high-level consolidation and pullback. The short-term outlook is weak, with attention on the 3660–3650 support zone. If this level breaks, the price may extend its decline toward 3630–3625.
Moving Averages: MA5 and MA10 are flattening with signs of a bearish crossover, while MA20 (around 3627) remains upward-sloping, providing mid-term support.
Bollinger Bands: Price has retested the mid-band support near 3675; if this level fails, a further move toward 3627 is likely.
✅ Trading Strategy Reference:
If the price rebounds to the 3670–3675 area and holds, consider short positions, with targets at 3630–3625.
🔥Trading Reminder: Trading strategies are time-sensitive, and market conditions can change rapidly. Please adjust your trading plan based on real-time market conditions. If you have any questions , feel free to contact me🤝

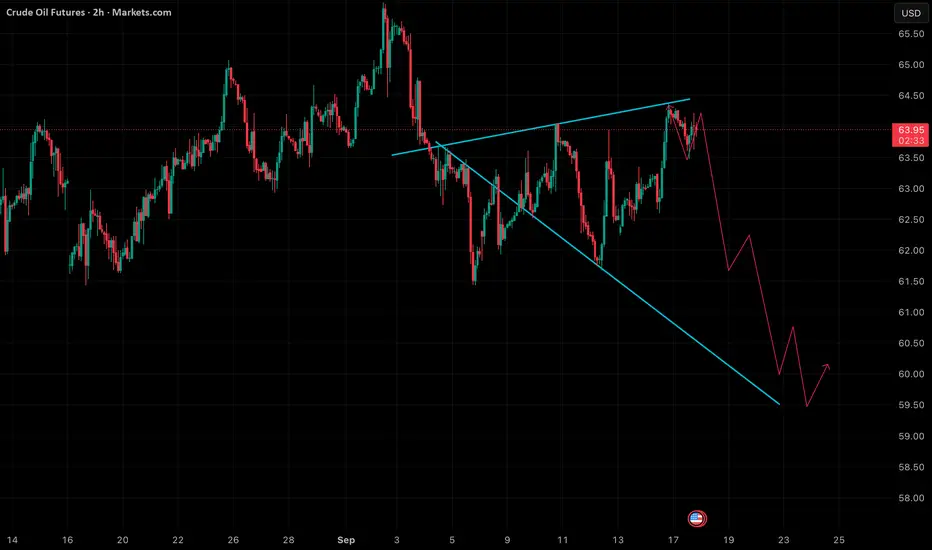
Freud oil analysisPresently crude in negative zone with Wolfe wave pattern expecting go down sharply…
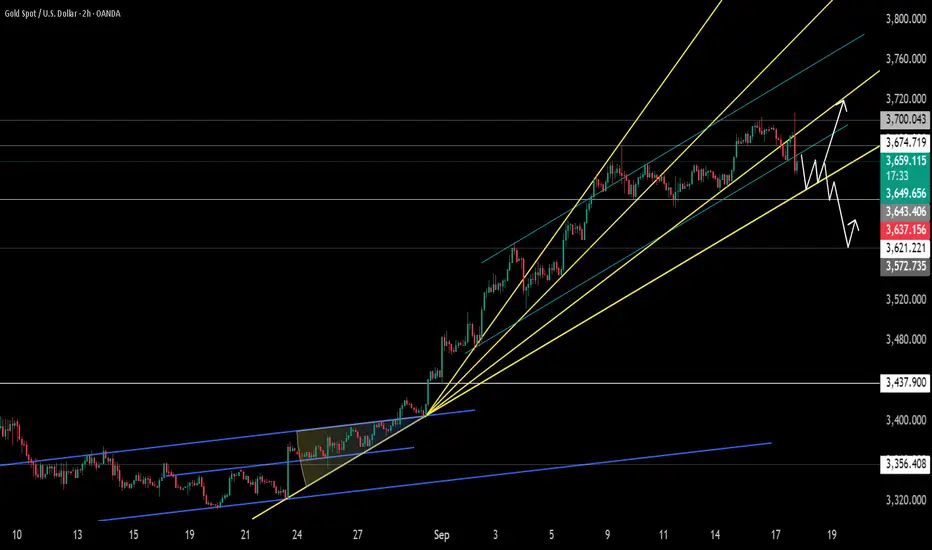
LiamTrading – XAUUSD OutlookSharing my personal view on the possible next move for gold.
Based on the current chart structure, the wave formation suggests that XAUUSD is most likely in Wave 4. The correction started yesterday after price touched the 3,700 mark – a round resistance level which also coincides with the 1.618 Fibonacci extension. This area often attracts heavy liquidity, and the subsequent pullback further supports the view that Wave 4 has been activated.
At present, the key support to watch is 3,675. If this level breaks, the corrective structure could complete around 3,656. On the H1 timeframe, the RSI has moved below the 30 level, indicating oversold conditions. In my view, while the market remains in this phase, it is still preferable to look for selling opportunities, though patience is needed until clearer confluence signals appear.
Trading plan (short-term focus):
Sell entry 3685–3687, SL 3693, TP 3670 – 3656
Buy entry 3656–3654, SL 3648, TP 3675 – 3690 – 3702 – 3721 – 3740
I will continue to share further updates if there are significant moves in price. Wishing everyone successful and effective trading.

Why wait for FOMC when you can book 1:10 in GOLD like this...Took a beautiful trade in gold, went pretty well.
Done and dusted, will eat popcorn while FOMC happens.
ALL THE BEST EVERYONE
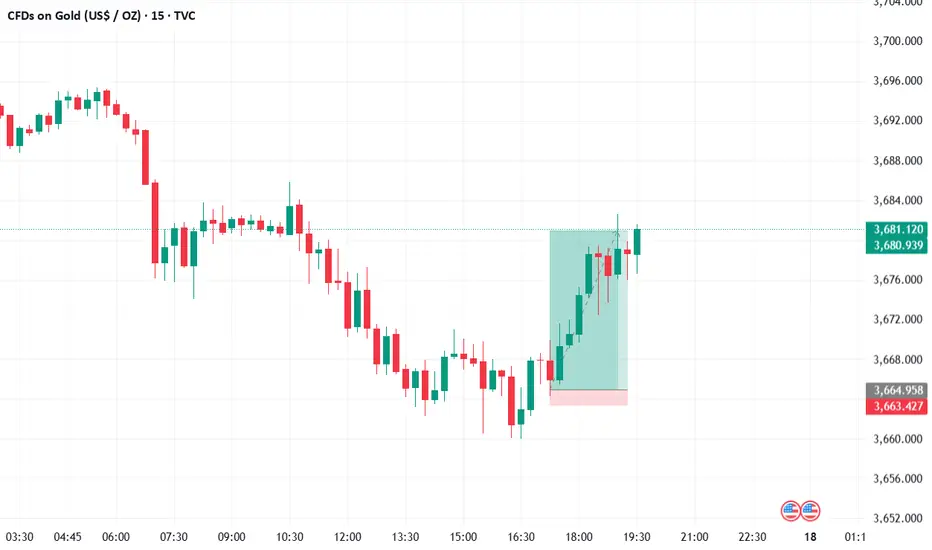
XAUUSD : 16th Sept 25 - TP HIT1. Fakeout formed during Pre NY session
2. Price broke support and price retraced back to support during NYSE open session
3. Once resistance confirmed , entered sell side on BPCL
4.Fake out , Breakdown ( Pre NY ) + Retrace ( NYSE open )
5. Secured 90% partials @ 1:1

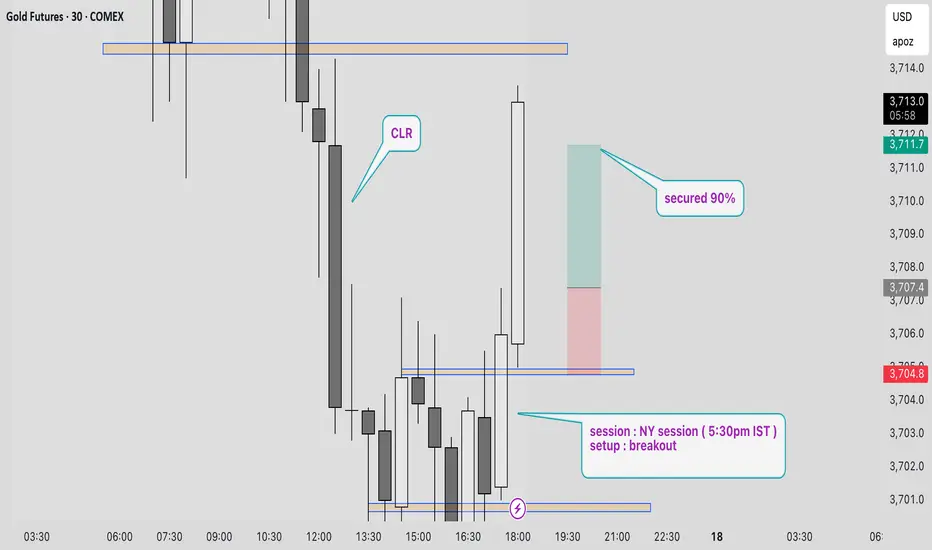
XAUUSD : Sept 17th - TP HIT1. Planned a reversal trade
2. Clean range is present to the left side
3. Breakout happened at NY session above resistance
4. Anticapated volume push during NY session
5.Secured 90% partials at 1:1.5
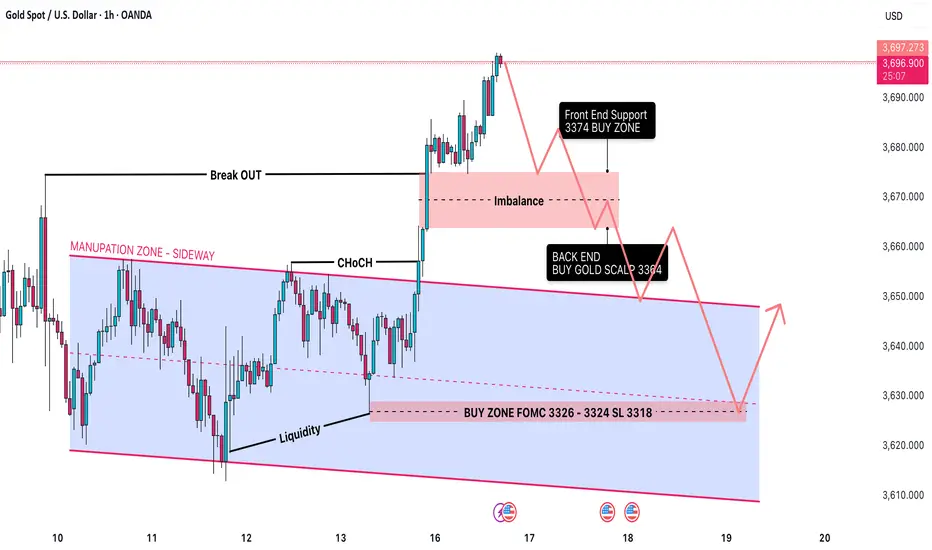
FOMC XAUUSD: Time to Hold Super SELL before FOMC🟡 XAUUSD Daily Trading Plan – Ahead of FOMC
📊 Market Context
Gold (XAUUSD) has recently moved out of its accumulation/manipulation zone and is now trading in the 3,684–3,690 range.
The market structure is bullish after a Change of Character (CHoCH) followed by a Break of Structure (BOS).
Still, imbalances remain below the present price level, suggesting the possibility of a retracement before further upside continuation.
Liquidity pools are forming around 3,721–3,725, which increases the risk of false breakouts (liquidity traps) near the FOMC.
🔎 Technical Analysis (SMC Perspective)
Structure: Bullish bias on H1/H4, confirmed by higher highs and BOS.
Imbalance Zone: 3,674 → 3,664 (likely to be revisited).
Liquidity Pools:
Buy-side liquidity: 3,721–3,725 (Sell Zone).
Sell-side liquidity: 3,626–3,624 (Equal Low Zone).
🔑 Key Levels
Resistance / Sell Zones
3,686.88 (Immediate resistance)
3,721–3,725 (Liquidity Sell Zone)
Support / Buy Zones
3,668 (Front End Buy – imbalance retest)
3,656–3,654 (Back End CP Buy Zone)
3,626–3,624 (Equal Low Liquidity Zone)
✅ Priority Scenario – BUY
Entry 1
Buy Limit: 3,668 (Front End Zone – imbalance retest)
SL: 3,661
TP: 3,690 → 3,700 → 3,721
Entry 2
Buy Limit: 3,656–3,654 (Back End CP Buy Zone)
SL: 3,648
TP: 3,690 → 3,700 → 3,721
Entry 3
Buy Limit: 3,626–3,624 (Equal Low Liquidity)
SL: 3,618
TP: 3,690 → 3,700 → 3,721
🔻 Alternative Scenario – SELL (Counter-trade)
If the price touches 3,721–3,725 (Liquidity Zone) before revisiting the lower buy zones → look for rejection patterns.
Enter SELL if bearish confirmation appears.
SL: 3,730
TP: 3,698 → 3,690 → 3,676
⚠️ Risk Management & Notes
Expect high volatility during FOMC – liquidity traps are very likely.
Reduce lot size before the news release to minimise risk.
Take trades only with confirmation (avoid blind buys/sells).
Main directional bias: Bullish as long as 3,648 holds.
Gold technical analysis Gold has been up n up side many reason for upside rally U.S economy, Trump tariffs , Ukraine Russia war . But again I see upside gold $3695 major resistance and support both. And then fly up to 3732. And new design represents “ lights of diva “. 🔥

Gold (XAUUSD) FOMC Forecast – 17 Sept 2025Gold (XAUUSD) FOMC Forecast – 17 Sept 2025
Current Price: ~3666
Key Levels Identified:
Resistance R1: ~3700
Trendline Resistance R2: ~3780
Support S1: ~3623
Support S2: ~3540
📰 News Impact Projection:
If the Federal Reserve Cuts the Funds Rate
Expect bullish momentum.
Strategy: Buy after a retest above Resistance R1 (~3700).
Target: Trendline Resistance R2 → ~3780.
If the Federal Reserve Increases the Funds Rate
Expect bearish momentum.
Strategy: Sell after a retest below Support S1 (~3623).
Target: Support S2 → ~3540.
⚠️ Stop Loss (SL):
Around 3658, near current consolidation zone.
🎯 Summary
Bullish case (Rate Cut): Buy above 3700 → Target 3780.
Bearish case (Rate Hike): Sell below 3623 → Target 3540.
Market direction will strongly depend on FOMC Funds Rate decision.

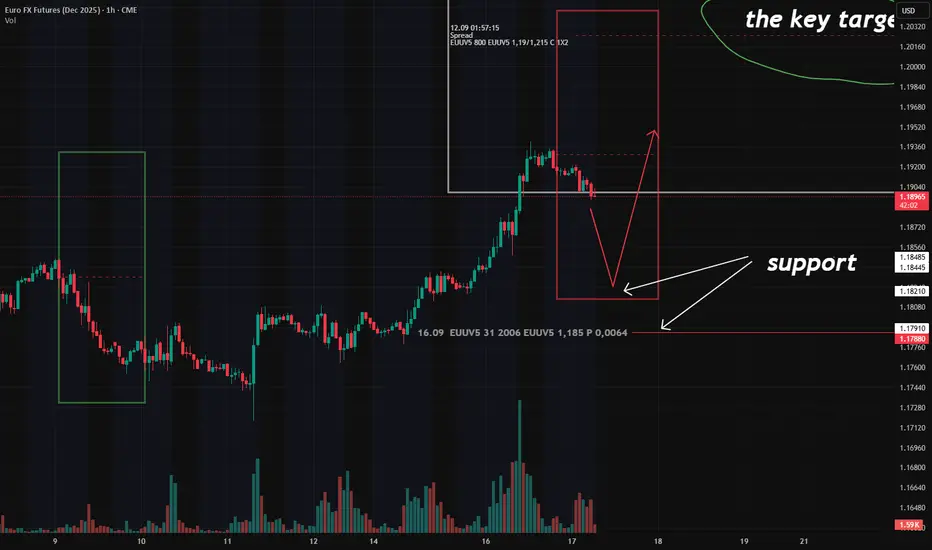
Market Sentiment: Optimism for Euro – But Here’s My Plan According to last CME report, there’s clear bullish sentiment across major currencies trading against the US dollar.
We’re seeing naked calls placed at multiple levels above current prices:
1.38 on GBP
1.295 on CHF
In other words: options traders are pricing in further USD weakness.
This aligns with earlier signals:
1.The JPY 'Butterfly' (still active)
2. The EUR 'Ratio spread' — also still in play
So what’s my move today?
✅ First: I exited all positions this morning.
No overexposure ahead of the Fed decision.
🎯 Now: I’m watching for long entries near the ER zone (see chart).
Notably, just below ER low boundary - put at 1.185 (act as support), which appeared in the report.
The option is worth ~$900K — not huge, but significant enough to catch my eye.
I’ll watch closely — and only enter if price respects it.