Part 2 Support and ResistanceOption Trading in India
India has seen a boom in retail options trading.
1. Exchanges
NSE (National Stock Exchange): Leader in index & stock options.
BSE (Bombay Stock Exchange): Smaller but growing.
2. Popular Underlyings
Nifty 50 Options (most liquid).
Bank Nifty Options (very volatile).
Stock Options (Infosys, Reliance, HDFC Bank, etc.).
3. SEBI Regulations
Compulsory margin requirements.
Weekly index expiries (Thursday).
Physical settlement of stock options at expiry.
Put Options (Right to Sell)
A Put Option gives the holder the right to sell at a strike price. Used when expecting prices to fall.
Example: Buying Infosys ₹1,500 Put at ₹50 premium pays off if Infosys drops below ₹1,450.
Option Market Participants
Hedgers: Reduce risk by using options as insurance. (e.g., farmer hedging crop price, or investor protecting stock portfolio).
Speculators: Bet on price movements to earn profits.
Arbitrageurs: Exploit price differences across markets.
Writers (Sellers): Earn premium by selling options but take on higher risks.
Futures market

Gold Trading Strategy XAUUSD September 5, 2025Gold Trading Strategy XAUUSD September 5, 2025: Gold rebounds after correction, market eyes on NFP data and Donald Trump's surprise statement for the week.
Fundamentals: Spot gold prices experienced extreme volatility on Thursday, with intraday swings reaching $53 before closing lower, currently trading at $3,557/oz, representing a gain of about $11 on the day. Gold's slight decline also reflects traders taking profits from the recent incredible rally. Investor focus now shifts to today's Non-Farm Payrolls report, which is expected to provide clues on the Federal Reserve's policy direction.
Technical analysis: Yesterday's strong decline showed investors' short-term profit-taking, but the current gold price is still trading above 3500. We continue to trade according to the main trend, waiting for support areas for long-term trading.
Important price zones today: 3525 - 3520 and 3495- 3500.
Today's trading trend: BUY.
Recommended orders:
Plan 1: BUY XAUUSD zone 3515 - 3517
SL 3512
TP 3520 - 3530 - 3550 - 3580.
Plan 2: BUY XAUUSD zone 3498 - 3500
SL 3495
TP 3503 - 3513 - 3530 - 3550.
Wishing you a safe, effective and profitable weekend trading day.🥰🥰🥰🥰🥰

Gold Price Analysis – Testing Resistance near Sell ZoneAnalysis:
Gold (XAU/USD) is currently trading around 3,551.40, showing minor intraday losses (-0.03%). The chart indicates a strong resistance zone between 3,556–3,563, identified as the “sell zone,” with an All-Time High (ATH) slightly above at 3,578.12. Price is consolidating beneath this resistance, struggling to break higher.
The Fair Value Gap (FVG) below suggests a potential retracement toward 3,511–3,520 if sellers gain momentum. The Ichimoku cloud shows mixed signals, with price hovering around the equilibrium, indicating indecision in the short term.
A break above 3,563 could trigger bullish continuation toward ATH, while rejection at this level may lead to a pullback into the highlighted FVG region.

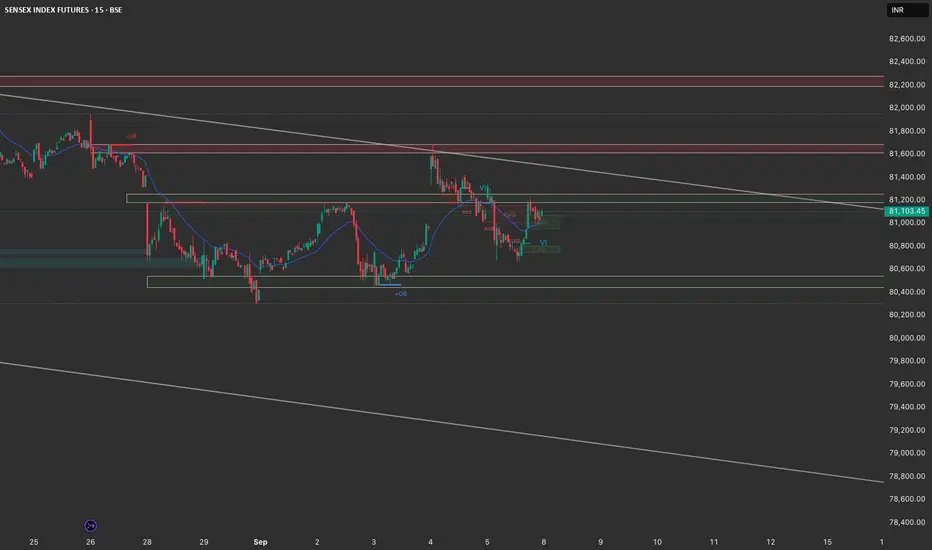
Sensex Structure Analysis & Trade Plan : 8th September🔎 Multi-Timeframe Market Structure
4H Chart
Price is still respecting the descending channel.
Recent rejection came right from the channel supply + OB zone ~81,600–81,800.
Support demand holds near 80,600–80,750, which has been tested multiple times.
Market is consolidating between 80,600–81,600.
Bias: Range-bound inside larger downtrend. Unless 81,800 breaks, structure remains corrective.
1H Chart
Clear swing high rejection at 81,600.
Price retraced to FVG + demand block around 80,700–80,800, and bounced.
Currently trading near 81,100–81,200 (mid-channel zone).
Liquidity pools visible above 81,600 (short-trap potential).
Bias: Intraday bullish bias from demand zones, but still capped by channel supply.
15M Chart
Short-term MSB → BOS → Retest seen near 80,700.
Price is consolidating just below minor resistance 81,200–81,300.
Imbalances (FVG) left around 80,900–81,000 may get filled if market dips.
Bias: Short-term bullish continuation possible, but supply zones overhead are heavy.
📊 Trade Plan (Next Session)
Bullish Scenario (if demand holds 80,700–80,900)
Entry: 80,900–81,000 (on retest/fill of imbalance).
Targets:
TP1 → 81,300 (minor resistance).
TP2 → 81,600–81,800 (channel supply + OB).
Stop: Below 80,650.
Bearish Scenario (if rejection continues at 81,300–81,600)
Entry: 81,200–81,400 zone (look for rejection candle).
Targets:
TP1 → 80,900.
TP2 → 80,600–80,500 (major demand).
Stop: Above 81,650.
🎯 Summary
Intraday bias: Mildly bullish until 81,600–81,800 is tested.
Swing bias: Still bearish inside descending channel unless a clear breakout >81,800–82,000 occurs.
Best trade idea: Buy dips around 80,900–81,000 with TP towards 81,600, then watch for reversal signs.
NIFTY @ 24828. Will HISTORY Repeat?LTP: 24828
Supports: 24389/23830/23587
Resistances: 25025/155/2579626440
As long as the above supports hold, we can see 25300 first.
Further 25877, 26190, 26819 (ultimate target), 27234+++.

Gold Slips After Peak: Trade Fed Uncertainty & Jobs Report!Hello traders! Gold (XAU/USD) pulled back on Thursday (04/09/2025) as investors took profits after its record-breaking rally, with focus now shifting to the upcoming US jobs report for fresh signals on the Fed’s policy path. Spot gold closed down 0.3% at $3,547.68/oz—is this a buying dip or a reversal? Let’s dive in and uncover trading setups! 💰
Fundamental Analysis: What’s Behind Gold’s Dip & Potential Rebound? 🌟
Profit-Taking Post-Record: Gold eased after hitting an all-time high of $3,578.50/oz on 03/09, driven by weak job openings data that bolstered rate cut bets and ongoing uncertainty fueling safe-haven demand. 📉
US Jobs Report Looms: Set for release tomorrow (05/09), this key report follows early-session data showing US jobless claims rising more than expected last week, signaling a softening labor market.
Fed Signals & Rate Cut Buzz: Several Fed officials on 03/09 highlighted labor market concerns, reinforcing confidence in rate cuts. Markets now see a 98% chance of a 0.25% rate cut this month, per CME FedWatch. As a non-yielding asset, gold thrives in low-rate and uncertain environments! 🏦
Fed Drama Heats Up: Trump’s attempt to fire Fed Governor Lisa Cook has sparked a serious legal challenge, raising fresh concerns about Fed independence. Coupled with tariff tensions (Trump’s appealing to the Supreme Court after two lower court losses), this is eroding USD asset confidence and boosting gold demand.
Bullish Outlook: Standard Chartered predicts further gains, citing persistent tariff uncertainty and Fed independence fears as key safe-haven drivers.
Technical Analysis: Consolidation Before Big Data—Buy Dips or Wait? 📉
Gold has been trading in an uptrend channel, with early-session accumulation. After a strong Asian session push, it hit the 356x OB zone and dropped quickly. The European session may see sideways action, awaiting tonight’s critical data. If gold holds the channel, bulls could take charge—watch for breakouts!
Key Resistance: 3560 - 3576 - 3586
Key Support: 3540 - 3526 - 3500 - 3490 - 3476
Trading Opportunities:
Sell Scalp: 3558 - 3560
SL: 3564
TP: 3555 - 3545 - 3535
Sell Zone: 3576 - 3578
SL: 3587
TP: 3568 - 3558 - 3548 - 3538
Buy Scalp: 3526 - 3524
SL: 3520
TP: 3529 - 3539 - 3549
Buy Zone: 3500 - 3498
SL: 3490
TP: 3508 - 3518 - 3518 - 3538
Gold’s in consolidation mode, but the jobs report could trigger a breakout—manage risk tightly! If it holds above supports, bulls may push for new highs post-data. 📊💡
#Gold #XAUUSD #Fed #USJobs #TradingView #MarketUpdate #Forex #Investing #TechnicalAnalysis #GoldTrading #Finance #Crypto

Gold (XAUUSD) forming wonderful sell scenarioGoldUSD price is moving at higher side and showing weakness. It is also forming double top kind of scenario. We may see a good short trade if liquidity sweep is witness at the resistance level with the additional confirmation of higher volume. Overall trend is still upside but buyers seems exhausted. We may find a good sell trade if Liquidity sweeps at resistance and everything goes as we planned.
1. Price is approaching 4H resistance zone. Which may act as a strong supply zone.
2. Buying is slow and weak.
3. Most probably price will take liquidity of resistance zone and break trend line.
4. After breaking trend line it should pullback till resistance/trend line or any newly created OB/FVG.
All these combinations are signalling a high probability and high Risk and Reward (1:8) trade scenario.
Note – if you liked this analysis, please boost the idea so that other can also get benefit of it. Also follow me for notification for incoming ideas.
Also Feel free to comment if you have any input to share.
Disclaimer – This analysis is just for education purpose not any trading suggestion. Please take the trade at your own risk and with the discussion with your financial advisor.

Gold: Profit-Taking Before NFP, Main Trend Still BullishHello everyone, after a strong rally, gold has seen a short-term pullback. On the daily chart, this looks more like profit-taking at historical highs rather than a reversal. The broader structure remains intact: price holds above the Ichimoku cloud, the Kijun is sloping upwards, and layered demand FVG zones sit right below—typical of a healthy uptrend.
In terms of levels, immediate resistance is 3,555–3,565; a clear daily close above would naturally open the path towards 3,600–3,620. On the downside, the key buffer lies at 3,525–3,510 (clustered FVG + upper edge of the cloud). Only a decisive daily close below 3,510 would raise risks of a deeper correction towards 3,480–3,450.
News flow also explains the pause: ETF outflows and caution ahead of NFP have capped momentum. Yet, with safe-haven demand still present (as labour data and PMI suggest economic risks), I see this more as profit-locking than a trend reversal.
NFP scenarios: if the numbers are strong (USD/yields ↑), gold could retreat to 3,525–3,510; losing this zone would expose 3,480–3,450. If data is weak (USD/yields ↓), odds of breaking 3,565 are high, opening the way to 3,600+.
Overall, the main trend stays bullish as long as 3,525–3,510 holds. After NFP, a daily close above 3,565 would clearly confirm continuation.
Do you think gold will break 3,565 right after NFP and aim for 3,600+, or pull back once more to test support first? Share your view below.

Trade the Fed Drama & Jobs Data Wave!Fundamental Analysis: Why Gold’s Rally Is Unstoppable 🌟
Historic Surge: Gold soared to an all-time high before US jobs data showed a sharper-than-expected drop in July 2025 openings and steady hiring, pointing to a softening labor market. This fueled gold’s rise, with $3,600/oz as the next target. 📈
Fed Rate Cut Fever: Post-data, the odds of a 0.25% rate cut at the Fed’s Sept 16-17 meeting jumped from 92% to 98%, per CME FedWatch. Fed Governor Christopher Waller stressed the need for a cut this month, with future moves tied to economic trends. 🏦
Key Data Ahead: All eyes are on today’s (04/09) ADP employment and US jobless claims, plus the big monthly payrolls report on 05/09. These could steer the Fed’s path and gold’s trajectory.
Fed Drama Boosts Gold: On Sept 3, Fed Governor Lisa Cook pushed back against Trump’s attempt to oust her, while Trump keeps slamming Chair Jerome Powell for not cutting rates. Worries about Fed independence are shaking confidence in USD assets, making gold the go-to safe haven. Trump’s also gearing up to appeal tariffs to the Supreme Court after two lower court losses. ⚖️🇺🇸
Gold’s Sweet Spot: As a non-yielding asset, gold shines in uncertain times and low-rate environments—perfect for India’s gold-loving market!
Technical Analysis: Bullish Run Continues, Buy Dips but Watch Reversals! 📉
After the Asian session opened, gold plunged to the 351x zone before bouncing back above 352x. This could be big players flushing out retail liquidity—a classic move during relentless all-time highs (ATHs) that create large FVGs. Stick to BUY if gold holds above 352x, but if it fails to break 365x today, brace for a SELL reversal, especially with ADP Nonfarm data incoming. Stay sharp for volatility!
Key Resistance: 3545 - 3561 - 3578 - 3586 - 3596
Key Support: 3521 - 3508 - 3493 - 3475
Trading Opportunities:
Sell Scalp: 3560-3562
SL: 3566
TP: 3557 - 3552 - 3547
Sell Zone: 3594 - 3596
SL: 3604
TP: 3586 - 3576 - 3566 - 3566 - 3546
Buy Scalp: 3508 - 3506
SL: 3502
TP: 3511 - 3516 - 3521
Buy Zone: 3493 - 3491
SL: 3483
TP: 3501 - 3511 - 3521 - 3531 - Open
Gold is blazing, but today’s data could shake things up—keep your risk tight! If it stays above 352x, bulls might charge to new highs. 📊💡

Gold 05/09: Ready to Scalp the Drop or Buy the Dip?🟢 Market Context
Gold is currently showing a short-term bearish setup after a ChoCH (Change of Character) near 3,536.556. The market is rejecting supply and forming liquidity sweeps around the 3,531–3,533 zone. Expect price to pull lower towards demand areas before the next bullish leg.
📍 Key Levels & Trade Plan
🔴 Intraday Sell (Scalp Opportunity)
• Entry: 3,531 – 3,533
• Stop Loss: 3,535
• Target: 3,485
🟢 Swing Buy Zones
Buy Zone 1: 3,475 – 3,477
o Stop Loss: 3,470
o Target: 3,508 – 3,526
Buy Zone 2 (Deeper Discount): 3,441 – 3,443
o Stop Loss: 3,435
o Target: 3,500+
⚖️ SMC Bias
• Short-term: Bearish scalp from supply zone.
• Mid-term: Looking for liquidity grab and bullish reversal at demand zones.
• Long-term: Maintaining bullish order flow as long as deeper demand (3,441) holds.

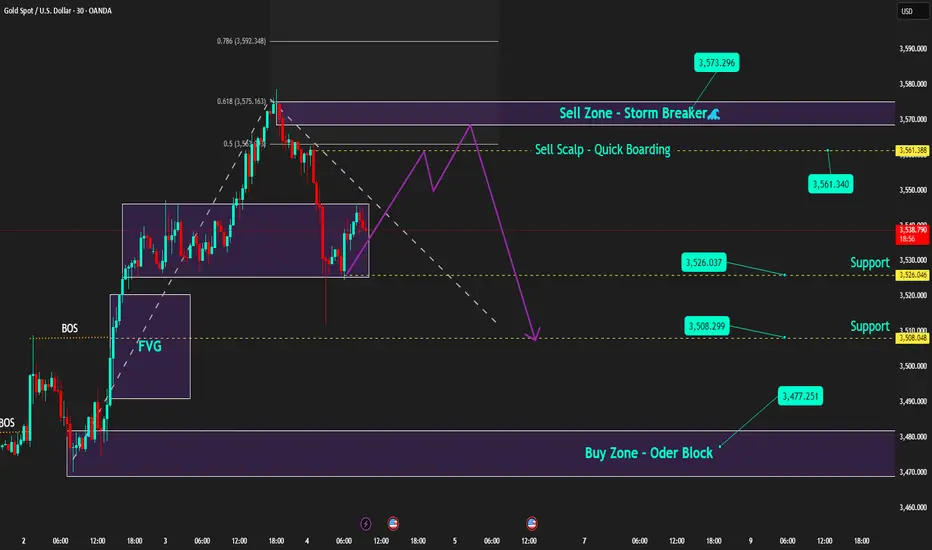
FED dovish, Gold stays bullish; SELL only for scalps⚓️ Captain Vincent – Gold Plan XAU/USD
1. Market Wave 🌍
The probability of a FED rate cut in September surged to 96.6% (vs 90.4% earlier) after the JOLTS report showed weakening job prospects.
Several FED officials, from Kashkari to Bostic, shifted dovish. Only Musallim maintained a hawkish stance with a scenario of just one cut.
👉 Result: Capital flows returned to Gold as the No.1 safe haven, pushing prices strongly higher overnight.
📌 Key data today (04/09 – US time):
ADP Nonfarm (7:15)
Jobless Claims (7:30)
ISM Services PMI (9:00)
➡️ This trio of data will be crucial catalysts for GOLD volatility.
2. Technical Analysis ⚙️
On M30/H1, Gold continues to form bullish BOS, keeping the main trend upward.
Golden Harbor 🏝️ (Buy Zone 3,477 – 3,479): Old Order Block, strong support if price pulls back.
Quick Boarding 🚤 (Sell Scalp 3,561 – 3,563): Only for short-term scalps.
Storm Breaker 🌊 (Sell Zone 3,573 – 3,575): Aligned with Fibo 0.618–0.786, strong resistance with potential selling pressure.
Captain’s Shield 🛡️ (Support): 3,526 – 3,515 – 3,508
3. Captain Vincent’s Map – Trade Scenarios 🪙
🔺 Golden Harbor 🏝️ (BUY – Priority)
Entry: 3,477 – 3,479
SL: 3,470
TP: 3,480 → 3,483 → 3,486 → 3,491 → 349x → 35xx
🚤 Quick Boarding (SELL Scalp – Short Ride)
Entry: 3,561 – 3,563
SL: 3,569
TP: 3,558 → 3,555 → 3,552 → 354x
🌊 Storm Breaker (SELL Zone – Strong Resistance)
Entry: 3,573 – 3,575
SL: 3,581
TP: 3,570 → 3,565 → 3,560 → 3,555 → 35xx
4. Captain’s Note ⚓
"The golden sail is filled with wind as the FED turns dovish. Golden Harbor 🏝️ (3477) remains the safe haven to align with the bullish trend. SELLs are just Quick Boarding 🚤 scalps at Storm Breaker 🌊 , not long voyages."
Breakouts & Fakeouts in Trading🔹 Introduction
Financial markets are like living organisms – constantly moving, adjusting, and reacting to news, emotions, and liquidity. For traders, one of the most exciting moments is when a stock, currency pair, commodity, or cryptocurrency seems to break out of its range. Breakouts often lead to big, sharp moves, offering opportunities for quick profits.
But here’s the catch: not every breakout is real. Many are fakeouts (false breakouts) designed by market dynamics, liquidity hunters, or big players to trap traders. The difference between making money and losing money often lies in identifying whether a breakout is genuine or false.
This article dives into:
What breakouts are
Why fakeouts happen
Chart examples (conceptually explained)
Tools to confirm breakouts
Trading strategies to avoid traps
Risk management for breakout traders
🔹 Part 1: What is a Breakout?
A breakout occurs when the price of an asset moves outside a defined support or resistance level with increased momentum.
✅ Common Types of Breakouts
Resistance Breakout – Price moves above a previously strong ceiling.
Support Breakout – Price falls below a previously strong floor.
Trendline Breakout – Price breaks out of a rising or falling trendline.
Chart Pattern Breakout – Price escapes from patterns like triangles, flags, rectangles, or head & shoulders.
Volatility Breakout – When price explodes after a period of consolidation (Bollinger Band squeeze).
Why traders love breakouts?
They indicate a new trend may begin.
They provide clear entry and exit levels.
They often come with higher volume, confirming market interest.
Example: If Nifty is stuck between 19,500–20,000 for weeks and suddenly crosses 20,000 with heavy volume, that’s a bullish breakout.
🔹 Part 2: What is a Fakeout?
A fakeout (false breakout) happens when price temporarily breaks a level, lures traders into positions, but then reverses back into the range.
Fakeouts are dangerous because:
Traders enter aggressively expecting a trend, but get stopped out.
Big players use fakeouts to hunt stop-losses of retail traders.
They often happen during low liquidity or news events.
Example: Price breaks above 20,000, attracts buyers, but quickly reverses to 19,800. That’s a bull trap fakeout.
🔹 Part 3: Why Do Fakeouts Happen?
Fakeouts are not random; they are part of market psychology and structure.
Liquidity Hunting (Stop Loss Hunting)
Smart money knows retail traders place stop-losses above resistance or below support.
They push prices just beyond those levels, trigger stop-losses, then reverse.
Low Volume Breakouts
If breakout happens without strong participation, it’s usually unsustainable.
News & Events
A sudden announcement can cause sharp moves, but once news fades, price falls back.
Algorithmic Manipulation
High-frequency traders may push price beyond levels to create artificial breakouts.
Market Sentiment & Greed
Traders chase breakouts blindly, creating temporary momentum before exhaustion.
🔹 Part 4: Spotting Genuine Breakouts vs Fakeouts
✅ Clues for Real Breakouts
High Volume: Breakouts with above-average volume are stronger.
Retest of Levels: After breakout, price pulls back to test old support/resistance, then resumes trend.
Strong Candle Closes: Large body candles closing beyond the level.
Market Context: Aligns with larger trend or macroeconomic strength.
❌ Signs of Fakeouts
Breakout with low or declining volume.
Long wicks (shadows) beyond resistance/support but weak closes.
Breakouts during off-market hours or thin liquidity.
Price immediately snaps back into range after breakout.
🔹 Part 5: Chart Patterns & Fakeouts
Range Breakouts
Markets consolidate between two levels.
Breakouts beyond range are powerful but also prone to fakeouts.
Triangle Breakouts
Symmetrical/ascending/descending triangles show compression.
Fakeouts are common before the “real” breakout.
Head & Shoulders Pattern
A breakdown below the neckline should confirm trend reversal.
Many times, price breaks below neckline but quickly recovers.
Flag & Pennant Patterns
Strong continuation patterns, but fake breakouts happen if volume is missing.
🔹 Part 6: Strategies to Trade Breakouts & Avoid Fakeouts
1. Wait for Candle Close Confirmation
Don’t jump in immediately; wait for the candle to close above/below the level.
2. Use Volume as Filter
Only trade breakouts with above-average volume.
3. Retest Strategy
Enter on pullback to old support/resistance (safer entry).
4. Multi-Timeframe Confirmation
If breakout is visible on both 1-hour and daily charts, it’s stronger.
5. Combine with Indicators
RSI divergence can warn of false breakout.
Moving averages can confirm trend direction.
6. Avoid News-Driven Breakouts
Trade technical breakouts, not temporary news spikes.
🔹 Part 7: Risk Management in Breakout Trading
Even the best trader cannot avoid fakeouts completely. That’s why risk management is key.
Position Sizing: Risk only 1–2% of account per trade.
Stop Loss Placement:
For upside breakout: place SL below breakout level.
For downside breakout: place SL above breakdown level.
Use Partial Profits: Book some profit early, trail the rest.
Don’t Chase Breakouts: If you miss the first entry, don’t enter late.
🔹 Part 8: Real-Life Examples
Example 1: Stock Breakout
Stock consolidates between ₹500–₹520 for 2 weeks.
Breaks ₹520 with high volume, rallies to ₹550. (Real breakout)
Example 2: Crypto Fakeout
Bitcoin breaks $30,000 resistance but fails to sustain.
Falls back to $29,000 within hours. (Bull trap fakeout)
Example 3: Forex False Breakdown
EUR/USD breaks below 1.1000, triggering short trades.
Reverses sharply to 1.1050. (Bear trap fakeout)
🔹 Part 9: Psychology Behind Breakouts & Fakeouts
Retail Traders: Chase price blindly.
Institutions: Create liquidity zones by triggering retail stop-losses.
Fear & Greed: Traders either fear missing out (FOMO) or panic at reversals.
Patience vs Impulsiveness: Successful traders wait for confirmation, while impulsive ones fall for fakeouts.
🔹 Part 10: Advanced Tips for Professionals
Volume Profile Analysis
See if breakout aligns with high-volume nodes (strong support/resistance).
Order Flow Tools (Level II Data, Footprint Charts)
Helps spot whether breakout is supported by real buying/selling.
Breakout with Trend Alignment
Always trade in direction of higher-timeframe trend.
Market Timing
Breakouts during main sessions (like US market open) are more reliable.
🔹 Conclusion
Breakouts & fakeouts are two sides of the same coin. While real breakouts can deliver powerful moves, fakeouts are equally common and dangerous. The key lies in:
Confirming with volume, retests, and candle closes.
Avoiding emotional FOMO trades.
Protecting capital with risk management.
If you understand the psychology behind breakouts and fakeouts, use confirmation tools, and trade with patience, you can avoid traps and capture the big trend moves that follow genuine breakouts.
Crude oil - Sell around 64.00, target 62.00-60.00Crude Oil Market Analysis:
Crude oil is still experiencing a recent correction in daily price action. We should consider continuing to sell on any rebounds. Previous crude oil contracts and inventories haven't changed the trend, and recent data doesn't support it. I predict it will be difficult to reverse the weak selling trend in the short term. Today, we're considering selling around 64.00.
Fundamental Analysis:
Recent fundamentals haven't significantly stimulated the market. Today, we'll focus on the US non-farm payroll data.
Trading Recommendations:
Crude oil - Sell around 64.00, target 62.00-60.00

Crazy gold! Buy or wait for a pullback?Market News:
Spot gold prices fluctuated narrowly in early Asian trading on Friday (September 5th), currently trading around $3,550 per ounce. International gold, a traditional safe-haven asset, hit a record high of $3,578 per ounce on Wednesday amid growing global economic uncertainty. The London gold price declined after reaching a record high, primarily due to profit-taking by traders. After a strong rally, the market accumulated a large amount of long positions, and many investors chose to cash in their profits at the peak, leading to a short-term price decline. Traders are focused on the upcoming US non-farm payroll report, which could directly influence the pace of the Federal Reserve's interest rate cuts and, in turn, the price of gold. In the current environment, weak employment indicators reinforce expectations of rate cuts and support gold's safe-haven demand. However, if the data exceeds expectations, gold may face further pressure.
Technical Analysis:
After seven consecutive days of gains, gold experienced a sharp drop yesterday, closing with a long lower shadow on the daily chart. Technically, this closing pattern is often a continuation of an upward trend, as prices remain within the ascending channel. Furthermore, a double top or head-and-shoulders top pattern has yet to emerge and establish. The daily chart retreated to yesterday's 5-day moving average at 3511, then bottomed out and rebounded. The European and American markets strengthened again, pulling back towards the 3559/60 levels. The 10-day and 7-day moving averages remained open and moved upward to 3504/3467, and the RSI indicator remained above 70. On the short-term four-hour chart, gold prices are trading within the upper middle Bollinger Band, with the moving averages converging and the hourly Bollinger Bands closing. Regarding news data, focus on the non-farm payroll report today. The market's estimate is slightly bearish, but the 4.3% increase in the unemployment rate is favorable for buying. The main strategy for intraday trading is to focus on wide range fluctuations, primarily buying on dips and selling on highs.
Trading Strategy:
Short-term gold buy at 3535-3538, stop loss at 3527, target at 3570-3590;
Short-term gold sell at 3577-3580, stop loss at 3588, target at 3540-3520;
Key Points:
First support level: 3536, second support level: 3523, third support level: 3510
First resistance level: 3562, second resistance level: 3576, third resistance level: 3590

Elliott Wave Analysis XAUUSD – September 5, 2025
————————————
Momentum
• D1: Momentum has already turned bearish, suggesting that in the coming days we could see a corrective decline. Since today is Friday, be cautious of potential liquidity sweeps before the weekly close.
• H4: Momentum is still rising, but with about 1 hour left before the current H4 candle closes, it is likely to enter the overbought zone, which would increase the risk of reversal.
• H1: Momentum is weakening and preparing to reverse, showing that the current upward move is losing strength.
————————————
Wave Structure
• D1: No major changes. A corrective decline is likely in the coming days. The depth of this correction will help us identify the exact wave structure. For now, patience is needed until D1 momentum reaches the oversold area and new patterns form.
• H4: Price still seems to be in the corrective phase of wave iv (purple). With H4 momentum about to enter the overbought zone, I still expect a downward move to complete wave iv before the market continues upward into wave v (purple).
• H1: We can see an ABC (green) structure forming, as mentioned yesterday. However, because it developed quite quickly, it could also evolve into a Flat, Triangle, or Combination pattern.
o Price is moving in a choppy, overlapping manner.
o Combined with H4 momentum nearing overbought → it’s likely that wave B is forming, followed by a downward move to complete wave iv (purple).
o If a Flat plays out, price could rise toward 3578 (or higher) before dropping back below that level.
————————————
Targets
• Wave C: We need to wait for wave B to complete before setting more reliable targets. For now, keep yesterday’s target zones: 3498 – 3469.
• Wave v (purple): No significant change compared to yesterday’s plan.
————————————
Trading Plan
Buy Zone 1: 3500 – 3498
• SL: 3490
• TP1: 3524
Buy Zone 2: 3471 – 3469
• SL: 3459
• TP1: 3500

Gold - Buy near 3540, target 3558-3578Gold Market Analysis:
The market's greatest allure lies in its ever-changing nature. Yesterday, gold plummeted in the Asian session, plummeting to around 3510. It then hit the 5-day moving average on the daily chart and rebounded rapidly. It then went on to not only rebound, but also rise in a V-shaped pattern. Your supposed sell-off was a lie. The daily chart ultimately closed with a bearish hammer candlestick pattern. The long lower shadow suggests yesterday's sharp drop was fleeting. Gold has not yet shifted its buying trend. Today is the time for the non-farm payroll report, and I predict a period of volatile correction with a buying bias. If gold can rally to a new high in the Asian session today, consider buying directly. Our approach in the Asian session is to buy low and then wait for the non-farm payroll data. It's difficult to determine whether 3578 on the daily chart is the high point, and the pattern doesn't signal a peak. The 1-hour chart shows a new support level near 3540. Buying in the Asian session is possible based on this support level. Furthermore, support from moving averages and indicators is near 3531. This level, which represents daily support, presents a buying opportunity. If gold reaches 3578 during the Asian session, do not consider selling. The strategy of buying at low prices can be maintained until the release of the non-farm payroll data.
Support levels are 3531 and 3540, while resistance levels are 3578 and 3560. The dividing line between strength and weakness is 3540.
Fundamental Analysis:
Recent fundamentals have not significantly stimulated the market. Today, we will focus on the US non-farm payroll data.
Trading Recommendation:
Gold - Buy near 3540, target 3558-3578

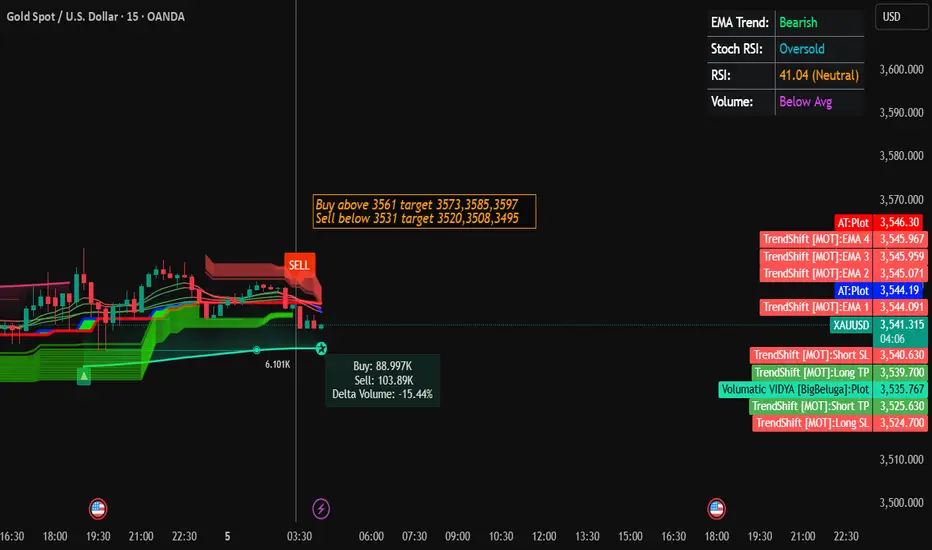
Gold Trading Strategy for 05th September 2025📊 Gold Trading Setup
🟢 Buy Setup
Entry: Buy above the high of the 1-hour candle once price closes above $3561
Targets:
🎯 Target 1: $3573
🎯 Target 2: $3585
🎯 Target 3: $3597
🔴 Sell Setup
Entry: Sell below the low of the 15-minute candle once price closes below $3531
Targets:
🎯 Target 1: $3520
🎯 Target 2: $3508
🎯 Target 3: $3495
⚠️ Disclaimer:
This is purely for educational and informational purposes only. Trading in commodities, forex, or any financial instruments involves significant risk, and you should never risk more than you can afford to lose. Please do your own research or consult with a financial advisor before making any trading decisions.
Bearish Pressure Builds: Gold Poised for More RetreatGold retreated sharply today as expected, and directly hit my expected retracement target of 3520-3510 area; the lowest point happened to be around 3511. We added a lot of short positions around 3575 and 3578 overnight, which helped us to make considerable profits during the gold retreat. All short positions made a total profit of 1830pips after being closed.
Since gold has begun to retreat from 3578, and the retracement has reached 670 pips in the short term, a retracement that is rare in recent times, as gold has shown obvious signs of retreat, once large funds begin to withdraw, it may trigger serious selling sentiment in the market. Taking this opportunity, the gold market may usher in a round of sharp correction. Moreover, after gold retreats, 3578 is expected to become the interim peak, which will limit the room for gold to rebound while being conducive to the downward pressure on gold.
In addition, gold rose sharply before the NFP market, probably to reserve room for the NFP market to fall, so I think gold still has the demand and space to continue to retreat, so the current decline has not ended yet, and I think the current short-term rebound provides us with good conditions for entering the short market.
According to the current structure, gold still needs to retreat after fluctuating at high levels. Therefore, in trading, we can still look for suitable opportunities to short gold during the gold rebound. First of all, we need to pay attention to the short-term resistance area of 3545-3555. Once gold cannot effectively stand in this area during the rebound, gold will also test the 3510-3500 area. After falling below this area, it is expected to continue to the 3490-3480 area.

"XAUUSD Update – Resistance Rejection and Market Structure ShiftXAUUSD Update – Resistance Rejection and Market Structure Shift
Price Action: Gold has recently tested the 3550 – 3600 resistance zone, where the market showed signs of rejection. This level represents a significant supply area formed by previous liquidity grabs.
Market Structure: After a strong bullish impulse, the current price behavior suggests a possible correction phase. The rally left behind areas of imbalance that could attract price back downward.
Key Observation:
The first reaction zone sits around 3480, which aligns with a structural support level from past consolidation.
A deeper correction may extend toward the 3330 – 3320 support region, a critical level where historical demand has been observed.
Context: Liquidity above recent highs has been taken, and the chart now shows potential for retracement to restore balance before determining the next directional move.

Gold Rally Faces Exhaustion – Is a Pullback Next?Gold Rally Faces Exhaustion – Is a Pullback Next?
📊 Gold Market Analysis (XAU/USD)
🔹 Fundamental Outlook
Macroeconomic Sentiment
Recent economic data from the U.S. continues to shape gold’s trajectory. Slower job growth and rising recessionary signals are fueling expectations that the Federal Reserve may adopt a more dovish stance. This increases investor interest in safe-haven assets like gold.
U.S. Dollar & Yields
The U.S. Dollar Index has shown weakness, which typically boosts gold prices since gold is dollar-denominated. Meanwhile, Treasury yields remain under pressure as investors anticipate lower interest rates in the medium term, further supporting bullish momentum.
Geopolitical Factors
Ongoing political tensions in Eastern Europe and uncertainty in energy markets are driving hedging demand. Institutional flows have recently shifted back into gold ETFs, signaling increased demand from large investors.
🔹 Technical Outlook
Trend Strength
The chart reflects a strong impulsive bullish move over the past sessions, characterized by clean breakouts and higher highs. Momentum is still intact but shows the first signs of exhaustion near the recent peak.
Market Structure
Price action has been characterized by consecutive break-of-structure (BOS) events, showing dominance of buyers. However, the latest candles indicate slowing momentum, with smaller bodies and longer wicks hinting at potential short-term weakness.
Volume Profile
The visible volume profile suggests that earlier accumulation phases fueled this strong rally. Current levels are showing higher participation, indicating profit-taking by short-term traders.
Possible Scenarios
Short-term pullback: Likely retracement as buyers take profit after a strong rally.
Medium-term continuation: If macro drivers (Fed dovish stance, weaker dollar) persist, gold may regain momentum after consolidation.

Part 1 Ride The Big MovesIntroduction to Options
In the world of financial markets, people look for different ways to make money, reduce risk, or take positions on where they think markets are headed. Apart from buying and selling stocks directly, one of the most powerful tools available is options trading.
Options are a type of derivative contract. This means their value is derived from an underlying asset like a stock, index, currency, or commodity. They give traders and investors flexibility because they can be used for speculation (betting on price movements), hedging (protecting against risks), or even for generating steady income.
Unlike stocks where ownership is straightforward (you buy a share, you own part of the company), options are contracts with special terms, conditions, and expiry dates. This makes them more complex but also more versatile.
For example: If you believe a stock price will rise in the next month, you don’t necessarily need to buy the stock. Instead, you can buy a call option, which gives you the right to buy that stock at a certain price later. Similarly, if you think the stock will fall, you can buy a put option, which gives you the right to sell at a certain price.
This flexibility makes options attractive to professional traders, institutions, and even retail traders who want to manage risk or boost returns.
But with power comes responsibility—options can be risky if not understood properly. That’s why it’s important to study them in depth.
Types of Options (Call & Put)
Call Option (Bullish bet):
If you expect the stock price to go up, you buy a call. Example: Reliance stock is ₹2,500. You buy a call option with strike price ₹2,600. If stock rises above ₹2,600, your option gains value.
Put Option (Bearish bet):
If you expect the stock price to fall, you buy a put. Example: Infosys stock is ₹1,500. You buy a put option with strike price ₹1,400. If stock falls below ₹1,400, your option gains value.
Both call and put can be bought or sold (written). Selling options means you take on obligations, which is riskier but gives you upfront premium income.

Gold Trading Strategy XAUUSD September 4, 2025Gold Trading Strategy XAUUSD September 4, 2025: New all-time high of $3,578, gold eases to $3,536/oz as US ADP data takes center stage.
Fundamentals: Spot gold hit a record high on Wednesday as weaker-than-expected US jobs data weighed on the US dollar. Gold bulls are betting on further gains. The US Department of Labor's Bureau of Labor Statistics released its Job Openings and Labor Turnover Survey (JOLTS) report on Wednesday, showing that job vacancies, an indicator of labor demand, fell by 176,000 to 7.181 million on the last day of July. Economists surveyed by Reuters had previously forecast the number of vacant jobs in the United States at 7.378 million in July.
Technical analysis: After creating the latest ATH of 3578, the gold price corrected strongly to the 3511 area and then continued to increase; this can be considered a short-term profit-taking wave of the gold price. However, the selling pressure is still not strong. The multi-frame RSI is in the overbought area and shows signs of entering the buying zone. We continue to wait at the support areas combined with MA, Fib and FVG zones.
Important price zones today: 3495 - 3500 and 3475 - 3480.
Today's trading trend: BUY.
Recommended order:
Plan 1: BUY XAUUSD zone 3495 - 3497
SL 3492
TP 3500 - 3510 - 3530 - 3550 - OPEN.
Plan 2: BUY XAUUSD zone 3475 - 3477
SL 3472
TP 3480 - 3490 - 3520 - 3550 - OPEN.
Plan 3: SELL XAUUSD zone 3549 - 3551
SL 3554
TP 3546 - 3536 - 3516 - 3500. (small volume, effective before US session).
Wish you a safe, effective and profitable trading day.🌟🌟🌟🌟🌟
