Technical Analysis and Fundamental AnalysisIntroduction
In the world of financial markets—whether equities, commodities, currencies, or bonds—two primary schools of thought dominate the decision-making process of traders and investors: technical analysis (TA) and fundamental analysis (FA). Both are distinct in methodology and philosophy, yet they share a common goal: to forecast future price movements and identify profitable opportunities.
Technical analysis focuses on price action, charts, patterns, and market psychology, whereas fundamental analysis centers on intrinsic value, economic indicators, company performance, and long-term outlooks. Traders and investors often debate which approach is superior, but in practice, many combine elements of both to create a more holistic strategy.
This essay provides an in-depth exploration of technical and fundamental analysis, covering their history, principles, tools, strengths, weaknesses, and practical applications.
Part 1: Technical Analysis
1.1 What is Technical Analysis?
Technical analysis is the study of historical price data and volume to forecast future market movements. Unlike fundamental analysis, it does not concern itself with “why” the price moves, but rather “how” it moves. The basic premise is that market action discounts everything, meaning all known information—economic, political, psychological—is already reflected in the price.
Traders using technical analysis believe that patterns repeat over time due to human behavior and market psychology. By analyzing charts, they aim to identify trends and capitalize on them.
1.2 History of Technical Analysis
The roots of TA trace back to Charles Dow, co-founder of the Wall Street Journal and the Dow Jones Industrial Average. His writings in the late 19th century evolved into what we now know as Dow Theory.
Japanese rice traders developed candlestick charting in the 1700s, which still plays a major role in modern trading.
Over time, charting techniques evolved into a sophisticated discipline supported by algorithms and computers.
1.3 Core Principles of Technical Analysis
Market Discounts Everything
All available information is already reflected in the price.
Price Moves in Trends
Markets follow trends—uptrend, downtrend, or sideways—and these trends are more likely to continue than reverse.
History Repeats Itself
Patterns of market behavior tend to repeat because human psychology does not change.
1.4 Tools of Technical Analysis
(a) Charts
Line Charts – simple, connect closing prices.
Bar Charts – show open, high, low, close (OHLC).
Candlestick Charts – visually appealing, show the same OHLC but easier to interpret.
(b) Price Patterns
Continuation Patterns: Flags, Pennants, Triangles.
Reversal Patterns: Head and Shoulders, Double Top/Bottom, Cup and Handle.
(c) Indicators and Oscillators
Trend Indicators: Moving Averages (SMA, EMA), MACD.
Momentum Oscillators: RSI, Stochastic Oscillator.
Volatility Indicators: Bollinger Bands, ATR.
Volume Indicators: On-Balance Volume (OBV), Volume Profile.
(d) Support and Resistance
Support: a level where demand outweighs supply, preventing further decline.
Resistance: a level where supply outweighs demand, preventing further rise.
(e) Advanced Tools
Fibonacci Retracement and Extensions.
Elliott Wave Theory.
Ichimoku Cloud.
Volume Profile Analysis.
1.5 Advantages of Technical Analysis
Provides clear entry and exit signals.
Works well for short-term and medium-term trading.
Easy to visualize with charts.
Reflects collective psychology and herd behavior.
1.6 Limitations of Technical Analysis
Subjective interpretation: two analysts may read the same chart differently.
Works best in trending markets, less effective in choppy markets.
False signals can lead to losses.
Relies on past data, which may not always predict future movements.
Part 2: Fundamental Analysis
2.1 What is Fundamental Analysis?
Fundamental analysis evaluates a security’s intrinsic value by examining economic, financial, and qualitative factors. It seeks to answer: Is this stock (or asset) undervalued or overvalued compared to its true worth?
Investors use FA to make long-term decisions, focusing on earnings, growth potential, competitive advantages, management quality, and macroeconomic conditions.
2.2 Core Principles of Fundamental Analysis
Intrinsic Value vs. Market Price
If the intrinsic value is greater than market price → Buy (undervalued).
If the intrinsic value is less than market price → Sell (overvalued).
Economic and Business Cycles Matter
Markets are influenced by GDP growth, inflation, interest rates, and other macroeconomic variables.
Long-Term Focus
Fundamental analysis is best suited for long-term investors, not short-term traders.
2.3 Types of Fundamental Analysis
(a) Top-Down Approach
Starts with the global economy, then narrows to sectors, and finally selects individual companies.
(b) Bottom-Up Approach
Focuses on company-specific factors first, regardless of broader economy or sector.
2.4 Tools of Fundamental Analysis
(a) Economic Indicators
GDP growth, unemployment rates, inflation, interest rates, currency fluctuations.
(b) Industry and Sector Analysis
Porter’s Five Forces model.
Sector growth potential.
(c) Company Analysis
Quantitative Factors (Financial Statements)
Income Statement (revenue, profit, margins).
Balance Sheet (assets, liabilities, equity).
Cash Flow Statement.
Financial Ratios: P/E, P/B, ROE, ROA, Debt-to-Equity, etc.
Qualitative Factors
Management quality.
Competitive advantage (moat).
Brand value, innovation, customer loyalty.
(d) Valuation Models
Discounted Cash Flow (DCF).
Dividend Discount Model.
Price-to-Earnings and other multiples.
2.5 Advantages of Fundamental Analysis
Provides deep insights into intrinsic value.
Helps long-term investors make informed decisions.
Identifies undervalued and overvalued opportunities.
Considers broader economic and company-specific realities.
2.6 Limitations of Fundamental Analysis
Time-consuming and requires access to reliable data.
Assumptions in valuation models can be subjective.
Does not provide short-term entry/exit signals.
Markets can remain irrational longer than expected.
Part 3: Technical vs. Fundamental Analysis
Feature Technical Analysis Fundamental Analysis
Focus Price action, charts, patterns Intrinsic value, financial health
Time Horizon Short-term to medium-term Long-term
Tools Used Indicators, oscillators, chart patterns Financial statements, ratios, DCF
Philosophy “Price discounts everything” “Price may diverge from true value”
Strengths Timing trades, market psychology Identifying strong companies/assets
Weaknesses Subjective, false signals Time-consuming, subjective assumptions
Part 4: Practical Applications
4.1 Traders Using Technical Analysis
Day traders, scalpers, and swing traders rely heavily on technicals.
Example: A trader identifies bullish divergence in RSI and enters a long position.
4.2 Investors Using Fundamental Analysis
Long-term investors like Warren Buffett use FA to buy undervalued companies.
Example: Buying a company with consistent free cash flow, strong moat, and low debt.
4.3 Combining Both Approaches (Techno-Fundamental)
Many professionals combine both methods:
Use fundamental analysis to select strong companies.
Use technical analysis to time entry and exit points.
Part 5: Case Studies
Case Study 1: Reliance Industries (India)
FA View: Strong business diversification, consistent earnings growth, high market share in telecom and retail.
TA View: Technical breakout from a consolidation zone often triggers big moves.
Outcome: FA supports long-term investment, TA helps with timing.
Case Study 2: Tesla (US)
FA View: High valuation multiples, but strong growth prospects in EV industry.
TA View: Volatile price patterns with frequent trend reversals.
Outcome: Investors may hold long-term based on fundamentals but traders rely on charts to manage risk.
Part 6: Criticism and Debate
Critics of TA argue that past price cannot reliably predict future performance.
Critics of FA argue that intrinsic value is subjective, and markets often misprice assets for extended periods.
In reality, both methods reflect different perspectives: TA focuses on “when” to trade, FA focuses on “what” to trade.
Conclusion
Technical analysis and fundamental analysis are two complementary pillars of market research. While TA is driven by patterns, psychology, and momentum, FA is grounded in data, earnings, and long-term value.
For traders, technical analysis is often the weapon of choice due to its short-term applicability. For investors, fundamental analysis provides the framework for wealth creation over time. However, the most successful market participants often blend the two—using fundamentals to identify what to buy and technicals to determine when to buy or sell.
In the ever-evolving financial markets, neither approach guarantees success. Markets are influenced by countless variables—economic, geopolitical, and psychological. But by understanding both technical and fundamental analysis deeply, one can develop a balanced perspective and navigate uncertainty with greater confidence.
Futures market
Volume Profile & Market Structure AnalysisIntroduction
In modern financial markets, traders and investors rely on both price and volume to make informed decisions. While traditional technical analysis focuses heavily on price charts, patterns, and indicators, volume profile analysis introduces a powerful dimension: it shows not just where price has moved, but also where the most significant trading activity has occurred.
Markets are not simply a story of price fluctuations — they are a narrative of participation, commitment, and liquidity. By studying how much volume has traded at each price level, traders gain insights into which levels matter most to participants. This is where the volume profile becomes a key tool.
Coupled with market structure analysis — which identifies trends, ranges, supply-demand zones, and institutional footprints — traders can develop a deeper understanding of the underlying mechanics that drive market movement.
This guide explores the concepts of volume profile and market structure in detail, blending theory with practical application.
1. Understanding Volume in Trading
Volume represents the number of contracts, shares, or lots traded during a specific period.
High volume = Strong participation, more conviction.
Low volume = Weak participation, possible indecision.
Price movement alone can be deceptive. A rally with low volume may simply be speculative or driven by a few participants. Conversely, a rally with high volume suggests genuine market consensus and institutional interest.
Thus, when price is studied together with volume, we see where money is flowing in and out of the market.
2. What is Volume Profile?
Volume Profile is a charting tool that displays trading activity over a chosen time period at specified price levels. Unlike the typical volume indicator shown below price bars (which measures activity over time), volume profile shows how much volume was transacted at each price level.
It usually appears on the side of the chart as a histogram.
Key elements:
Point of Control (POC):
The price level with the highest traded volume. It’s often seen as the market’s “fair value.”
Value Area (VA):
The range where around 70% of trading activity occurred.
Value Area High (VAH): Top of the value range.
Value Area Low (VAL): Bottom of the value range.
High Volume Nodes (HVN):
Price zones where large amounts of trading took place — representing strong support/resistance.
Low Volume Nodes (LVN):
Price levels with little trading — often act as rejection zones where price moves quickly through.
In essence, volume profile reveals where participants are most interested in trading.
3. Why Volume Profile Matters
Identifies strong support/resistance: Prices with high volume tend to act as magnets.
Reveals institutional activity: Large players accumulate or distribute around high-volume zones.
Helps detect breakouts/fakeouts: If price moves away from a value area with volume, it’s often more sustainable.
Guides risk management: Stop-loss and target levels can be aligned with volume nodes.
For example, if the POC is at 15,000 in Nifty futures, traders know this is a strong pivot point. If price is above POC, bias is bullish; if below, bearish.
4. Building Blocks of Market Structure
While volume profile explains where participants are most active, market structure explains how the market moves.
Market structure refers to the repetitive patterns of price behavior, shaped by supply and demand imbalances.
a) Phases of Market Structure
Accumulation: Institutions build positions after a downtrend. Volume increases slowly.
Markup: Price trends upward, breaking resistance levels.
Distribution: Institutions unload holdings to late buyers at higher prices.
Markdown: Market declines as selling pressure outweighs demand.
b) Market Structure Basics
Higher Highs (HH) & Higher Lows (HL): Uptrend.
Lower Highs (LH) & Lower Lows (LL): Downtrend.
Equal Highs/Lows: Range or consolidation.
Traders map these swings to understand whether the market is bullish, bearish, or neutral.
5. Integrating Volume Profile with Market Structure
When combined, these two frameworks become powerful:
Trend confirmation: In an uptrend, high-volume nodes forming higher also confirm strong institutional support.
Range identification: A wide value area often signals consolidation.
Breakout validation: If price breaks above value area with high volume, chances of continuation are strong.
Liquidity hunts: Price may dip into low-volume nodes to trap traders before reversing.
Example: If Bank Nifty is making higher highs but each move is supported by rising POC levels, it confirms strength in the trend.
6. Practical Applications for Traders
a) Day Trading with Volume Profile
Identify intraday POC and VAH/VAL.
Trade rejections from value extremes (fade strategy).
Trade breakouts above VAH or below VAL with volume confirmation.
b) Swing Trading
Use weekly/monthly volume profiles.
Enter near HVNs (support zones) and exit near opposing HVNs.
Align swing trades with broader market structure (trend direction).
c) Position Trading
Focus on long-term volume profiles (quarterly/yearly).
Look for accumulation/distribution footprints of institutions.
Hold positions around POC shifts (where market’s fair value is migrating).
7. Volume Profile Strategies
Strategy 1: Value Area Rejection
If price moves above VAH but volume doesn’t confirm, expect a return back inside the value area.
Works best in range-bound markets.
Strategy 2: Value Area Breakout
If price breaks VAH/VAL with strong volume, trade in the breakout direction.
Works best in trending markets.
Strategy 3: POC Reversal
When price revisits the POC after a strong move, watch for reversal or continuation signals.
Strategy 4: Low-Volume Node Play
Price tends to move quickly across LVNs since there’s little resistance there.
8. Market Structure Strategies
Strategy 1: BOS (Break of Structure)
When price breaks a previous swing high in an uptrend → confirms continuation.
Strategy 2: CHoCH (Change of Character)
When price shifts from making HH/HL to LH/LL → signals reversal.
Strategy 3: Liquidity Grab
Market often sweeps previous highs/lows to trigger stop-losses before moving in the real direction.
Strategy 4: Supply/Demand Zones
Identify areas of sharp moves with high volume → strong institutional orders likely exist there.
9. Case Study Example (Nifty Futures)
Imagine Nifty is trading around 19,800.
Daily volume profile shows POC at 19,750.
VAH = 19,820, VAL = 19,700.
Scenario:
Price breaks above VAH with strong volume → continuation likely.
If it rejects above 19,820 and comes back inside → fade trade down to POC.
Market structure shows HH/HL → aligns with breakout trades.
Thus, both tools together offer context + execution clarity.
10. Psychological Edge of Volume Profile & Market Structure
Traders feel more confident when trades are backed by objective volume data rather than just subjective chart patterns.
Understanding market structure helps avoid emotional decisions by providing a map of price behavior.
Together, they reduce overtrading and improve patience by waiting for high-probability zones.
Conclusion
Volume Profile and Market Structure are two complementary tools that transform how traders view the market.
Volume Profile shows the hidden story of participation, liquidity, and fair value.
Market Structure provides the roadmap of how price evolves over time.
Together, they:
Identify high-probability trading zones.
Reveal institutional footprints.
Help traders avoid emotional decisions.
However, success lies not in the tools alone but in how consistently and patiently traders apply them with risk management. Over time, these methods can provide a decisive edge in understanding and navigating financial markets.
Gold surges to a record highGold surges to a record high: Risk aversion and a weakening economy collide
Amidst growing global economic uncertainty, gold has once again demonstrated its status as the king of safe havens. On Tuesday (September 2nd), spot gold prices surged over 1%, breaking through the $3,500 per ounce mark, reaching a new all-time high of $3,539.88 per ounce before closing at $3,533.40 per ounce. So far this year, gold has risen 34.5%, significantly outperforming other major asset classes. This trend is no accident, but rather a profound market response to the weakening US economy, volatile trade policies, and global geopolitical risks.
🔹 Fundamentals: Multiple positive factors are converging, providing solid support for gold prices.
1. US manufacturing continues to contract, increasing recession risks.
The latest data shows that while the US manufacturing PMI rebounded slightly to 48.7 in August, it remained in contraction territory (below the 50 mark), marking the sixth consecutive month of decline. Manufacturing accounts for over 10% of the US economy, and its weakness has impacted employment, investment, and consumption. Particularly alarming is that some manufacturers have bluntly stated that the current environment is "worse than the Great Recession," blaming high tariffs for soaring costs, squeezing profits, and outsourcing capacity. Factory construction spending fell 6.7% year-on-year, further confirming subdued manufacturing confidence.
2. The legitimacy of tariff policies has been undermined, heightening market volatility.
A recent US appeals court ruling that the Trump administration's tariff measures are "unlawful" has temporarily suspended their implementation until October 14th, but this move has exacerbated policy uncertainty. Wall Street stocks tumbled, and the bond market also saw a sell-off. The 30-year US Treasury yield approached 5%, and global sovereign bond yields also climbed. The VIX (Volatility Index) rose, accelerating capital flows into gold for safe havens.
3. Expectations of a Federal Reserve rate cut strengthen, easing liquidity is in sight.
The market is betting on a 90% probability of a 25 basis point rate cut by the Federal Reserve in September, with a cumulative reduction of 57 basis points expected for the year. A weak non-farm payroll data on Friday could further fuel expectations of a rate cut. While the US dollar index has rebounded in the short term, it has weakened overall this year, providing support for gold prices. Furthermore, gold ETF holdings increased to 977.68 tons, the highest level since August 2022, with continued institutional inflows solidifying the upward trend.
4. Global risks are intertwined, with concerns about stagflation emerging.
Eurozone inflation is hovering near central bank targets, the Bank of Japan's dovish stance is weighing on the yen, and UK fiscal concerns continue to simmer. Some market participants are even concerned about the risk of "stagflation"—a combination of economic stagnation and inflationary pressures. Gold has historically been an ideal hedge against such an environment.
🔹 Technical Analysis: Bullish Trend Stable, Pullbacks Present Opportunities
From a technical perspective, gold has seen consecutive daily gains, demonstrating a typical bullish acceleration pattern. Yesterday, gold prices surged strongly above the 3472 level, breaking through 3500 before retracing to confirm the decline. They rose again in the early morning hours, closing at a higher level, demonstrating strong bullish control. Key support has now shifted to the 3510-3515 area, with short-term resistance above at 3550. A break above this level is expected to open up further potential.
Trading Strategy:
Main Strategy: Go long on pullbacks, avoid shorting against the trend.
Specific Plan:
Go long on gold pullbacks to the 3510-3516 area. Cover long positions if it reaches 3500-3505, with a stop-loss below 3493.
Target 3535-3550. Hold above 3570 after a break.
Risk Warning: Unexpectedly strong non-farm payroll data could suppress gold prices in the short term, but the overall risk-averse outlook remains unchanged.
💡 Final Note: A "Golden Age"?
The current rise in gold prices is the result of a combination of economic weakness, policy volatility, and market anxiety. It's no longer a simple commodity; it's a vote of confidence for investors against uncertainty. Against the backdrop of the Federal Reserve's policy shift and escalating global risks, gold is likely to continue its strength. However, be wary of volatility caused by short-term data disruptions; sticking to a trend-following strategy is the best approach.
Evening focus: U.S. July factory orders monthly rate, JOLTs job vacancy data and speeches by Federal Reserve officials may provide the market with new trading clues.

XAUUSD (GOLD) NEXT TARGET PRICE $4000 OR $2755 XAUUSD (GOLD) NEXT TARGET PRICE $4000 OR $2755 THE Real Commodity King Neal Bhai Forecast.

XAUUSD – Is Fibo 1.618 Strong Enough to End the Rally?XAUUSD – Is Fibo 1.618 Strong Enough to End the Rally?
Hello traders,
Gold has now posted six straight daily gains, showing the strong momentum behind this buying wave. This reflects the current sentiment in global markets, where gold continues to be treated as one of the most important safe-haven assets amid ongoing tariff discussions and a flood of news.
Part of this move has been driven by speculation around former US President Trump. While the news itself is unclear and not fully verified, it has been enough to influence global financial markets and push gold higher in recent sessions.
From a technical perspective, gold has already broken out of its daily trend channel and extended strongly higher. Right now, price is pausing around the Fibonacci 1.618 extension at 3536, which is acting as a dynamic resistance. If a bearish structure forms on the M15 timeframe, a short entry could be activated at this level.
Short scenario: Watch 3536 – if bearish confirmation appears on M15, short positions may be considered.
Buy scenario: The broader uptrend remains intact. A retest of the previous highs at 3500–3505 could offer a strong long entry for the medium to long term.
From a market psychology standpoint, this price area will be closely observed: buyers have already taken profits, while sellers have been partially liquidated. This means lower timeframes will be crucial for spotting clean entries.
This is my view on gold for today. Take it as reference, trade with discipline, and share your thoughts in the comments.

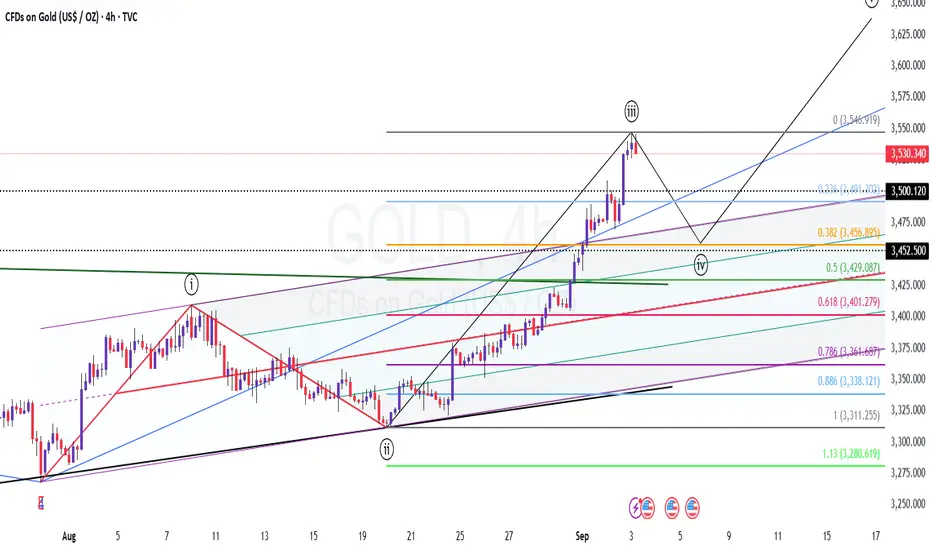
Elliott Wave Analysis XAUUSD – 03/09/2025
Momentum
• D1: Momentum is still overlapping. As mentioned in the previous plan, with 6 consecutive daily candles in this condition, a reversal may occur today or tomorrow.
• H4: Momentum is preparing to turn bearish. If a confirming candle closes, we may see a downward move on H4.
• H1: Momentum is also turning bearish but right above the oversold zone. This suggests the correction on H1 may be near completion, followed by another upward move.
________________________________________
Wave Structure
• D1: Price is still in an uptrend, possibly wave 1 of wave 5 or the final larger wave 5. Current wave targets are 3602 or 3667. This aligns with momentum on D1, which has been overlapping for 6 candles, signaling that in 1–2 more candles a reversal is likely.
• H4: A 5-wave purple structure is forming – the dominant structure of the current rally. Price is currently running in wave iii (purple).
o Inside wave iii purple, a 5-wave green structure has already formed and is nearing its final stage.
o Wave iii and iv green appear completed, and price is now in wave v green, which has broken the previous high of wave iii green, confirming its development.
• H1:
o The first target of wave v green was hit at 3542. The second target remains at 3585.
o Within wave v green, a 5-wave black sub-structure is visible.
o The Asian session opened with a breakout above the previous high, implying 2 scenarios:
1. Wave 5 black has completed after reaching the first target (3542).
2. Or it is forming a wave 4 black flat, holding above 3525 before heading to 3570–3585.
If price drops below 3525, it means wave 5 black has completed. Then, wave iv purple will target the zones 3498 and 3469 – areas to look for the next buy opportunity.
________________________________________
Trading Plan
• Buy Zone 1: 3500 – 3498
o SL: 3400
o TP1: 3524
• Buy Zone 2: 3471 – 3469
o SL: 3459
o TP1: 3500

Gold on Fire – Will XAUUSD Keep Breaking Higher?Gold (XAUUSD) is showing unstoppable momentum this month. With the US Dollar Index (DXY) weakening and markets expecting the Federal Reserve to cut interest rates, investor sentiment is shifting away from holding cash. For Indian traders, this means one thing: Gold is the ultimate safe-haven play right now.
🔎 Macro View
FED rate cut expectations → Pressure on USD → Bullish for Gold.
Risk sentiment: Investors worldwide are running to gold for safety.
With strong global inflows, gold could continue to make new all-time highs (ATHs) in the coming months.
📊 Technical Outlook (H1/H4)
Gold has been forming sideway accumulation zones followed by strong breakouts. This shows volume and market flow still favor bulls.
BUY ZONE:
3482 – 3480
SL: 3474
TP: 3486 – 3490 – 3495 – 3500 – 3505 – 3510 – 3520 – 3530 – 3540 – ???
SELL ZONE (only for short-term counter-trade):
3540 – 3542
SL: 3548
TP: 3530 – 3520 – 3510 – 3500 – ???
At the moment, there are no strong signals for selling. Trend bias = BUY on dips until we see sentiment reversal.
⚠️ Risk Note
The market is highly volatile right now with sudden liquidity sweeps. Always stick to TP/SL discipline to protect your account.
💡 Conclusion:
Gold remains in a powerful bullish trend, supported by both macro and technical factors. For Indian traders, the best strategy is to stay aligned with the bulls — buy dips and ride the wave.
✅ Follow MMFLOW TRADING for daily market plans and gold insights. Let’s capture this historic rally together!

Gold - correction in 4th waveCMP: 3530
TF: 4 Hours
Dont jump to buy at this price.. Ideally the price should move below 3500 to complete the 4th wave correction..
EW counts and Pitchfork set ups are marked for the possible target location
Remember, this fall will be zigzag or complex.. so whipsaws can be seen often.
Sharing this to time your entry for LONG.. Dont short just because it is heading lower..
One can wait and ride the 5th wave up.. Mostly euphoric..
Disclaimer: I am not a SEBI registered Analyst and this is not a trading advise. Views are personal and for educational purpose only. Please consult your Financial Advisor for any investment decisions. Please consider my views only to get a different perspective (FOR or AGAINST your views). Please don't trade FNO based on my views. If you like my analysis and learnt something from it, please give a BOOST. Feel free to express your thoughts and questions in the comments section.
The behavior of gold and stocks,The behavior of gold and stocks, plus the Fed's actions, are looking similar to 2007. In 2007, the Fed interest rates down,
The price of GOLD went up, stocks were worth down , and yields (Treasury bond yields) went down, signaling a recession. #GOLD #Silver

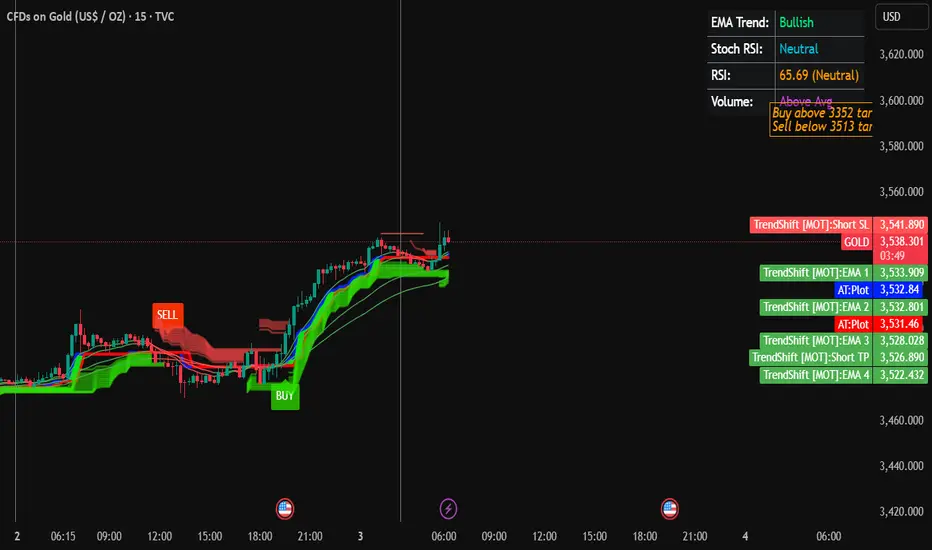
Gold Trading Strategy for 03rd September 2025📊 Gold Trading Plan
🔹 Buy Setup
Condition to Buy: Enter a Buy position only if the price closes above the high of the 15-minute candle at $3352.
Targets for Buy:
$3363
$3374
$3385
🔹 Sell Setup
Condition to Sell: Enter a Sell position only if the price closes below the low of the 1-hour candle at $3513.
Targets for Sell:
$3501
$3490
$3480
📝 Notes for Beginners
Wait for Candle Close – Do not enter before the candle fully closes above or below the given level.
Use Stop Loss – Always protect your trade with a stop loss (example: slightly below entry for buys, or above entry for sells).
Risk Management – Never risk more than 1–2% of your trading capital on a single trade.
Targets – You can exit at each target partially or hold until the final target depending on your strategy.
⚠️ Disclaimer: This information is for educational purposes only and should not be considered financial advice. Trading in gold or any financial markets involves risk, and you should do your own research or consult a licensed financial advisor before making trading decisions.
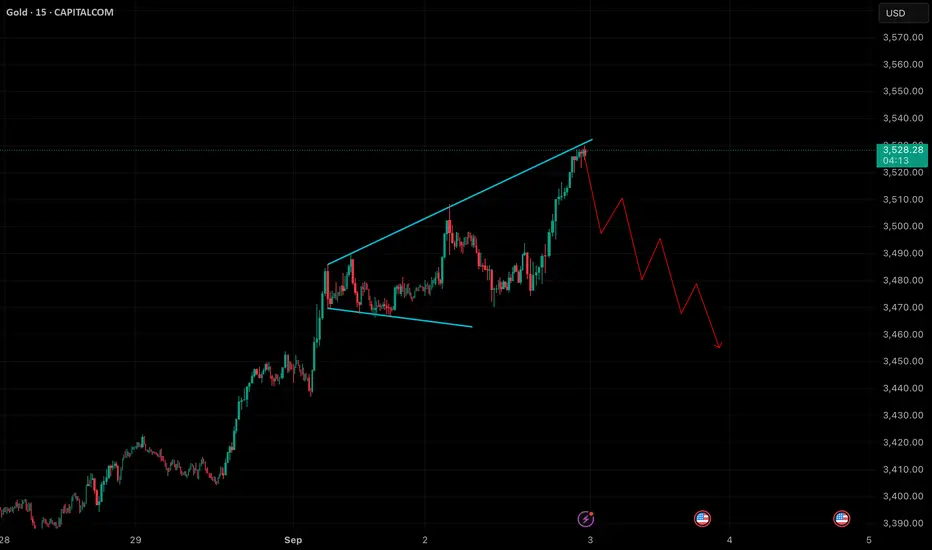
Bullish Finally we get triangle break out on this chart,now 3333 is very good support,my first short-term target is 3540
Some corrections visible at this level but trand is super bullish
My swing target is 3780 atleast and stoploss is 3333

Simple Support & Resistance Strategy on XAUUSDThis chart illustrates a simple but effective support and resistance trading approach.
Support Levels:
Support 1: Acts as a key demand zone where buyers may step in if price revisits this area.
Support 2: A minor intraday support that can provide short-term bounce opportunities.
Resistance Levels:
Resistance 1: The broader supply zone where sellers previously pushed price lower.
Resistance 2: A closer level that may act as a barrier for short-term upward moves.
What’s Happening:
Currently, price has broken below Support 2 and is testing downward momentum. Two possible scenarios are highlighted:
Price retests Support 1, holds, and then bounces back toward Resistance 2.
Price fails to hold at Support 1, leading to further downside continuation.
Probability Outlook:
If buyers defend Support 1 strongly, probability favors a bounce toward Resistance 2.
If Support 1 breaks with volume, probability favors a bearish continuation move to lower levels.
This setup shows how simple zone-to-zone trading can provide clear potential paths without overcomplication.
👉 Always remember: This is not financial advice, but an educational demonstration of support/resistance principles.

XAUUSD Alert| Liquidity Grab or Trend Reversal?”XAUUSD Alert 🚨 | Liquidity Grab or Trend Reversal?”
Gold has recently pushed into the 3525 – 3550 rejection zone, a level that has historically acted as strong supply. After this extended bullish rally, price is now showing early signs of exhaustion. This could be a liquidity grab above resistance before the market corrects lower.
My expectation here is a short-term pullback. The first key area I’ll be watching is around 3450, which lines up with a smaller demand zone and could act as a temporary support. If buyers fail to defend that level, then I expect continuation toward the 3330 – 3320 zone, which is my final target and also a major higher-timeframe support point.
This level is very important because it was previously a strong base for accumulation, and if tested again, it could provide a potential long opportunity. However, if price breaks below 3320 decisively, it would open the door for a much deeper correction.
Overall, my short-term outlook is bearish retracement, but I’ll be closely watching how price reacts once we reach the deeper support levels.

Gold short term Gold may halt from here. Expecting to go down. Gold completed 3 drive pattern and generally 3 drive pattern is short term reversal pattern.
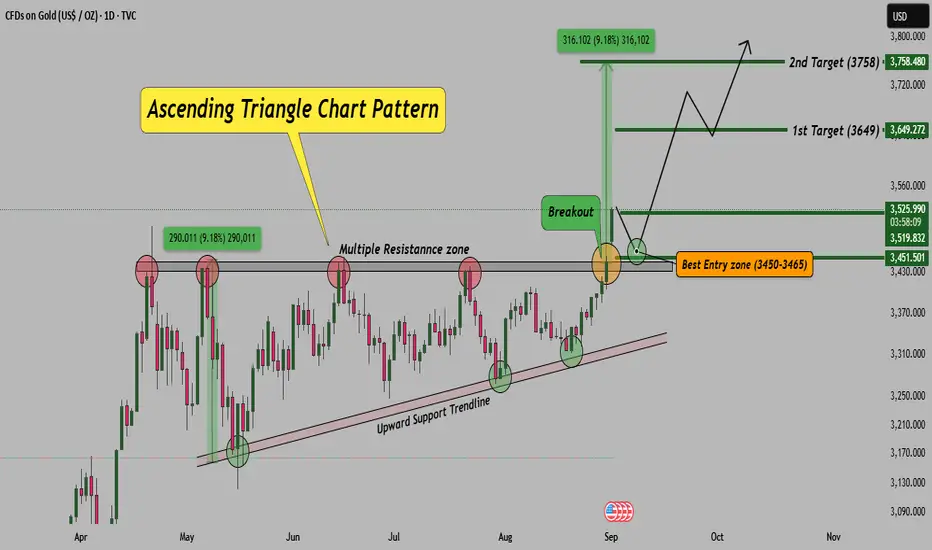
Gold Daily Chart – Ascending Triangle Breakout!Gold has formed a strong ascending triangle pattern on the daily timeframe. The price has successfully broken above the resistance zone, confirming bullish momentum. Such patterns generally indicate continuation of the uptrend, especially when supported by volume and strong price action.
Chart Observation:
As long as price holds above 3,450, the bullish setup remains valid.
A retest of the breakout zone can provide the best risk-to-reward entry opportunity.
Traders should keep an eye on volume confirmation while entering trades.
Note: If levels sustain and setup remains intact, I will share live trade updates in real time. Stay tuned.
Disclaimer: This analysis is for educational purposes only. Please do your own research or consult your financial advisor before taking trades.
Elliott Wave Analysis – XAUUSD 2/9/2025
Momentum
• D1: Momentum is still overbought and has been “sticking together” for about 5 consecutive daily candles. Usually, this amount of candles is enough for a potential reversal. This suggests that price may rise for only 1–2 more D1 candles before a daily reversal occurs.
• H4: Momentum is currently turning upward, which indicates that today the market is likely to continue higher for at least 2 more H4 candles.
• H1: Momentum is turning down. This implies that before H4 can continue its upward move, H1 may first produce a short corrective pullback and then resume the uptrend in line with H4.
——————————————-
Wave Structure
• D1: Price is still within wave 5 after completing a correction. Since D1 momentum has already stayed overbought for 5 candles, a multi-day correction may soon develop. This correction will clarify whether the current move is wave 1 of a larger wave 5, or if the larger wave 5 has already finished.
• H4: Price is completing the 5-wave structure (1-2-3-4-5 in red). Breaking above the wave 3 high confirmed that wave 5 in red is unfolding. With momentum on H4 turning up, the upward progress of wave 5 in red is expected to continue.
• H1: Within the 5-wave red structure, we can currently count 9 waves, where the upward waves are nearly equal in length. This reflects an extended wave iii (green). Counting 9 waves also hints that wave iii green is near its end, which implies wave 5 red may also be approaching completion.
Drawing an Elliott channel from wave 2 to wave 4 (red) and extending it over the top of wave 3 shows that wave 5 red is nearing the upper boundary of the channel. This supports the expectation that wave 5 red is close to finishing.
On a smaller scale, the current short-term decline in H1 looks like wave 4 of wave 5 red. The target zones for wave 4 have already been marked on the chart.
—————————————
Principle & Plan
• We do not enter against wave iii, especially in the case of an extended wave iii.
• Wait for wave iv to complete in order to look for buying opportunities into wave v (green).
—————————————
Wave iv targets:
• 23.6% retracement of wave iii: 3479.3
• 38.2% retracement of wave iii: 3459.7
Wave 5 target:
• Projected at 3577.6 (the farthest TP).
—————————————
Trading Plan
• Buy Zone 1: 3481 – 3478
o SL: 3470
o TP1: 3521
• Buy Zone 2: 3461 – 3459
o SL: 3450
o TP1: 3521

USOIL BUYING SETUPREASON OF SELLING SETUP:-
1.taken support from previous level
2.price bending from this level
3.sellers trap

XAUUSD – Sell Strategy ActivatedXAUUSD – Sell Strategy Activated
Hello traders,
Gold has followed the expected scenario, reacting precisely around the 3508–3510 zone. This correction is a good signal to consider a bearish outlook. However, for a clearer confirmation, price needs to close an M15 candle below 3466. If that happens, the previous bullish wave will be considered invalid, giving a stronger probability for the Sell setup.
Structurally, gold is still within the main rising channel, which means an early short entry should wait until liquidity from the small FVG zone above is fully taken.
Technical indicators are supporting this view:
MACD has shown consistent bearish momentum in the last 4 H1 candles.
Several indicators are already showing divergence, pointing to weakening bullish strength.
Sell zone to watch: around 3488–3491.
Setup invalidated if price breaks above the nearest resistance.
At this stage, the appetite for new long positions is fading, and buying at these levels carries greater risk. Remember, no trend moves in one direction forever – for price to reach higher targets, secondary corrective moves are necessary.
This is my trading scenario for gold in the coming sessions. Take it as reference and share your thoughts in the comments.

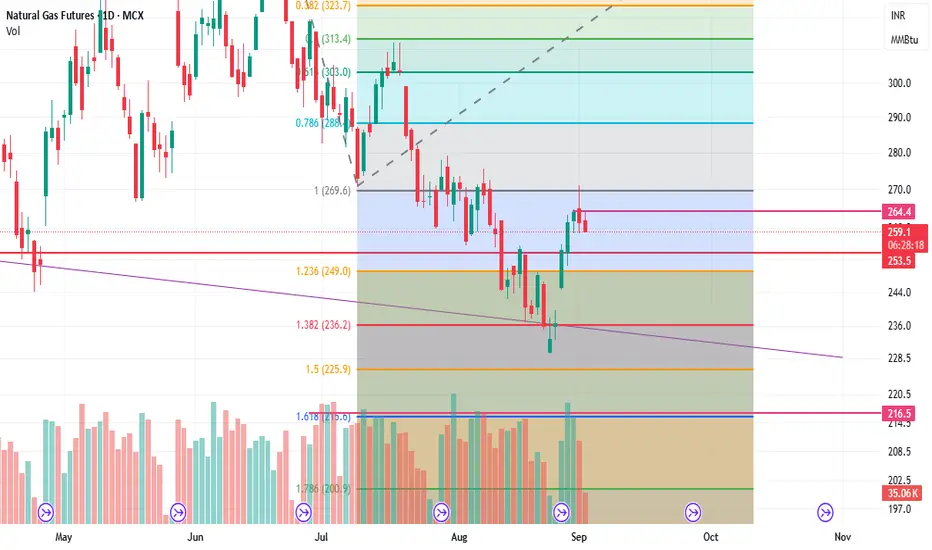
short natural gasNATURAL gas looks weak if breaks 230 then 160 possible .until u can play short upto 240 with sl of 275.
Part 9 Trading Masterclass With ExpertsIntroduction to Options
An option is a type of derivative contract. A derivative derives its value from an underlying asset, which could be a stock, index, commodity, currency, or bond. When you buy or sell an option, you don’t directly own the asset but instead own the right to buy or sell it at a pre-agreed price within a specific period.
At its core, an option is a contract between two parties:
The buyer (holder) of the option, who pays a premium for rights.
The seller (writer) of the option, who receives the premium and carries obligations.
Unlike shares, where ownership is straightforward, options deal with probabilities, rights, and conditions. This makes them flexible but also more complex.
Key Features of Options
Before diving deeper, let’s simplify the main features:
Underlying Asset – The financial instrument on which the option is based (e.g., Reliance Industries stock, Nifty50 index).
Strike Price (Exercise Price) – The price at which the underlying asset can be bought or sold.
Expiration Date (Maturity) – The last date the option can be exercised.
Option Premium – The cost of buying the option, paid upfront by the buyer to the seller.
Right but Not Obligation – The buyer can choose to exercise the option but is not compelled to.

Part 4 Institutional Trading Intermediate Strategies
(a) Bull Call Spread
Buy a call at lower strike and sell a call at higher strike.
Reduces cost but caps profit.
Good for moderately bullish markets.
(b) Bear Put Spread
Buy a put at higher strike, sell a put at lower strike.
Used in moderately bearish markets.
(c) Straddle
Buy one call and one put at the same strike and expiry.
Profits if stock makes a big move in either direction.
Expensive, requires high volatility.
(d) Strangle
Buy OTM call + OTM put.
Cheaper than straddle but needs a larger price move.
(e) Iron Condor
Combination of bull put spread + bear call spread.
Profits when price stays in a range.
Great for low-volatility environments.

Bullish trend intact, waiting for PMI to spark the next waveCaptain Vincent – Gold Plan XAU/USD
1. Market Waves 🌍
The USD continues to weaken as investors grow more confident that the FED will cut rates in the coming months. With the greenback losing appeal, large flows are leaving cash and moving into safe-haven assets → gold stands out as the number one choice .
👉 This supports gold’s sustainable bullish trend . If USD selling pressure persists, the market could see fresh breakouts into year-end.
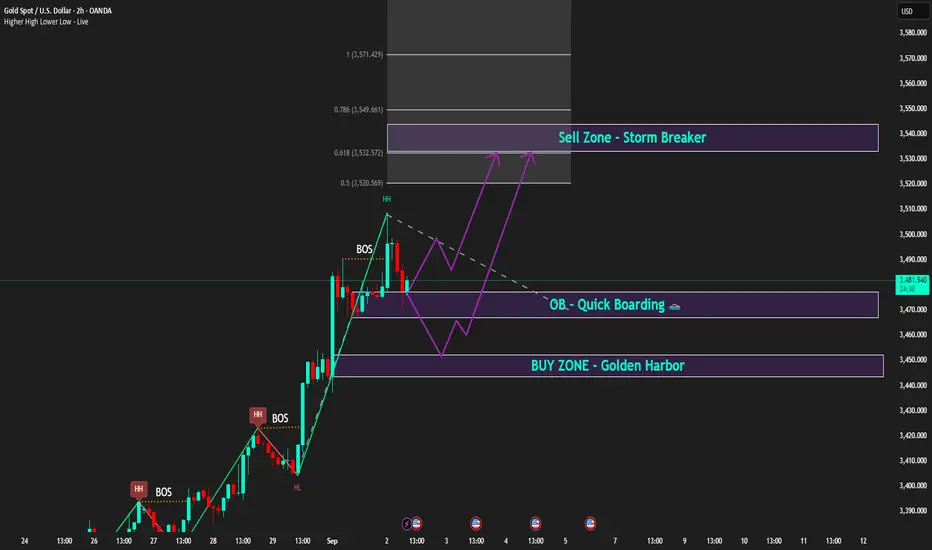
2. Technical Outlook ⚙️
H2 Chart: gold just created a Higher High after BOS , confirming bullish dominance.
Golden Harbor 🏝️ (Buy Zone 3,450 – 3,452): aligned with previous FVG , heavy liquidity zone.
Quick Boarding 🚤 (OB ~3,470): intermediate support, ideal for quick pullback entries.
Storm Breaker 🌊 (Sell Zone 3,538 – 3,540): resistance at Fibo 0.618 – 0.786 , strong chance of profit-taking if tested.
Intraday bias: Wait for pullback to Buy. Short-term Sell only if price hits Storm Breaker.
3. Captain Vincent’s Map – Key Levels 🪙
Golden Harbor 🏝️ (Buy Zone): 3,450 – 3,452
Quick Boarding 🚤 (OB Support): 3,470
Storm Breaker 🌊 (Sell Zone): 3,538 – 3,540
4. Trade Scenarios 📌
🔺 Golden Harbor 🏝️ (BUY – Priority)
Entry: 3,450 – 3,452
SL: 3,444
TP: 3,455 → 3,458 → 3,462 → 3,465 → 34xx
🔻 Storm Breaker 🌊 (SELL Reaction)
Entry: 3,538 – 3,540
SL: 3,548
TP: 3,535 → 3,532 → 3,529 → 35xx
5. Captain’s Note ⚓
“The gold sail is still filled with bullish wind, but Storm Breaker 🌊 above may create counter waves. Stay patient at Golden Harbor 🏝️ for precise entries, and watch the PMI at 21:00 – the catalyst for the next wave.”
XAUUSD Market Update - Sep 02, 2025XAUUSD Market Update
Current Price: $3,478
Gold is consolidating within a triangle pattern structure, approaching a decisive phase. The next move will depend on whether price sustains above support or confirms a false breakout.
🔼 Bullish Scenario
Sustained close above $3,500 will confirm strength.
Upside targets: $3,600 – $3,700.
Key support to hold: $3,420.
🔽 Bearish Scenario
Failure to hold $3,420 would signal a false breakout.
Downside targets: $3,265 – $3,200.
Extended weakness could lead towards $3,145.
✅ Recommendation
Short-term traders: Wait for a confirmed breakout above $3,500 before entering long positions.
Risk management: Keep stops below $3,420 to avoid false breakout traps.
Medium-term investors: Watch for retests near $3,265 – $3,200 as potential accumulation zones if bearish retracement occurs.
