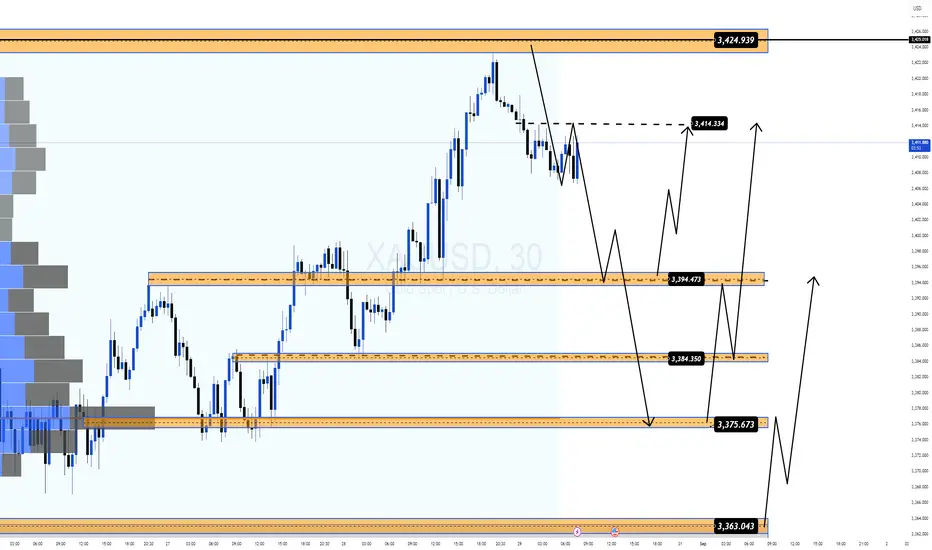
XAU/USD – Gold Targets 3,440 USDHello traders, gold has successfully broken through the key resistance at 3,400 USD and is now approaching the 3,420 USD zone. A decisive move above this level could open the way toward 3,440 USD. On the downside, the 3,375–3,380 USD support range remains effective, helping the bullish structure to hold.
From the macro side, US Q2 GDP grew by 3.3%, beating forecasts and confirming a solid economic recovery. Yet, this also fuels inflation concerns, reinforcing gold’s safe-haven appeal. Additionally, the upcoming PCE data for August is expected to rise, limiting the chances of early Fed rate cuts, which continues to support gold prices.
What’s your view on this setup? Share your thoughts below.
Futures market
Bulls trying to hold 24540, 24400 strong supportNifty still trying to hold 24540. 24400 is a strong support on weekly and monthy TF.
The probability of turnaround from these levels is possible.
Break of 24400 on the downside can be considered to be bearish in the short term.

Gold Trading Strategy | August 29-30✅ On the daily chart, gold closed with a strong bullish candle, breaking out to the 3448 level and testing the previous high resistance zone at 3450–3470. The price is firmly above the upper Bollinger Band, indicating strong bullish momentum, but there are short-term overbought signals. The MACD lines have formed a golden cross with expanding histogram bars, confirming the bullish trend. However, the KDJ is overextended (K > 90), suggesting the risk of a short-term pullback.
Overall, the daily chart remains bullish, but with price approaching key resistance, a correction could occur at any time.
✅ On the 4-hour chart, the price has surged from 3311 and climbed all the way up to 3448. It is now trading outside the upper Bollinger Band, showing clear signs of overheating in the short term. While MACD momentum remains strong, there are early signs of topping out. A technical pullback is likely, with key support to watch at 3430–3415.
🔴 Resistance: 3450–3470
🟢 Support: 3430–3415
✅ Trading Strategy Reference:
🔰 Aggressive Strategy: If the price breaks above 3470 and holds, further upside could extend toward 3500 and beyond.
🔰 Conservative Strategy: If the price pulls back to 3430–3415 and holds, consider entering long positions with targets at 3460–3470. If 3415 fails, shift to a high-level short strategy.
🔥Trading Reminder: Trading strategies are time-sensitive, and market conditions can change rapidly. Please adjust your trading plan based on real-time market conditions🤝

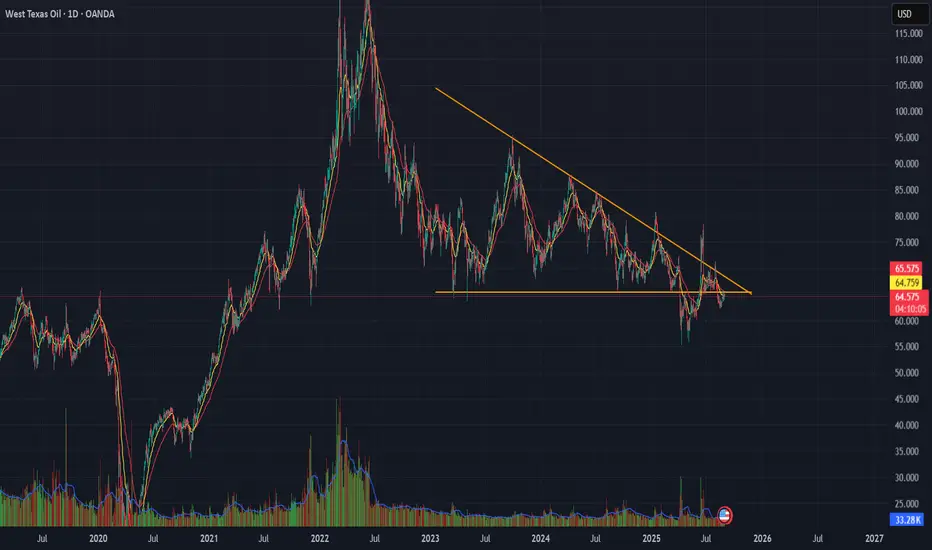
WTI Crude Oil Descending Triangle Pattern
WTI is forming a Descending Triangle pattern near recent support.
📊 Technicals : Flat base with lower highs compressing price action.
🔎 Key Levels: Breakdown below support 65 Leads To bearish continuation;
bounce above resistance 71 Leads To reversal setup.
⚠ Risk View: Energy fundamentals remain mixed — confirmation with volume is essential.
👉 Tactical takeaway: Wait for a breakout from the triangle before committing directionally.
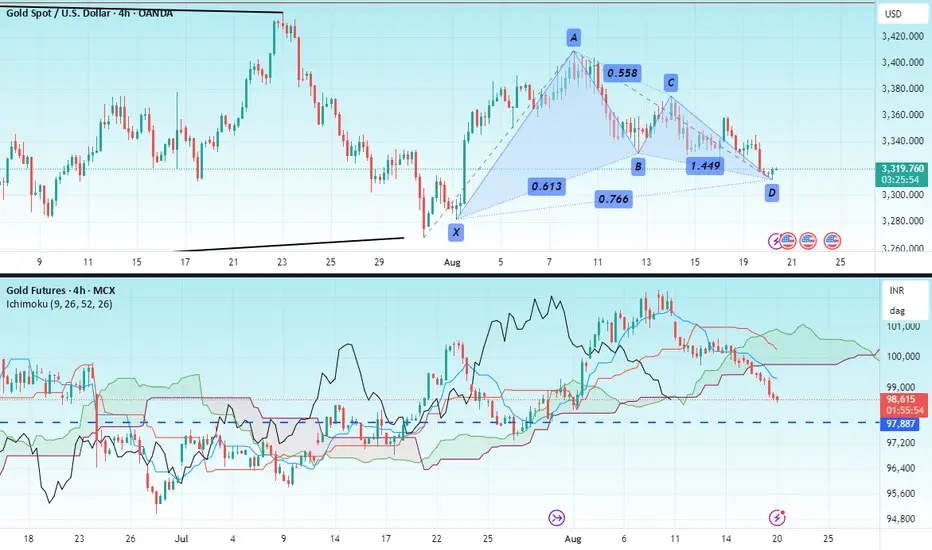
GOLDHello & welcome to this analysis
Gold at COMEX has formed a bullish Harmonic Gartley pattern in 4hr time frame suggesting a reversal in trend.
As long as it sustains above $3295 it could give a bounce/rally till $ 3345 - 3370 - 3400 - 3450.
Gold at MCX appears to be ending its pullback but due to INR $ fluctuations a bullish Harmonic pattern has not formed. One could look for bullish trades as long as its above 97900 for upside levels of 99400 - 100000 - 101000 - 102500. Keep in mind levels could alter due to forex changes
Overall GOLD is strong and has an upside triangle breakout target of $3700 open as long as it is above $3250 (refer to my earlier view published on Gold in the link)
All the best
August 29 Gold AnalysisAugust 29 Gold Analysis
Market Dynamics and Core Drivers
Recent volatility in the gold market has primarily revolved around three core factors: the debate over policy independence, uncertainty about tariff policies, and shifting interest rate expectations.
The continued development of US President Trump's dismissal of Federal Reserve Governor Tim Cook, seen as a direct challenge to the Fed's independence, has heightened market concerns about political interference in monetary policy. This unprecedented action marks a further escalation in Trump's attacks on the Fed's independence over its refusal to cut interest rates.
Regarding tariff policy, trade frictions between the US and some economies persist. A US-Indonesia agreement is unlikely to be reached in the near term, and tariffs on some goods risk increasing from 25% to 50%. This combination of "selective exemptions and potential doubling" creates greater uncertainty about the tariff path, increasing gold's appeal as a safe-haven asset.
Regarding interest rate expectations, futures market pricing indicates an over 87% probability of a 25 basis point rate cut at the Fed's September meeting. A low interest rate environment reduces the opportunity cost of holding non-interest-bearing gold while also putting pressure on the US dollar, creating a double positive for gold.
Technical Analysis
From a technical perspective, gold is currently in a volatile, but relatively strong, pattern.
On the daily chart, gold has been fluctuating between $3,120 and $3,450 for approximately five months since reaching a record high in April 2025. It may be at the end of a converging triangle, awaiting a breakout. The short-term moving averages are bullish, with key support at $3,395 (near the 5-day moving average) and $3,365 (near the 10-day moving average).
Key resistance lies in the $3,423-3,425 area (recent highs and rising trendline resistance). A breakout could open the door to $3,439 and $3,452. More significant resistance lies between $3,440 and $3,450, as well as the psychological level of $3,500.
On the 4-hour chart, connecting recent lows and highs reveals a rising wedge pattern. This pattern often serves as a consolidation structure, and the direction of its breakout should be monitored. Short-term top-to-bottom support lies between $3410 and $3405, followed by $3400 and $3395.
Technical indicators show that price is holding above the key 100-day exponential moving average ($3279.45). The 14-day relative strength index (RSI) remains firmly above its midline, near 60.50, confirming continued bullish momentum.
Trading Strategy
Regarding long positions, aggressive investors may consider a light long position if gold prices find support in the $3405-3415 area, targeting $3430-3440 with a stop-loss below $3390. Conservative investors may consider entering a long position after gold prices retrace and stabilize at $3390-3395, targeting $3410-3420 with a stop-loss below $3380.
Regarding short-term strategies, a light position can be used to short gold when it first hits the strong resistance zone of $3435-3445 and shows clear signs of pressure, with a target of $3410-3420 and a stop-loss above $3455. A follow-up strategy for a breakout can be used to short gold with a light position after it effectively breaks below the $3390 support level, with a target of $3370-3380 and a stop-loss above $3410.
Market volatility increased today, so it is recommended to keep positions below 50% of the typical level and reserve sufficient funds to mitigate potential adverse fluctuations or to identify better opportunities.
The US PCE data met expectations, indirectly proving bullish for gold. Wait for the release of the Consumer Confidence Index data before looking for an entry point.
Trade with caution and manage risk! Wish you good luck!

XAU/USD – Short-Term Structure & Key ZonesXAU/USD – Short-Term Structure & Key Zones
✨ Technical Outlook
✅ Breakout Confirmed: Price broke out of the downward channel and retested 3370 as new support.
📈 Momentum: Higher lows forming → buyers in control.
🎯 Upside target: 3425–3450 (major resistance zone).
⚠️ Risk: Failure at 3450 may trigger retracement back toward 3370 / 3320.
🌍 Fundamental Drivers
💵 USD Weakness: Market pricing in softer Fed stance → supports Gold.
🏦 Yields Stable: Lower real yields = bullish for non-yielding assets like Gold.
📉 Global Risk Factors: Central bank accumulation & geopolitical uncertainty continue to add safe-haven demand.
📌 Trading Plan (Pro View)
As long as price holds above 3370, bias remains bullish.
Watch for rejection signals near 3450 → potential short setup.

Captain Vincent | Gold holds 3400, breakout or pullback next?” FED turns dovish, Gold challenges a new Storm Breaker
1. News Wave 🌍
FED – Waller: “Tariffs are a kind of tax and do not increase inflation. I’m back with the ‘transitory team’ on inflation.”
👉 A clear dovish hint supporting a 25bps rate cut in September, with potential for 1–2 more cuts in the next 3–6 months.
US Senate: Hearing scheduled on Sept 4th for FED nominee S. Miran → Political–monetary spotlight.
Tonight: Market awaits PCE data, FED’s preferred inflation measure.
➡️ Summary: FED leaning dovish = mid-term bullish for Gold.
But short-term, Gold faces profit-taking pressure near resistance.
2. Technical Outlook ⚙️
On H1, Gold has repeatedly formed bullish BOS and crossed above 3,400.
Golden Harbor 🏝️ (Buy Zone 3375 – 3373): Large volume accumulation, aligned with FVG → Attractive entry if price pulls back.
Storm Breaker 🌊 (Sell Zone 3432 – 343x): At old ATH zone, high probability of supply pressure if tested.
Key Levels:
3,375 → Critical support “anchor”.
3,438 → Resistance target if bullish momentum continues.
3. Captain Vincent’s Map – Trade Scenarios 🪙
🔺 Golden Harbor 🏝️ (BUY Zone – Priority)
Entry: 3375 – 3373
SL: 3365
TP: 3378 → 3381 → 3384 → 3387 → 33xx
🔻 Storm Breaker 🌊 (SELL Zone – Old ATH Reaction)
Entry: 3432 – 343x
SL: 3442
TP: 3428 → 3425 → 3423 → 3420 → 33xx
4. Captain’s Note ⚓
"The Gold ship has sailed past 3400, but Storm Breaker 🌊 at 343x remains a tough challenge. If corrective waves appear, patiently wait at Golden Harbor 🏝️ to board for a more bullish September journey."

XAUUSD SD + OTE Long Trade (Smart Money Logic)This is my recent LONG trade on OANDA:XAUUSD on the 15 min chart.
When everyone was waiting to SHORT , I was waiting patiently in my LONG position.
Entry :
$3378 - Order Block + FVG + 0.5 Optimal Trade Entry level
Exit :
1st Target - $3400 (Standard Deviation Target 1 + 3400 psychological level)
2nd Target - $3418 (Standard Deviation Target 2)
NOTE: Smart Money DOES NOT HUNT stoplosses , they trigger their positions slightly below where they find maximum liquidity, because their positions are WAY TOO HUGE and need all the anti-orders (buy/sell stops) basically buy side or sell side liquidity so that they can fill in their orders. They are literally there to HELP YOU push the price up or down, you just need to place your stoplosses right! not too tight not too far off which may cause market structure shifts. SLs need to be absolutely perfect
Trade Explanation :
OANDA:XAUUSD should have used the 1D Bearish Order Block and we should have seen a fall or at least a decent enough retracement, but only 1 thing saved us, that is 15 min Bullish INDUCMENT and 1H BIAS . I never entered in a short trade!
I hope everyone saw these liquidity pools at the bottom and waited for them to get swept, but yeah, not always will liquidity be hunted right? Pools are areas with the most number of orders + stops. So aren't they supposed to be a good thing? :)
So, yes, DAILY bias is good, but again, LTF bias is also very necessary. Markets won't always respect the DAILY bias. Else, they would always be stuck in a sideways momentum right?
Think about it!
Also, do let me know in the comments what you feel about this trade and also share your analysis!

XAU/USD – End-of-Month Trading Strategy | MMFlow TradingGold is entering a short-term correction phase as we close the month. Looking at historical data, in the last 4 months, Gold has shown deep liquidity sweeps at month-end before continuing its upward rally. Today, we could see a similar setup.
📊 Market Context:
Month-end candles often create long wicks (343x → 335x).
If price breaks below 3395, we could see deeper liquidity grabs.
US Session has PCE Data release – expected to match the previous reading. This may trigger short-term volatility, providing opportunities for intraday traders.
📌 Key Levels
🔺 Resistance (Sell Zone)
3434 – 3436 → Short-term selling opportunity.
3424 – 3435 → A breakout here opens the path to new highs.
🔻 Support (Buy Zone)
3395 – 3390 → Important intraday liquidity zone.
3376 – 3374 (VPOC Area) → Strong demand zone, likely to attract buyers.
3363 – 3355 (Deep Liquidity Zone) → Extreme scenario, less likely without major news.
📌 Trade Plan
✅ Long Setup (Buy Zone)
Entry: 3376 – 3374
Stop Loss: 3369
Targets: 3380 – 3385 – 3390 – 3400 – 3410 – 3420 – ???
🎯 This aligns with the VPOC zone, highly probable for bullish reaction.
✅ Short Setup (Sell Zone)
Entry: 3434 – 3436
Stop Loss: 3440
Targets: 3430 – 3425 – 3420 – 3410 – 3400
⚠️ Short trades are better executed in Asian & European sessions to catch the correction move before US volatility.
📍 Summary:
Watch 3395 – 3375 closely → if this holds, September could bring strong bullish momentum.
Month-end dips are often the best opportunities to position for the next ATH rally.
Patience + precise levels = high probability setups.
🔥 Stay tuned with MMFlow Trading for precise institutional-style analysis & real-time market insights.
Gold 29/08: Smart Money Looks at 3444 or 3395 LevelsMarket Context (SMC View):
Gold faced rejection from the 3423 liquidity zone and is now pulling back.
Demand is seen near 3397–3395, which can give a bounce if price tests it.
Premium supply zones above 3422 and 3442 are good areas to look for selling opportunities.
🔼 BUY SCENARIO
Buy Zone: 3397 – 3395
Stop Loss: 3389
Targets: 3405 → 3415 → 3425
🔽 SELL SCENARIO 1 (Price Action)
Sell Zone: 3422 – 3424
Stop Loss: 3430
Targets: 3412 → 3400
🔽 SELL SCENARIO 2 (Swing)
Sell Zone: 3442 – 3444
Stop Loss: 3452
Targets: 3425 → 3412 → 3400
📌 Conclusion & Notes
Bias: Buy near 3397–3395, then watch for possible liquidity grabs at 3422–3424 or a bigger sweep near 3442–3444 to go short.
Key Levels: 3422–3424 is the first intraday supply zone, while 3442–3444 is the major swing sell zone.
Tip: Wait for rejection candles or confirmation before selling.
Risk: Gold is very volatile; use strict stop losses and manage capital carefully.

A strong ~1:10 RnR XAUUSD/Gold trade idea.Gold has created a good price action which may lead to a very high RnR price movement.
Here are signals identified for the trade.
1. It is breaking trend inline after and earlier fake out. Which is a strong signal for upside move.
2. Taking reversal at golden zone of 4H last swing.
3. Rejection candle at 1H.
4. Bullish diversanse is already observed in RSI
5. Taking support from bullish trend line.
6. 5m W pattern is created and breakout done.
7. Price is taking pull back to broken resistance.
8. It may 1:10 trade if everything goes as plan.
9. Price rejection should be observed at the pullback level before taking further upside movement.
P.S.- This is jut an idea not trade recommendations.

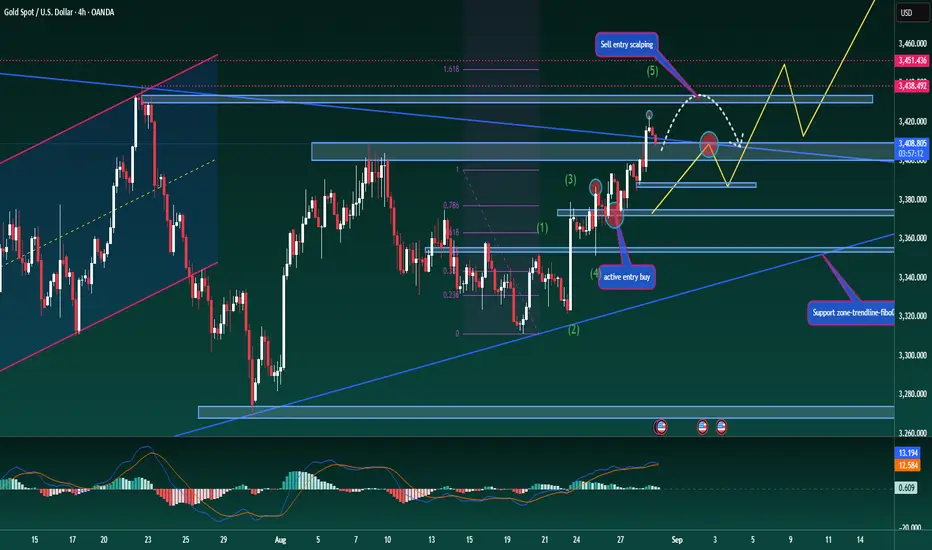
Gold Trading Scenario – Friday OutlookGold Trading Scenario – Friday Outlook
Hello traders,
Fridays are often challenging for forex traders. As the week closes, bankers wrap up their positions, creating unpredictable market moves. This is especially tricky for those who rely on timing-based strategies, so it’s important to watch the smaller fluctuations closely today.
Looking at the current gold structure, the uptrend remains intact. Buying pressure is strong enough to push towards the next projected levels. Technical indicators continue to support a bullish view, with MACD showing steady momentum as both volume and moving averages remain positive.
From an Elliott Wave perspective, gold is moving in **wave 5**, which is typically an extended wave. This allows us to maintain a bullish outlook unless price breaks below **3386** and confirms with at least one candle close on the M15 timeframe or higher. In that case, the scenario would be invalidated. Until then, buying around this level with a stop-loss just below the key support zone (about 1 dollar lower) remains the preferred approach.
Selling opportunities are not yet ideal, but for those looking at short setups, the **3450 zone** should be monitored as a major resistance. In the shorter term, **3430** can act as a reaction level for temporary sells.
Fridays also tend to bring more news-driven traps, so be extra cautious. It’s a day that can really test less experienced traders.
This is my view for today’s session – use it as reference, and trade with discipline.
---
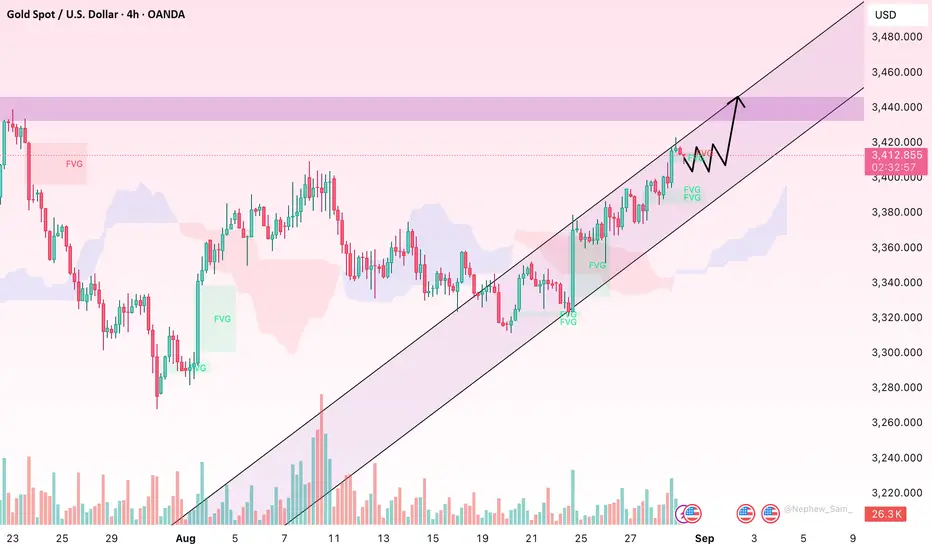
Steady Climb: Gold Confirms Breakout, Support Shifts to 3400We have seen impressive strength on gold with a slow but steady breakout above 3400, confirming a bullish tone in the market. Price has also cleared the previous swing high near 3410, turning this zone into fresh support (3400–3410). Alongside this, the rising trendline support (black line) continues to guide the uptrend, adding confidence to the move.
From a price action perspective, this breakout looks healthy and signals that buyers are gaining control. The next big level to watch is the 3450 zone, which stands as the key breakout area for a larger move higher. On the flip side, as long as 3400–3410 holds, the bullish outlook remains intact.
With both the monthly and weekly closing happening today, the candle close will be crucial in setting the tone for the next leg. A strong close above 3410 would further validate the bullish breakout, while any failure to hold above support could bring some profit-taking. For now, the overall structure favors the bulls.

Gold Holds Uptrend – Eyes on 3.395 BreakHello everyone,
Observing the latest chart, gold’s uptrend remains firmly in place. The price moves consistently above the Ichimoku cloud, while the forward cloud thickens and tilts slightly upward, forming a supportive cushion for the next leg higher. Below, the recently formed FVG demand zone at 3.372–3.380 has been lightly tested multiple times and rebounded, showing solid absorption by buyers. Conversely, above, the thin FVG supply around 3.395–3.405 acts as the “gate” for the market to enter a new upward leg.
Volume data also reinforces the bullish scenario: green candles often come with higher volumes than red ones, especially after the breakout on 27–28/8. The “higher highs – higher lows” structure since the 22/8 rebound indicates buyers remain in control.
Moreover, news factors are creating a tailwind. US tariff tightening, temporary halts on international mail in several countries, and supply shortage risks have sparked inflation and supply chain concerns, supporting gold as a safe-haven asset.
Trend-following strategy: prefer buying while price holds above 3.372–3.380 (both FVG zone and Ichimoku cloud edge), targeting 3.413 first, then 3.433. This scenario fails if price closes below 3.360, losing the cloud cushion and breaking the recent low. The 3.395–3.405 zone is a key confirmation: a clean breakout here often leads to a smoother, stronger upward move.
Do you think gold has enough strength to break 3.395 in the coming sessions?

XAU/USDThis XAU/USD setup is a sell trade, highlighting a bearish short-term outlook on gold. The entry price is 3414, with a stop-loss at 3423 and an exit price at 3396. This trade seeks to capture an 18-point profit while risking 9 points, maintaining a balanced 1:2 risk-to-reward ratio.
Selling at 3414 suggests the trader expects downward pressure, possibly triggered by strength in the U.S. dollar, rising bond yields, or profit-booking after recent gains. The exit at 3396 is strategically placed near a support area where buyers might re-enter, making it a logical profit-taking level. The stop-loss at 3423 limits potential losses if bullish momentum resumes, ensuring disciplined risk management. This setup is ideal for short-term traders looking to ride intraday weakness.

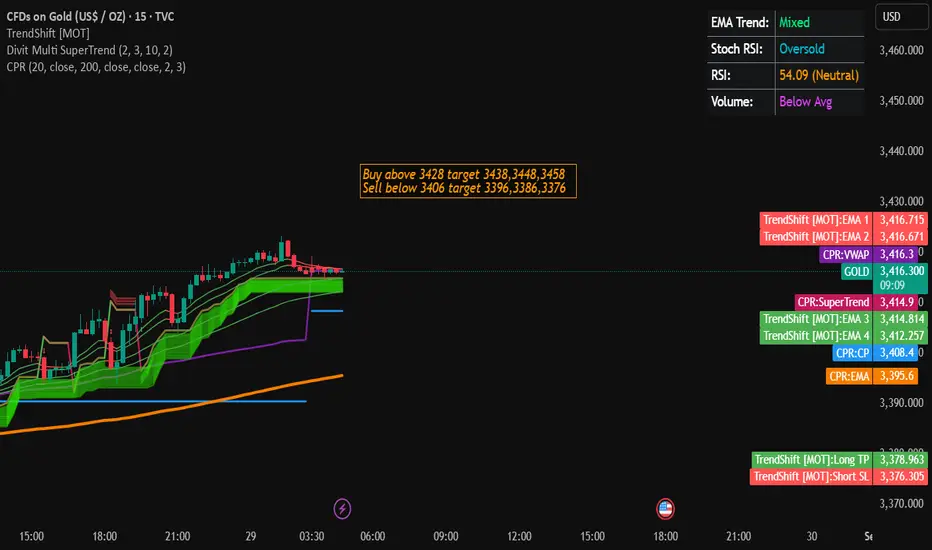
Gold Trading Strategy for 29th August 2025🟡 GOLD Trading Strategy (1-Hour Candle Breakout Method)
📌 Overview
This strategy is based on the breakout of a one-hour candle. We wait for confirmation by ensuring the candle closes above or below a key price level. Once confirmed, we plan our entry above the high (for buy) or below the low (for sell) of that candle. This helps avoid false breakouts.
🔼 Buy Setup (Long Position)
Condition: Wait for a 1-hour candle to close above $3428.
Entry Point: Place a buy order above the high of that candle.
Targets:
🎯 Target 1 → $3438
🎯 Target 2 → $3448
🎯 Target 3 → $3458
Stop Loss: Below the low of the breakout candle (to manage risk).
🔽 Sell Setup (Short Position)
Condition: Wait for a 1-hour candle to close below $3406.
Entry Point: Place a sell order below the low of that candle.
Targets:
🎯 Target 1 → $3396
🎯 Target 2 → $3386
🎯 Target 3 → $3376
Stop Loss: Above the high of the breakout candle (to protect from reversals).
📊 Why This Works
✅ Helps filter out false breakouts since we wait for the candle to close before entering.
✅ Provides clear entry, target, and stop loss levels.
✅ Works best in high-volatility markets like Gold (XAU/USD).
⚠️ Disclaimer
This strategy is shared for educational purposes only. It does not constitute financial or investment advice. Trading in gold, forex, or commodities involves high risk and may result in the loss of your capital. Always do your own analysis, manage your risk carefully, and trade responsibly.
gold longthere is a symmetrical triangle forming in gold, the daily has ben consolidating good enough, the worst case will be from third touch point it will bounce back and will come little down but if that also happens then also i expect it to make another all time high

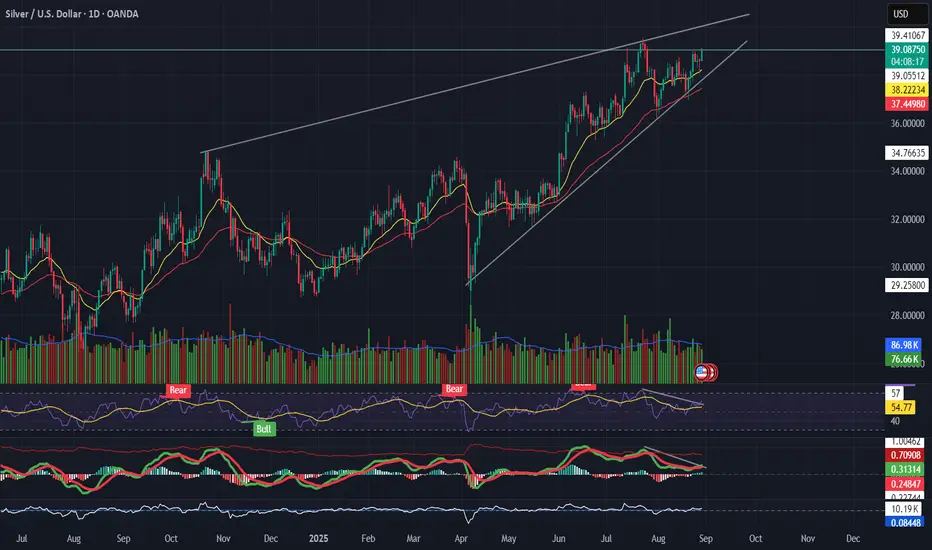
Silver (XAGUSD) Trading in a rising wedge Pattern📌 Silver (XAGUSD)
Trading in a rising wedge, pressing resistance near $39.
RSI divergence → price making higher highs, momentum not following.
MACD rolling over while price climbs = possible bearish divergence.
Support to watch: $37.3 → wedge breakdown if breached.
👉 Bullish only if $39.5 breaks with strong volume; otherwise, risk of pullback.
---
🎯 Takeaway
Silver = extended wedge → caution, momentum weak.
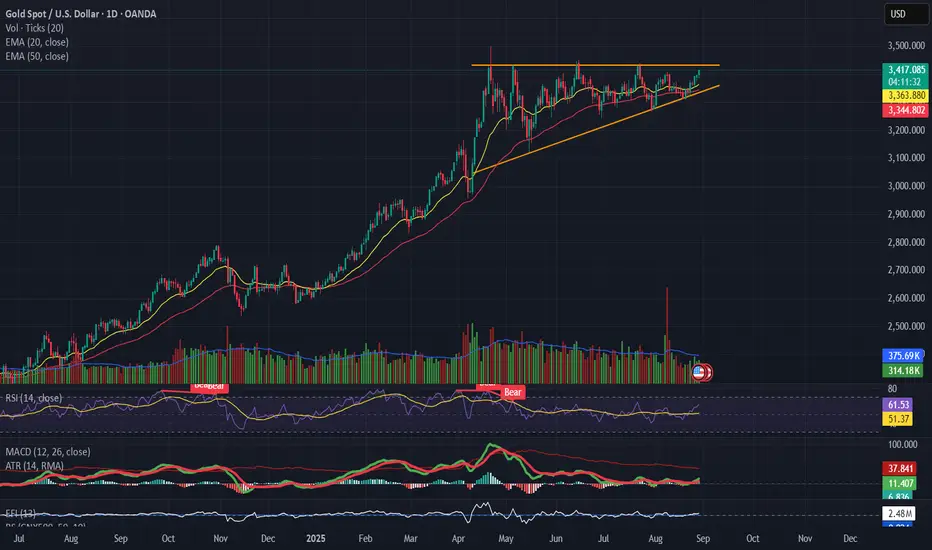
GOLD(XAUUSD) Forming a pennant / ascending triangle 📌 Gold (XAUUSD)
Forming a pennant / ascending triangle with strong resistance near $3,390 – 3,400.
Volume is declining, suggesting indecision.
RSI holding above 50 but not powering higher → momentum is slowing.
MACD flatlining, no fresh bullish impulse yet.
👉 Breakout above $3,400 needed for continuation. Breakdown below $3,340 risks correction.
Xau USD 15 min Chart I posted last time Xau USD chart when price was 3406 . Now U can check It's given good move . U can check my old post of Xau USD . It's good movement by Xau USD but now Risk Reward is not good. Let be take retracement.

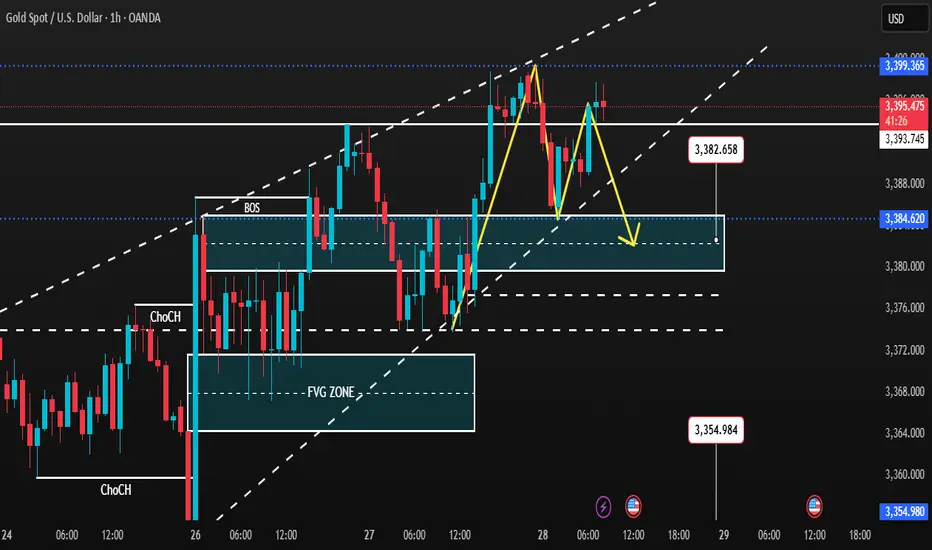
Divergence has appeared at H4 – TOP IS ABOUT TO BE FORMEDGold SMC Daily Plan – 28/08
Market Context (SMC view):
Gold is trading near 3395–3396 after a sharp bullish rally. Early bearish divergence is visible on H4, hinting at a short-term top.
Key resistance is at 3400 – a clean breakout above may trigger liquidity sweep towards 342x–343x, retesting the old ATH.
On the downside, if 3370 support breaks, price may correct deeper into 335x BUY zone for a strong bullish setup.
Key Levels:
Resistance: 3396–3400 (Sell Zone), 342x–343x (Liquidity sweep area)
Support: 3370, 3354–3352 (Buy Zone), 3325 (SL for longs)
SMC Zones & Liquidity Pools:
BUY ZONE 1: 3354–3352 (below liquidity sweep under 3370)
SL: 3347
TP: 3365 → 3375 → 3385 → 3395 → 3400+
BUY ZONE 2: 3380–3382
SL: 3374
TP: 3390 → 3400 → 3415 → 3430 → 3450+
SELL ZONE: 3408–3410 (above recent high)
SL: 3416
TP: 3390 → 3380 → 3375 → 3360
Trading Plan & Scenarios:
Sell Setup (Primary Bias – Divergence Play):
Look for liquidity grab above 3396–3399 (into resistance).
Enter short with SL above 3403.
Partial profits at 3390–3380–3375; keep runner towards 3360 if support breaks.
Buy Setup (Counter Play – Break & Retest):
If price dips into 3354–3352 BUY zone, wait for bullish confirmation (choch/BOS on lower TF).
Enter long with SL below 3347.
Targets: 3365 → 3375 → 3385 → 3395 → 3400+
Confluences:
H4 bearish divergence signalling possible exhaustion at top.
Liquidity pools above 3396 and below 3370 remain untapped.
FVG and imbalance align with 335x buy zone.
USD Gold Day chart Wave analysis After almost three months, a good buying opportunity is visible in gold. If you understand the technical chart formation, then a triangle is formed after the motive wave. This is a perfect example of contracting triangle in front of you, which qualifies for a new high. This is my view. There is no advice for buying or selling, only technical education. Before doing any trade or investment, take advice from your financial advisor
Thanks
MKT Learner
