The behavior of gold and stocks,The behavior of gold and stocks, plus the Fed's actions, are looking similar to 2007. In 2007, the Fed interest rates down,
The price of GOLD went up, stocks were worth down , and yields (Treasury bond yields) went down, signaling a recession. #GOLD #Silver
Futures market

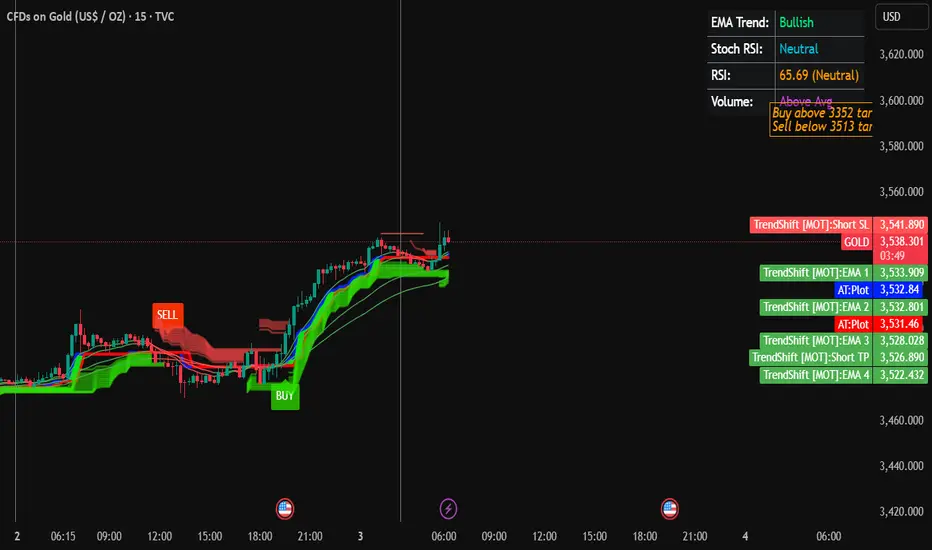
Gold Trading Strategy for 03rd September 2025📊 Gold Trading Plan
🔹 Buy Setup
Condition to Buy: Enter a Buy position only if the price closes above the high of the 15-minute candle at $3352.
Targets for Buy:
$3363
$3374
$3385
🔹 Sell Setup
Condition to Sell: Enter a Sell position only if the price closes below the low of the 1-hour candle at $3513.
Targets for Sell:
$3501
$3490
$3480
📝 Notes for Beginners
Wait for Candle Close – Do not enter before the candle fully closes above or below the given level.
Use Stop Loss – Always protect your trade with a stop loss (example: slightly below entry for buys, or above entry for sells).
Risk Management – Never risk more than 1–2% of your trading capital on a single trade.
Targets – You can exit at each target partially or hold until the final target depending on your strategy.
⚠️ Disclaimer: This information is for educational purposes only and should not be considered financial advice. Trading in gold or any financial markets involves risk, and you should do your own research or consult a licensed financial advisor before making trading decisions.
Bullish Finally we get triangle break out on this chart,now 3333 is very good support,my first short-term target is 3540
Some corrections visible at this level but trand is super bullish
My swing target is 3780 atleast and stoploss is 3333

Simple Support & Resistance Strategy on XAUUSDThis chart illustrates a simple but effective support and resistance trading approach.
Support Levels:
Support 1: Acts as a key demand zone where buyers may step in if price revisits this area.
Support 2: A minor intraday support that can provide short-term bounce opportunities.
Resistance Levels:
Resistance 1: The broader supply zone where sellers previously pushed price lower.
Resistance 2: A closer level that may act as a barrier for short-term upward moves.
What’s Happening:
Currently, price has broken below Support 2 and is testing downward momentum. Two possible scenarios are highlighted:
Price retests Support 1, holds, and then bounces back toward Resistance 2.
Price fails to hold at Support 1, leading to further downside continuation.
Probability Outlook:
If buyers defend Support 1 strongly, probability favors a bounce toward Resistance 2.
If Support 1 breaks with volume, probability favors a bearish continuation move to lower levels.
This setup shows how simple zone-to-zone trading can provide clear potential paths without overcomplication.
👉 Always remember: This is not financial advice, but an educational demonstration of support/resistance principles.

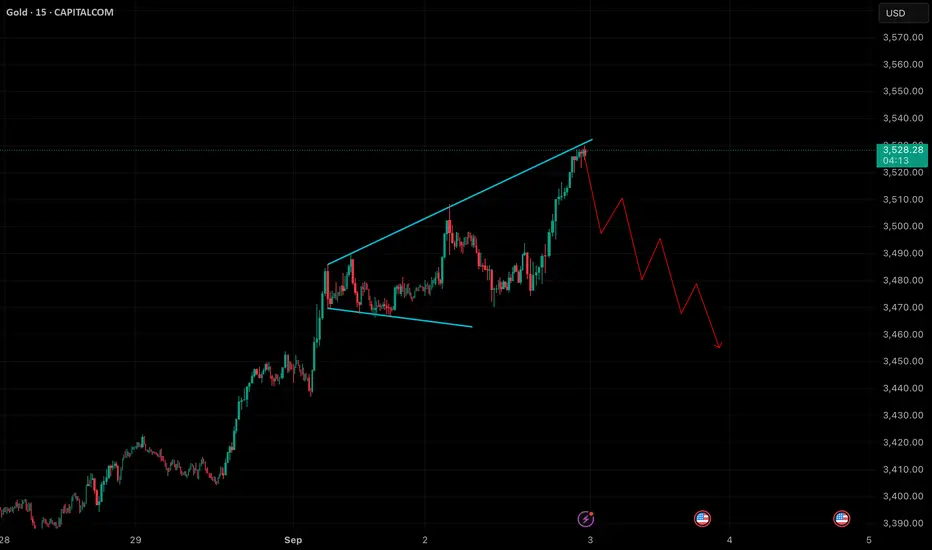
XAUUSD Alert| Liquidity Grab or Trend Reversal?”XAUUSD Alert 🚨 | Liquidity Grab or Trend Reversal?”
Gold has recently pushed into the 3525 – 3550 rejection zone, a level that has historically acted as strong supply. After this extended bullish rally, price is now showing early signs of exhaustion. This could be a liquidity grab above resistance before the market corrects lower.
My expectation here is a short-term pullback. The first key area I’ll be watching is around 3450, which lines up with a smaller demand zone and could act as a temporary support. If buyers fail to defend that level, then I expect continuation toward the 3330 – 3320 zone, which is my final target and also a major higher-timeframe support point.
This level is very important because it was previously a strong base for accumulation, and if tested again, it could provide a potential long opportunity. However, if price breaks below 3320 decisively, it would open the door for a much deeper correction.
Overall, my short-term outlook is bearish retracement, but I’ll be closely watching how price reacts once we reach the deeper support levels.

Gold short term Gold may halt from here. Expecting to go down. Gold completed 3 drive pattern and generally 3 drive pattern is short term reversal pattern.
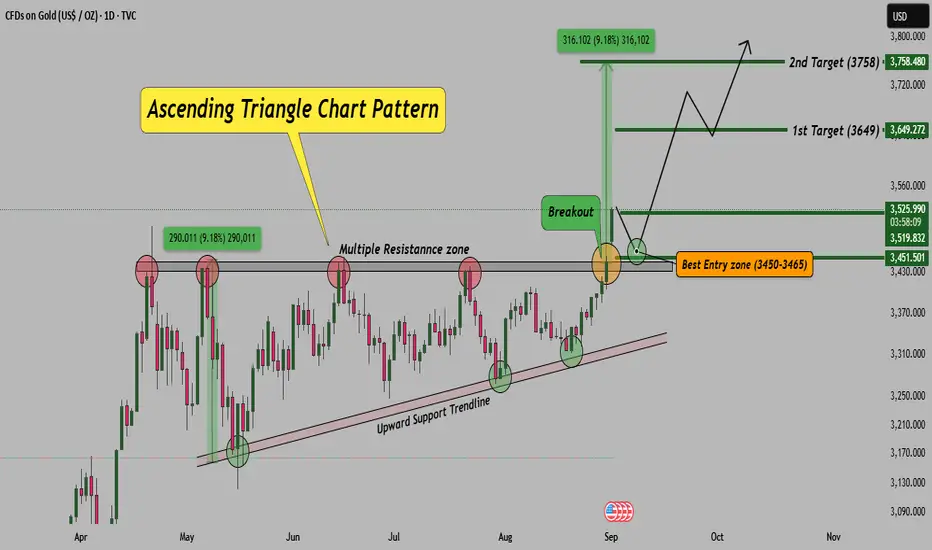
Gold Daily Chart – Ascending Triangle Breakout!Gold has formed a strong ascending triangle pattern on the daily timeframe. The price has successfully broken above the resistance zone, confirming bullish momentum. Such patterns generally indicate continuation of the uptrend, especially when supported by volume and strong price action.
Chart Observation:
As long as price holds above 3,450, the bullish setup remains valid.
A retest of the breakout zone can provide the best risk-to-reward entry opportunity.
Traders should keep an eye on volume confirmation while entering trades.
Note: If levels sustain and setup remains intact, I will share live trade updates in real time. Stay tuned.
Disclaimer: This analysis is for educational purposes only. Please do your own research or consult your financial advisor before taking trades.
Elliott Wave Analysis – XAUUSD 2/9/2025
Momentum
• D1: Momentum is still overbought and has been “sticking together” for about 5 consecutive daily candles. Usually, this amount of candles is enough for a potential reversal. This suggests that price may rise for only 1–2 more D1 candles before a daily reversal occurs.
• H4: Momentum is currently turning upward, which indicates that today the market is likely to continue higher for at least 2 more H4 candles.
• H1: Momentum is turning down. This implies that before H4 can continue its upward move, H1 may first produce a short corrective pullback and then resume the uptrend in line with H4.
——————————————-
Wave Structure
• D1: Price is still within wave 5 after completing a correction. Since D1 momentum has already stayed overbought for 5 candles, a multi-day correction may soon develop. This correction will clarify whether the current move is wave 1 of a larger wave 5, or if the larger wave 5 has already finished.
• H4: Price is completing the 5-wave structure (1-2-3-4-5 in red). Breaking above the wave 3 high confirmed that wave 5 in red is unfolding. With momentum on H4 turning up, the upward progress of wave 5 in red is expected to continue.
• H1: Within the 5-wave red structure, we can currently count 9 waves, where the upward waves are nearly equal in length. This reflects an extended wave iii (green). Counting 9 waves also hints that wave iii green is near its end, which implies wave 5 red may also be approaching completion.
Drawing an Elliott channel from wave 2 to wave 4 (red) and extending it over the top of wave 3 shows that wave 5 red is nearing the upper boundary of the channel. This supports the expectation that wave 5 red is close to finishing.
On a smaller scale, the current short-term decline in H1 looks like wave 4 of wave 5 red. The target zones for wave 4 have already been marked on the chart.
—————————————
Principle & Plan
• We do not enter against wave iii, especially in the case of an extended wave iii.
• Wait for wave iv to complete in order to look for buying opportunities into wave v (green).
—————————————
Wave iv targets:
• 23.6% retracement of wave iii: 3479.3
• 38.2% retracement of wave iii: 3459.7
Wave 5 target:
• Projected at 3577.6 (the farthest TP).
—————————————
Trading Plan
• Buy Zone 1: 3481 – 3478
o SL: 3470
o TP1: 3521
• Buy Zone 2: 3461 – 3459
o SL: 3450
o TP1: 3521

USOIL BUYING SETUPREASON OF SELLING SETUP:-
1.taken support from previous level
2.price bending from this level
3.sellers trap

XAUUSD – Sell Strategy ActivatedXAUUSD – Sell Strategy Activated
Hello traders,
Gold has followed the expected scenario, reacting precisely around the 3508–3510 zone. This correction is a good signal to consider a bearish outlook. However, for a clearer confirmation, price needs to close an M15 candle below 3466. If that happens, the previous bullish wave will be considered invalid, giving a stronger probability for the Sell setup.
Structurally, gold is still within the main rising channel, which means an early short entry should wait until liquidity from the small FVG zone above is fully taken.
Technical indicators are supporting this view:
MACD has shown consistent bearish momentum in the last 4 H1 candles.
Several indicators are already showing divergence, pointing to weakening bullish strength.
Sell zone to watch: around 3488–3491.
Setup invalidated if price breaks above the nearest resistance.
At this stage, the appetite for new long positions is fading, and buying at these levels carries greater risk. Remember, no trend moves in one direction forever – for price to reach higher targets, secondary corrective moves are necessary.
This is my trading scenario for gold in the coming sessions. Take it as reference and share your thoughts in the comments.

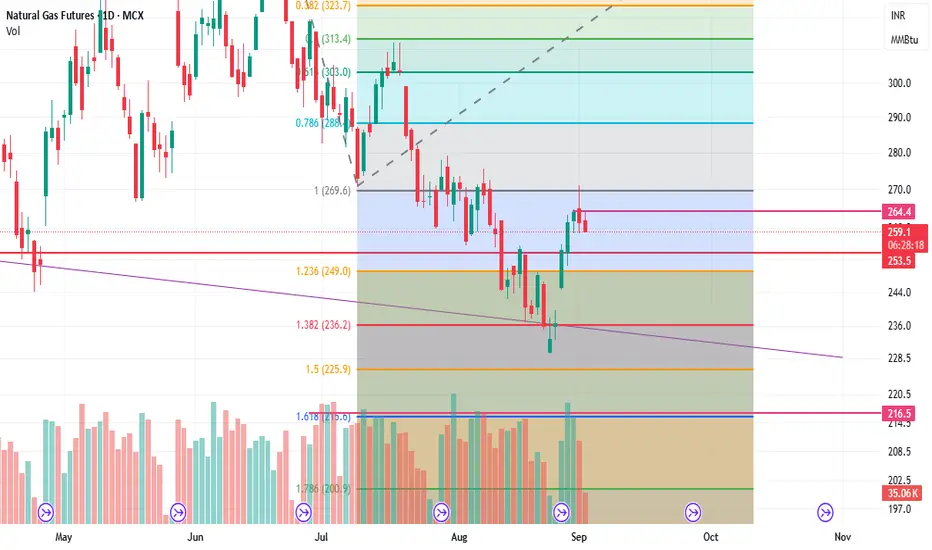
short natural gasNATURAL gas looks weak if breaks 230 then 160 possible .until u can play short upto 240 with sl of 275.
Part 9 Trading Masterclass With ExpertsIntroduction to Options
An option is a type of derivative contract. A derivative derives its value from an underlying asset, which could be a stock, index, commodity, currency, or bond. When you buy or sell an option, you don’t directly own the asset but instead own the right to buy or sell it at a pre-agreed price within a specific period.
At its core, an option is a contract between two parties:
The buyer (holder) of the option, who pays a premium for rights.
The seller (writer) of the option, who receives the premium and carries obligations.
Unlike shares, where ownership is straightforward, options deal with probabilities, rights, and conditions. This makes them flexible but also more complex.
Key Features of Options
Before diving deeper, let’s simplify the main features:
Underlying Asset – The financial instrument on which the option is based (e.g., Reliance Industries stock, Nifty50 index).
Strike Price (Exercise Price) – The price at which the underlying asset can be bought or sold.
Expiration Date (Maturity) – The last date the option can be exercised.
Option Premium – The cost of buying the option, paid upfront by the buyer to the seller.
Right but Not Obligation – The buyer can choose to exercise the option but is not compelled to.

Part 4 Institutional Trading Intermediate Strategies
(a) Bull Call Spread
Buy a call at lower strike and sell a call at higher strike.
Reduces cost but caps profit.
Good for moderately bullish markets.
(b) Bear Put Spread
Buy a put at higher strike, sell a put at lower strike.
Used in moderately bearish markets.
(c) Straddle
Buy one call and one put at the same strike and expiry.
Profits if stock makes a big move in either direction.
Expensive, requires high volatility.
(d) Strangle
Buy OTM call + OTM put.
Cheaper than straddle but needs a larger price move.
(e) Iron Condor
Combination of bull put spread + bear call spread.
Profits when price stays in a range.
Great for low-volatility environments.

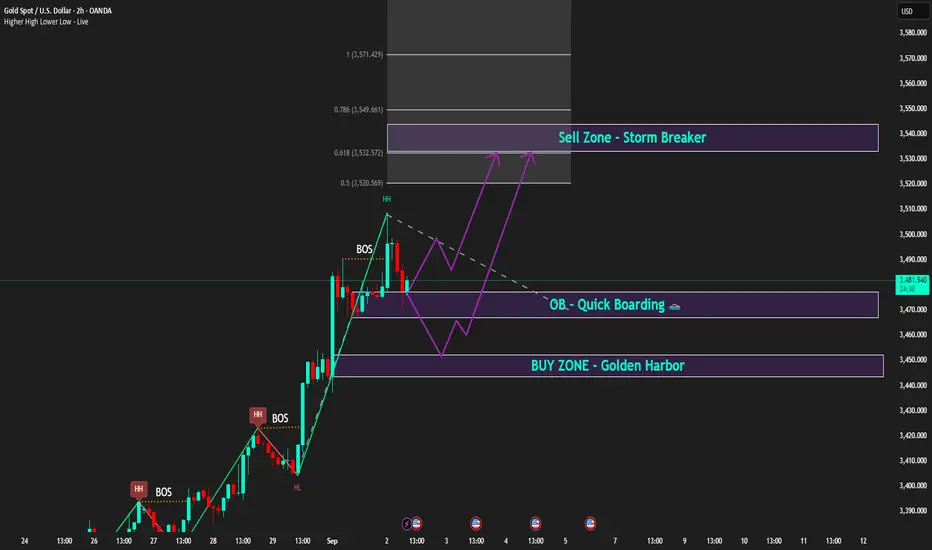
Bullish trend intact, waiting for PMI to spark the next waveCaptain Vincent – Gold Plan XAU/USD
1. Market Waves 🌍
The USD continues to weaken as investors grow more confident that the FED will cut rates in the coming months. With the greenback losing appeal, large flows are leaving cash and moving into safe-haven assets → gold stands out as the number one choice .
👉 This supports gold’s sustainable bullish trend . If USD selling pressure persists, the market could see fresh breakouts into year-end.
2. Technical Outlook ⚙️
H2 Chart: gold just created a Higher High after BOS , confirming bullish dominance.
Golden Harbor 🏝️ (Buy Zone 3,450 – 3,452): aligned with previous FVG , heavy liquidity zone.
Quick Boarding 🚤 (OB ~3,470): intermediate support, ideal for quick pullback entries.
Storm Breaker 🌊 (Sell Zone 3,538 – 3,540): resistance at Fibo 0.618 – 0.786 , strong chance of profit-taking if tested.
Intraday bias: Wait for pullback to Buy. Short-term Sell only if price hits Storm Breaker.
3. Captain Vincent’s Map – Key Levels 🪙
Golden Harbor 🏝️ (Buy Zone): 3,450 – 3,452
Quick Boarding 🚤 (OB Support): 3,470
Storm Breaker 🌊 (Sell Zone): 3,538 – 3,540
4. Trade Scenarios 📌
🔺 Golden Harbor 🏝️ (BUY – Priority)
Entry: 3,450 – 3,452
SL: 3,444
TP: 3,455 → 3,458 → 3,462 → 3,465 → 34xx
🔻 Storm Breaker 🌊 (SELL Reaction)
Entry: 3,538 – 3,540
SL: 3,548
TP: 3,535 → 3,532 → 3,529 → 35xx
5. Captain’s Note ⚓
“The gold sail is still filled with bullish wind, but Storm Breaker 🌊 above may create counter waves. Stay patient at Golden Harbor 🏝️ for precise entries, and watch the PMI at 21:00 – the catalyst for the next wave.”
XAUUSD Market Update - Sep 02, 2025XAUUSD Market Update
Current Price: $3,478
Gold is consolidating within a triangle pattern structure, approaching a decisive phase. The next move will depend on whether price sustains above support or confirms a false breakout.
🔼 Bullish Scenario
Sustained close above $3,500 will confirm strength.
Upside targets: $3,600 – $3,700.
Key support to hold: $3,420.
🔽 Bearish Scenario
Failure to hold $3,420 would signal a false breakout.
Downside targets: $3,265 – $3,200.
Extended weakness could lead towards $3,145.
✅ Recommendation
Short-term traders: Wait for a confirmed breakout above $3,500 before entering long positions.
Risk management: Keep stops below $3,420 to avoid false breakout traps.
Medium-term investors: Watch for retests near $3,265 – $3,200 as potential accumulation zones if bearish retracement occurs.

SILVERHello & welcome to this analysis
Silver in daily time frame appears to be in its 5th wave.
The larger impulse could end anywhere between $43.50 - 45 / INR 125000 - 129000. From there I expect it to retrace to $38 /INR 116000
MCX Silver will depend largely on $:INR movement.
Silver remains a strong commodity for medium to long term and all dips should be used to add.
All the best

AI Trading Psychology1. The Role of Psychology in Traditional Trading
Before AI, trading was primarily a human-driven endeavor. Every market move reflected the collective emotions of thousands of participants. Understanding traditional trading psychology provides the foundation for how AI modifies it.
Key Psychological Factors in Human Trading
Fear and Greed: Fear leads to panic selling; greed fuels bubbles. Together, they explain much of market volatility.
Loss Aversion: Traders hate losing money more than they enjoy making money. This leads to holding losing trades too long and selling winners too early.
Overconfidence: Many traders believe their analysis is superior, leading to risky positions and underestimating market uncertainty.
Herd Behavior: People often follow the crowd, especially in uncertain conditions, which creates manias and crashes.
Confirmation Bias: Traders seek information that supports their views and ignore contradictory evidence.
Example
During the 2008 financial crisis, fear spread faster than rational analysis. Even fundamentally strong stocks were sold off because investor psychology turned negative. Similarly, the Dot-com bubble of 2000 was fueled more by collective greed and hype than by realistic fundamentals.
In short, psychology is central to markets. AI trading challenges this dynamic by removing emotional decision-making from the execution layer.
2. How AI Transforms Trading Psychology
AI changes trading psychology in two major ways:
On the trader’s side, by reducing the emotional burden of decision-making.
On the market’s side, by reshaping collective behavior through algorithmic dominance.
AI’s Strengths in Overcoming Human Weaknesses
No emotions: AI doesn’t panic, doesn’t get greedy, and doesn’t second-guess itself.
Data-driven: It relies on massive datasets instead of gut feelings.
Consistency: It sticks to strategy rules without deviation.
Speed: It reacts in milliseconds, often before human traders even notice market changes.
Example
High-frequency trading (HFT) firms use algorithms that can execute thousands of trades per second. Their strategies rely on speed and mathematics, not human intuition. The psychological edge comes from removing human hesitation and inconsistency.
The Psychological Shift
For traders, using AI means learning to trust algorithms over instinct. This is not easy, because humans are naturally emotional and skeptical of machines making high-stakes financial decisions. The new psychological challenge is not just controlling one’s emotions but balancing trust and oversight in AI systems.
3. Human-AI Interaction: Trust, Fear, and Overreliance
One of the most important psychological dimensions of AI trading is human trust in technology. Traders must decide how much autonomy to give AI.
Trust Issues
Overtrust: Believing AI is infallible, leading to blind reliance.
Undertrust: Constantly interfering with AI decisions, which undermines performance.
Fear of the Unknown
Many traders feel anxious about “black-box AI” models like deep learning, where even developers cannot fully explain why the system makes certain decisions. This lack of transparency creates psychological unease.
Overreliance
Some traders outsource their entire decision-making process to AI. While this removes emotional interference, it also creates dependency. If the system fails or encounters unseen market conditions, the trader may be ill-prepared to respond.
Example
The 2010 Flash Crash showed the danger of overreliance. Algorithms created a cascade of selling that temporarily erased nearly $1 trillion in market value within minutes. Human oversight was slow to react because many traders trusted the machines too much.
This highlights a paradox: AI reduces human psychological flaws but introduces new psychological risks related to trust, dependence, and control.
4. Cognitive Biases in AI Trading
Although AI itself is not emotional, the humans designing and using AI systems bring their own biases into the process.
Designer Bias
AI reflects the assumptions, goals, and limitations of its creators.
For example, if a model is trained only on bullish market data, it may perform poorly in bear markets.
User Bias
Traders may interpret AI outputs selectively, aligning them with pre-existing beliefs (confirmation bias).
Some traders only follow AI signals when they match their own intuition, which defeats the purpose.
Automation Bias
Humans tend to favor automated suggestions over their own judgment, even when the machine is wrong. In trading, this can lead to dangerous blind spots.
Anchoring Bias
If an AI system provides a target price, traders may anchor to that number instead of re-evaluating based on new data.
In essence, AI does not eliminate psychological biases; it shifts them from direct decision-making to the way humans interact with AI systems.
5. Emotional Detachment vs. Emotional Influence
AI offers emotional detachment in execution. A machine doesn’t panic-sell during volatility. But human emotions still play a role in how AI systems are used.
Benefits of Emotional Detachment
Prevents irrational trades during panic.
Maintains discipline in following strategies.
Reduces stress and fatigue from constant monitoring.
The Emotional Influence Remains
Traders still feel anxiety when giving up control.
Profit or loss generated by AI still triggers emotional reactions.
Traders may override AI decisions impulsively, especially after losses.
Example
A retail trader using an AI-based trading bot may panic when seeing consecutive losses and shut it down prematurely, even if the system is statistically sound in the long run. Here, psychology undermines the benefit of AI’s discipline.
6. AI’s Psychological Impact on Market Participants
AI does not only affect individual traders—it changes the psychology of entire markets.
Increased Efficiency but Reduced Transparency
Markets with high algorithmic participation move faster and more efficiently. However, the lack of transparency in AI strategies creates uncertainty, which increases anxiety among traditional traders.
Psychological Divide
Professional traders with AI tools feel empowered, confident, and competitive.
Retail traders without access often feel disadvantaged and fearful of being exploited by machines.
Market Sentiment Acceleration
AI can amplify psychological extremes:
Positive sentiment spreads faster due to automated buying.
Negative sentiment cascades into rapid sell-offs.
This leads to shorter cycles of fear and greed, creating more volatile but efficient markets.
7. Ethical and Behavioral Implications
AI trading psychology extends into ethics and behavior.
Ethical Questions
Should traders use AI to exploit behavioral weaknesses of retail investors?
Is it ethical for algorithms to manipulate order books or engage in predatory strategies?
Behavioral Shifts
Younger traders may grow up trusting AI more than human intuition.
Traditional investors may resist, clinging to human-driven analysis.
This divide reflects not just technological adoption but also psychological adaptation to a new era of finance.
8. The Future of AI Trading Psychology
Looking ahead, AI trading psychology will continue to evolve.
Human-AI Symbiosis
The best outcomes will likely come from a hybrid approach:
AI handles execution and data analysis.
Humans provide judgment, ethical oversight, and adaptability.
Enhanced Transparency
To build trust, future AI systems may integrate explainable AI (XAI), allowing traders to understand the reasoning behind decisions. This will reduce anxiety and increase confidence.
Education and Adaptation
As traders become more familiar with AI, the psychological barriers of fear and mistrust will decline. Training in both technology and behavioral finance will be essential.
Market Psychology Evolution
Over time, collective market psychology may shift. Instead of being dominated by fear and greed of individuals, markets may increasingly reflect the programmed logic and optimization goals of algorithms. However, since humans still control AI design, psychology will never fully disappear—it will just manifest differently.
Conclusion
AI trading psychology is a fascinating blend of traditional behavioral finance and modern technological adaptation. While AI removes human emotions from execution, it introduces new psychological dynamics: trust, fear, overreliance, and ethical dilemmas.
The key insight is that psychology doesn’t vanish with AI—it transforms. Traders must now master not only their own emotions but also their relationship with algorithms. At the same time, AI reshapes the collective psychology of markets, accelerating cycles of fear and greed while creating new layers of uncertainty.
In the future, the traders who succeed will not be those who fight against AI, but those who learn to integrate human intuition with machine intelligence, balancing emotional wisdom with computational power.

High probability 1:7 Gold buy scenario.Gold is developing nice scenario for upside move. Currently it is under consolidation. We are expecting manipulation toward FVG (1 and 15m overlapping) and then upward movement after liquidity sweep. Below is detail
1. Price has created Break of Structure.
2. Displacement happened, which created FVGs in 5 and 15m overlapping.
3. FVGs are formed in Discount and OTE zone.
4. FVGs are overlapping BB on 5m.
5. HTF bias is also upside.
All these combinations are signalling a high probability and high Risk and Reward (1:7) trade scenario.
Note – if you liked this analysis, please boost the idea so that other can also get benefit of it. Also follow me for notification for incoming ideas.
Also Feel free to comment if you have any input to share.
Disclaimer – This analysis is just for education purpose not any trading suggestion. Please take the trade at your own risk and with the discussion with your financial advisor.

All-Time High Achieved: Can Gold Hold Above 3500?Gold has successfully tested the 3500 level, printing a fresh all-time high, and momentum remains strong. However, looking at the H4 chart, price action appears slightly stretched, hinting at the possibility of a short-term pullback. A retest toward the previous month’s high / previous week’s high zone (around 3450–3460) cannot be ruled out, and that level will be key to watch for a bullish bounce. As long as gold manages to hold above the 3400 daily close support, any retracement can be seen as a healthy dip-buying opportunity within the broader bullish trend. For now, 3500 stands as immediate resistance, while 3450 is short-term support, and 3400 remains a major level to defend. A sustained daily close above 3500 will open the door for further upside continuation and fresh breakout territory.

XAU/USD Bullish Setup – Buy from POI Zone Towards 3545 TargetXAU/USD (15M Chart) Analysis
Trend Analysis:
Price is in a clear uptrend, supported by higher highs and higher lows above the EMA 70 & EMA 200. Both EMAs are pointing upward, confirming bullish momentum.
POI & FVG Zone:
A POI/FVG buying zone (highlighted in pink) is marked between 3481 – 3491, acting as a strong demand area for re-entry if price retraces.
Chart Pattern:
Price has broken out of a rising wedge formation and is retesting the breakout zone, showing potential continuation to the upside.
Support & Resistance:
Support: 3481 – 3491 zone (FVG & EMA confluence).
Resistance/Target: 3545.608 (major target point).
Entry & Risk Management:
Entry: Buy near 3491 or 3481 (within POI/FVG zone).
Stop Loss: Below 3480 (to protect against false break).
Target: 3545 (approx. +55 points).
Strategy Confirmation:
Trend-following: Bullish continuation above EMAs.
FVG/POI: Perfect re-entry buying zone.
Breakout strategy: Price broke wedge → retest → continuation expected.
Risk-Reward Ratio: Around 1:4, favorable trade setup.
✅ Summary:
XAU/USD remains bullish above EMAs. Ideal trade is to buy the dip at 3481–3491 zone with a target at 3545 and stop loss below 3480. Multiple strategies align for upside continuation.

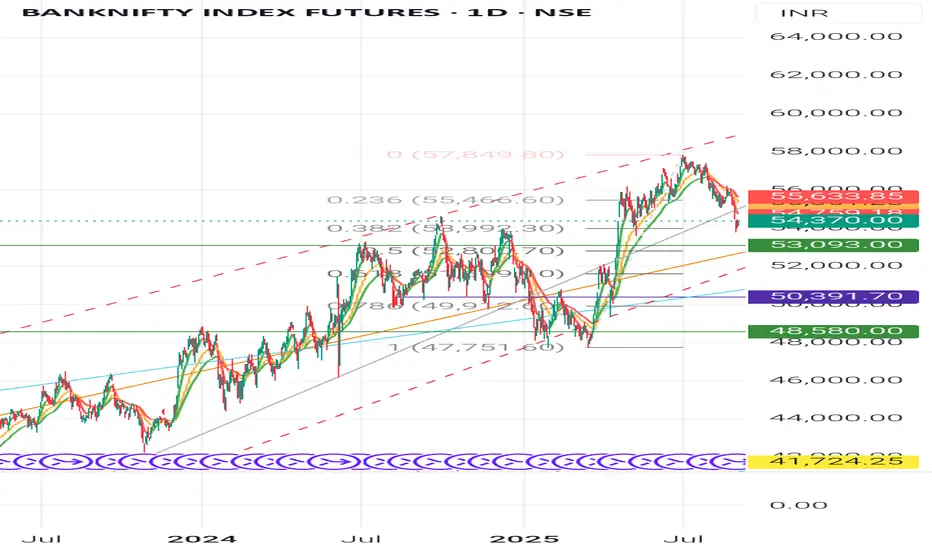
Bank nifty Futures- Consolidation ankNifty Futures (Index) daily
Technical analysis + sector (banking industry) fundamental overview + a learning summary for students.
Technical Analysis (Daily Chart) Candlestick & Chart Pattern👉
Recent candles show selling pressure after the peak near 57,800 (upper trendline rejection).
Current candles look like lower highs + lower lows = possible descending channel formation.
The long wicks at support zones indicate buyers are defending near 52,800- 53,000.
Swing Analysis
Major swing high: 57,850
Swing low: 47,750
Retracement happening between 0.382 (53,992) and 0.236 (55,466) Fibonacci levels.
Pattern in Progress
Falling Wedge / Descending Channel forming- often bullish if breakout happens above resistance trendline.
👉If price breaks below 52,800, then deeper correction possible.
Key Levels
-Support
52,800 - 53,000 (critical Fib support)
50,400 - 50,500 (strong demand zone)
48,500 (swing support)
-Resistance
55,000 - 55,500 (Fib cluster + recent rejection)
57,800 (swing high, big breakout point)
60,000 psychological level
Entry Points-
For Long (Investors/Positional)
-Enter near 52,800- 53,000 with SL below 52,500.
Add more if it breaks and sustains above 55,500.
-For Short (Traders):
Below 52,800, short with target 50,400 - 48,500.
Keep SL near 53,600.
Industry Analysis (Banking Sector)
Indian banks are in a strong credit growth cycle (loan demand high, NPA ratios declining).
-RBI’s monetary policy easing in future may improve margins further.
-PSU Banks are gaining strength, but private banks (HDFC, ICICI, Kotak) still dominate.
-Key Fundamental Ratios (Peer Banks)
-ICICI Bank: RoE - 16%, NIM - 4.5%, GNPA <2%
-HDFC Bank: RoE - 15%, NIM - 4.1%, GNPA - 1.5%
-SBI: RoE - 14%, NIM - 3.6%, GNPA - 2.5%
👉 Overall, sector health is positive, but valuation of large banks is already at premium.
-Student Learnings
1. Chart Patterns:
Descending channel/falling wedge = watch for breakouts.
2. Candlestick Wicks:
Long lower shadows = hidden buying.
3. Swing + Fibonacci:
Key tool to identify retracement zones.
4. Support & Resistance:
Always mark levels - entry becomes safer.
5. Fundamentals in Sector Indices:
Index = basket - study sector & top-weight banks, not single balance sheet.
⚠️ Disclaimer
This analysis is for educational purposes only. It is not financial advice. Trading in derivatives (like BankNifty Futures) is highly risky and may lead to capital loss. Please consult your financial advisor before investing.
Follow👣 for more🚩
#BankNifty #StockMarketIndia #TechnicalAnalysis #CandlestickPatterns #SwingTrading #SupportAndResistance #InvestingBasics #BankingSector #StockMarketEducation #FinanceStudents #MarketAnalysis
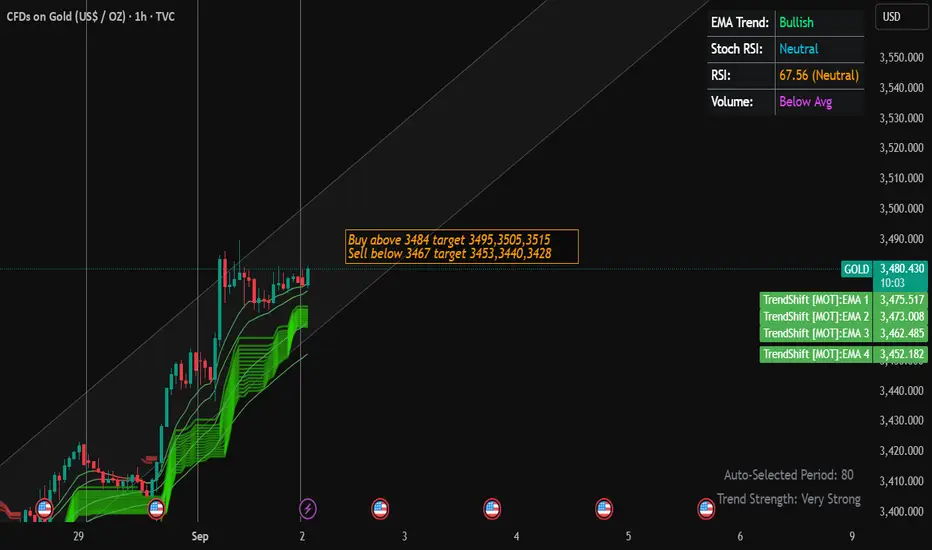
Gold Trading Strategy for 02nd September 2025📊 Gold Intraday Trading Plan
🔼 Buy Setup
Entry: Buy above the high of a 15-min candle that closes above $3484
Targets:
1st Target: $3495
2nd Target: $3505
3rd Target: $3515
🔽 Sell Setup
Entry: Sell below the low of a 1-hour candle that closes below $3467
Targets:
1st Target: $3453
2nd Target: $3440
3rd Target: $3428
⚠️ Disclaimer:
This analysis is shared for educational purposes only and should not be considered as financial advice. Trading in commodities, forex, or stocks involves substantial risk, including the possible loss of your invested capital. Always do your own research, use proper risk management, and consult with your financial advisor before taking any trades.
XAU USD 1 HRS BULLISH CHART Xau USD given a very decent move in last some days from 3383 to 3480 , There is Round number Resistance near 3500 if crossed 3500 with volume or Bullish Candle then Rally can continue. Otherwise there may be some retracement up to 3350-55. Be Cautious & careful. But Still it's bullish . Any Retracement will be Good opportunity.
