August 28 Gold AnalysisAugust 28 Gold Analysis
> Market expectations of rate cuts and political risks intertwined, sending gold prices volatile and rising, breaking through the $3,400 mark.
Fundamental Analysis
1. Fed policy expectations dominate market sentiment
Federal Reserve Chairman Powell's dovish stance at the Jackson Hole symposium continues to influence the market. He stated that "downside risks to employment are increasing" and that "a shift in the balance of risks may require adjustments to our policy stance," which the market interpreted as a strong signal that the Fed could cut interest rates as early as September.
The market is pricing in over an 87% probability of a 25 basis point rate cut at the Fed's September meeting. This expectation of a rate cut provides short-term support for gold prices. However, New York Fed President Williams emphasized that "rate cuts are data-dependent," suggesting that the Fed may remain cautious if economic data does not support this.
2. Political risks exacerbate market uncertainty
US President Trump's intervention in the Federal Reserve has reached historic levels. On August 25, Trump fired Federal Reserve Governor Lisa Cook, citing allegations of mortgage fraud. This marks the first time in the Federal Reserve's 111-year history that a president has removed a board member, raising serious concerns about its independence.
Cook, through his lawyer, responded that Trump "has neither the legal basis nor the authority" to remove him from office and stated that he "will continue to fulfill his responsibilities to stabilize the U.S. economy." This incident not only reinforced market expectations for a rate cut but also attracted safe-haven buying, supporting gold prices.
3. Economic Data and US Dollar Trends
The US dollar index is currently under pressure, retreating to a one-week low near 98.19. A weaker dollar makes dollar-denominated gold cheaper for holders of other currencies, indirectly supporting gold prices.
III. Technical Analysis
From a daily perspective, gold's rebound continues to rise, with strong short-term fluctuations. The moving average system shows a bullish alignment, and the overall trend remains volatile and strong. Gold prices remain at the upper limit of the recent oscillating triangle pattern. Whether it can effectively break through the downward trend line of 3414-3425 will be crucial.
Gold's downward support could be at the 5-day moving average at $3385, marking the current intraday low and the recent breakout point for gold's rebound. Furthermore, focus on the middle Bollinger Band at $3362 and the 3360-3362 area, where the 10-day and 20-day moving averages converge.
Upward resistance could be at $3410. Further gains could target the July high of $3440.
Technical indicators show a golden cross between the 5-day moving average and the MACD, and between the KDJ and RSI. Short-term technical indicators suggest continued bullishness.
IV. Trading Strategy Recommendations
Based on the current market environment, we recommend a volatile trading strategy. Downward support could be at $3385 and $3362, while upward resistance could be at $3400.
If gold prices stabilize in the 3380-3385 area, consider a long position with a stop-loss below 3370 and a target of 3400-3405. If it breaks through, you can partially reduce your position, and focus your remaining positions on the 3414-3425 area.
If gold prices break through 3414 and hold, consider buying with the trend, targeting 3425 or even higher. If gold prices unexpectedly break below the 3373 support level, it would signal a weakening of short-term bullish momentum and the market could enter a period of correction.
For cautious investors, we recommend waiting and waiting for gold prices to effectively break through key resistance (3414-3425) or support (3360-3362) and then enter the market when the direction is clear. You can also monitor the market reaction to the release of US economic data tonight before making any decisions.
Trade with caution and manage risk! Wish you good luck!
Futures market

Gold Hits $3408, Bulls Targeting $3450Gold Reclaims $3400 psychological mark.
Dollar Index drops to 98.10
Markets cautious ahead of Initial Jobless Claims data release.
Immediate hurdle is $3415 followed by $3420-$3450
Immediate support $3392-$3386 crucial for Bullish momentum.
Fundamental drivers
Gold bullish momentum is getting strong boost by Fed rate cut expectations in September meeting and PCE data ahead which works as important inflation gauge. Also, upcoming Initial Jobless Claims release is awaited which may significantly influence Dollar and Gold prices.
Rising political tensions from concerns on Fed's autonomy and independence threatened by Trump's strong actions and face off keeps Dollar under pressure and boosting Gold demand for safe haven.
Technical drivers
Gold remains undisputed favourite bet for buying the dips and retracement towards $3384 attracted buyers again, reclaiming the psychological mark of $3400.
Bulls need to clear through immediate hurdle $3415 to extend advance towards $3420-$3430 above which next upside targets are positioned at $3438 followed by $3450-$3465.
Major upmove will target a new All Time High around $3545-$3568.
On the flip side, a strong break below $3350 will invalidate the immediate bullish momentum calling for drop to ascending trendline support $3330 before any new attempt to rise.

Trading Master Class With ExpertsReal-Life Applications of Options
Options are not just trading tools; they have practical uses:
Insurance companies use options to hedge portfolios.
Exporters/Importers hedge currency risks using options.
Banks use interest rate options to manage risk.
Investors use protective puts to safeguard their stock portfolios.
Psychology of Options Trading
Trading options requires discipline. Many beginners blow up accounts because:
They buy cheap OTM options hoping for jackpots.
They ignore time decay.
They overtrade due to low cost of entry.
A successful option trader thinks like a risk manager first, profit seeker second.

Part 6 Institutional Trading The Greeks: The Math Behind Options
Advanced traders use Greeks to understand risks.
Delta → Sensitivity of option price to stock price movement.
Gamma → Rate of change of Delta.
Theta → Time decay (how much option loses daily).
Vega → Sensitivity to volatility.
Rho → Sensitivity to interest rates.
Example:
A Call with Delta = 0.6 → If stock rises ₹10, option rises ₹6.
Theta = –5 → Option loses ₹5 daily as time passes.
Options vs Futures
Both are derivatives, but with a key difference:
Futures → Obligation to buy/sell at a price.
Options → Right, not obligation.
Example:
Futures are like booking a hotel room—you must pay whether you stay or not.
Options are like paying for a movie ticket—if you don’t watch, you lose only ticket price.

Silver Reversal In PlayLast trade delivered 12R.
Now positioned again in MCX:SILVERMIC1! .
Reversal signs clear, momentum building.
Risk defined, rules followed, no guessing.
Stops trail, trend decides.
Let’s see where this one runs.

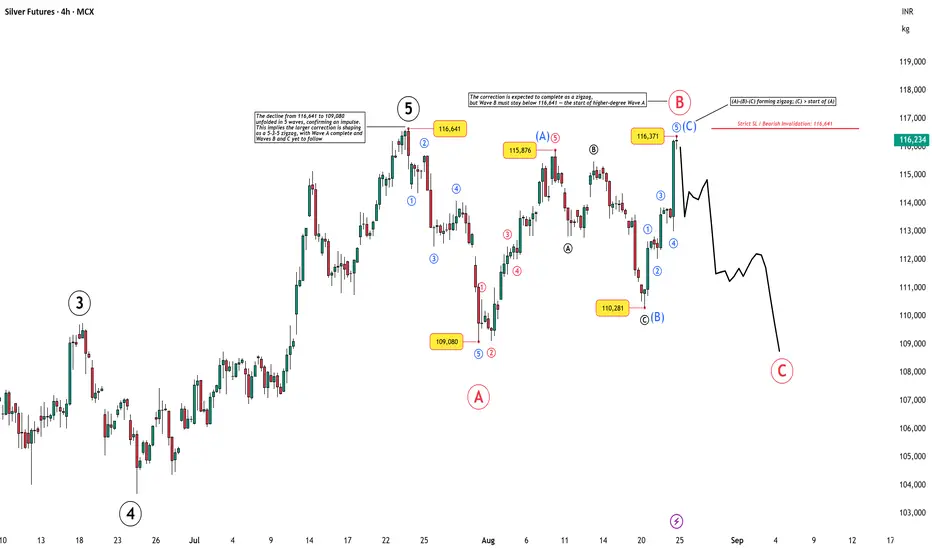
Silver Futures (4H) – Zigzag Correction in ProgressThe decline from 116,641 → 109,080 unfolded in 5 waves, confirming an impulse. This sets the stage for a 5-3-5 zigzag correction . With Wave A complete, the market is now advancing in Wave B, expected to resolve as a zigzag.
A strict bearish invalidation level is marked at 116,641 . As long as prices remain below this level, the expectation is for Wave C down to follow and complete the zigzag sequence.
📌 Key Levels:
Invalidation (SL): 116,641
Wave B unfolding as zigzag
Wave C down expected next
Disclaimer: This analysis is for educational purposes only and does not constitute investment advice. Please do your own research (DYOR) before making any trading decisions.
Gold Plan (28/08) – Ahead of 3,400: Breakout or Correction to ??XAU/USD – Gold hits Storm Breaker 3400: Accumulation before breaking ATH?
1. Market Wave 🌍
Throughout last week, Gold continuously formed BOS (Break of Structure) , confirming that buyers remain in control.
Currently, price is consolidating around 3,394 – 3,400, right at the Storm Breaker 🌊 , the crucial barrier before heading towards the old ATH at 3,424.
The key question: Will Gold accumulate here and smash through ATH, or will it need a pullback to safe harbors before a strong rally in September?
2. Technical Analysis ⚙️
Storm Breaker 🌊 (Strong Resistance): 3400 – 3424 (old ATH). The gateway Gold must conquer to open a new bullish leg.
Golden Harbor 🏝️ (Key Support): 3375 – 3355 – 3330. Confluence with FVG + Fibonacci 0.5/0.618 , likely to attract liquidity if price corrects.
Short-term scenario: Price may pull back to Golden Harbor before breaking higher.
3. Captain Vincent’s Map – Trade Scenarios 🪙
🔺 Quick Boarding 🚤 (BUY Scalp – Rebound Priority)
Entry: 3353 – 3355
SL: 3349
TP: 3356 → 3359 → 3361 → 33xx
🔻 Storm Breaker 🌊 (SELL Reaction – Old ATH)
Entry: 3422 – 3424 (if tested)
SL: 3430
TP: 3419 → 3415 → 3410 → 3405 → 33xx
4. Captain’s Note ⚓
"The Gold ship is now pressing against Storm Breaker 🌊 3400 – 3424 . If it breaks through, the vast ocean opens a new trend. But if the waves push back, patiently wait at Golden Harbor 🏝️ to anchor and catch the September tide."

Gold Analysis and Trading Strategy | August 28✅ Fundamental Analysis
🔹 Political Risk: Trump’s attempt to dismiss Federal Reserve Governor Cook has raised concerns about the Fed’s independence.
🔹 U.S. Dollar Performance: The U.S. Dollar Index closed slightly lower on Wednesday, now trading around 98.19. The relative weakness of the dollar is providing some support for gold prices.
🔹 Economic Data: Multiple U.S. economic data releases are scheduled for today, which may bring volatility to the market.
🔹 Trade Relations: The EU plans to propose a tariff reduction on U.S. goods to ease trade tensions. The easing of geopolitical risks may slightly weaken gold’s safe-haven demand.
✅ Technical Analysis
🔸 On the daily chart, gold has rebounded from recent lows with consecutive bullish candles. It is currently trading between the middle and upper Bollinger Bands, near the 3395–3400 zone.
🔸 On the 4-hour chart, gold has repeatedly tested the 3395–3400 resistance area but remains in high-level consolidation. Prices are trading above the MA20 and MA60, with a bullish crossover providing support. Gold is consolidating above the Bollinger mid-band, with the upper band capping gains near 3405. The trend remains biased to the upside, but the 3400–3405 zone is a critical resistance that needs confirmation.
🔸 On the 1-hour chart, gold found support around 3375 and rebounded, reaching as high as 3399 before pulling back. This shows short-term bullish momentum is weakening, with signs of pressure at higher levels. Key focus is on the 3380–3375 support zone — a break below this level could trigger a further drop toward 3360.
🔴 Resistance Levels: 3400–3405 / 3409–3415 / 3425
🟢 Support Levels: 3383–3380 / 3373–3370 / 3360
✅ Trading Strategy Reference:
🔻 Short Position Strategy:
🔰Consider entering short positions in batches if gold rebounds to the 3395-3399 area. Target: 3375-3365;If support breaks, the move may extend to 3355.
🔺 Long Position Strategy:
🔰Consider entering long positions in batches if gold pulls back to the 3355-3360 area. Target: 3370-3380;If resistance breaks, the move may extend to 3390.
🔥Trading Reminder: Trading strategies are time-sensitive, and market conditions can change rapidly. Please adjust your trading plan based on real-time market conditions. If you have any questions or need one-on-one guidance, feel free to contact me🤝
XAUUSD: Maintaining Support, Gold Aims for New Highs!Based on the latest data and chart for XAUUSD, it can be seen that gold is in an uptrend after holding strong above the key support level at 3,373.70. The chart indicates that if gold maintains above this support zone, the next target will be 3,413.00, with the potential to continue rising higher if the current support area is not broken.
Technical Analysis: XAUUSD is currently trading near the support zone at 3,373.70 and resistance at 3,413.00. If the price remains above 3,373.70, the uptrend will continue with the target at 3,413.00. The nearest support levels are 3,373.70 and 3,362.00.
Fundamental Signals: Weaker economic data from the U.S., especially the higher-than-expected PCE index and lower-than-expected jobless claims, have increased expectations that the Fed will cut interest rates. This has put pressure on the USD and supported gold’s recovery.

XAU/USD – Big Move Loading? Liquidity Grab Before the Next RallyGold has been holding strong at higher levels, consolidating near resistance without showing a real liquidity sweep yet. With key US data coming in (Prelim GDP q/q & Unemployment Claims), the market could be setting up for a sharp correction first – before the next bullish leg in September, especially as USD weakens and Fed rate cuts get closer.
🔑 Key Levels to Watch
Resistance: 3400 → A breakout can quickly push Gold to 342x – 343x, retesting old ATH.
Support: 3370 → A breakdown can send price into the 335x BUY Zone for a clean long setup.
📌 MMFLOW Trading Plan
✅ BUY ZONE
3356 – 3354
SL: 3349
TP: 3360 → 3365 → 3370 → 3375 → 3380 → 3390 → 3400+
❌ SELL ZONE
3424 – 3426
SL: 3430
TP: 3420 → 3395 → 3390 → 3385 → 3380 → 3370
🎯 MMFLOW View
End of month often comes with liquidity flushes before the market decides its next big move. Watch for a potential drop into 335x as a golden buying opportunity before Gold makes a run at new highs.
👉 Trade with discipline. Stick to Key Levels. No FOMO.
🔥 What do you think traders?
Will Gold break 3400 first or flush to 335x for the perfect buy?
👇 Drop your views in the comments – let’s analyze together!

Gold (XAU/USD) Targets $3,397 – $3,406 Amid Bullish MomentumAnalysis:
The 4H chart of Gold (XAU/USD) shows strong bullish momentum after a corrective phase. Price has broken above consolidation and is currently trading around $3,382, with upside targets at $3,397 and $3,406 (highlighted resistance zone).
The supply zone on the higher timeframe remains intact below $3,280, acting as a long-term support.
Immediate support levels lie at $3,371, $3,356, and $3,348. A break below these could shift momentum bearish.
Current bullish structure suggests that as long as price holds above $3,371, buyers may drive the price higher toward the resistance levels.
A rejection from $3,406 may lead to a pullback toward the mid-support zone before another attempt higher.

GOLD 15 Chart Buy Stop🛎 Trade Suggestion
✅ XAUUSD 15M Chart BUY STOP
(watch for bullish engulfing or rejection wick on 5M/15M.)
Entry: 3396.50
Targets: 3399 / 3402 / 3405
Stop: 3389.50 (Risk 1-2%)
Reasoning: Break above premium PD array + bullish MSS + upside liquidity above 3400
⚠️ Risk Disclosure applies

Gold 27/08: Smart Money Targets 3405 or Sweeps 3355?Gold SMC Daily Plan – 27/08
Market Context (SMC View):
Price is consolidating around 3378, holding the liquidity trendline with multiple BOS and ChoCH, indicating strong smart money activity.
Key resistance: 3393–3406 (supply & liquidity pool).
Key support: 3352–3358 (demand zone) with an Order Block (OB) near 3325.
A possible liquidity sweep could happen above 3405 or below 3355 before confirming the next trend move.
📊 Key Liquidity Zones & Entries
✅ Sell Zone: 3402–3406
SL: 3410
TP: 3390 → 3380 → 3360
✅ Buy Zone 1: 3352–3358
SL: 3345
TP: 3360 → 3375 → 3385 → 3395
✅ Buy Zone 2 (intraday pullback): 3376–3380
SL: 3370
TP: 3385 → 3395 → 3405
SMC Scenarios for 27/08
Scenario 1 – Liquidity Grab at Resistance:
If price sweeps 3402–3406, look for fake breakout signals.
Short from this zone with the TP levels mentioned above.
Scenario 2 – Buy on Dip (Demand Zone):
If price retraces deeper to 3352–3358, wait for bullish confirmation to go long.
If price respects the trend and holds 3376–3380, consider intraday buy opportunities.
SMC Notes:
Focus on buying dips unless a liquidity grab occurs first at 3402–3406.
Keep an eye on price action near the trendline & OB at 3325 for potential high-probability reversal setups.

Elliott Wave Analysis XAUUSD – August 28, 2025
Momentum
• D1 timeframe: Momentum is still in a bearish reversal zone (overbought). Price is stalling but has not yet given a clear reversal confirmation → showing that bullish strength is weakening.
• H4 timeframe: Momentum is also turning bearish → from now until the US session, price is likely to continue sideways or decline further.
• H1 timeframe: Momentum is turning bullish → suggesting a short-term corrective rally or sideways movement.
Wave Structure
• D1 timeframe: At the moment, there are two possible wave counts (as mentioned in yesterday’s plan). Both scenarios point to the same outcome: after completing the correction, price will move higher.
o Key note: The final corrective structure is a triangle. Once this triangle completes, it typically signals a strong upward breakout, confirming the end of the corrective phase.
• H4 timeframe: Price is consolidating within a contracting triangle, leaving two possibilities:
1. Leading diagonal for wave 4 (abcde) → once completed, price could drop sharply towards the 0.618 Fibonacci retracement.
2. Ending triangle for wave d → a strong wave e decline is expected before the next rally begins. In this case, the signal to watch is price testing the lower boundary of the triangle.
• H1 timeframe: A leading diagonal is forming, while RSI shows bearish divergence at the top. This supports the sell scenario. However, since H1 momentum is currently bullish, we expect one more push higher into resistance at 3403, which will provide a potential short opportunity.
o Note: Today’s US Jobless Claims data could trigger a stop-hunt move upward before a strong sell-off. Ahead of the news, price may continue ranging between 3385 – 3387.
Trading Plan
• Since price has not dropped significantly yet, it is likely still within wave 5 of the triangle. The upper resistance at 3403 is an ideal sell zone.
• A safer option: wait for price to break below the triangle’s lower boundary and close beneath it → then look for a breakout sell setup.
• Target: 0.618 Fibonacci retracement at 3345.
Trade Setup
• Sell Zone: 3403 – 3405
• Stop Loss: 3413
• Take Profits:
o TP1: 3374

Buy Opportunity in USOILAn upside opportunity is being developed. Scenario.
1. Choch has happened and price retracing towards FVG.
2. it is also taking support from trendlines.
3. If price rejects with volume in FVG zone, it may lead to good upside trade.
P.s. - It is just analysis not trading recommendation.

12R locked in on $MCX:SILVERMIC1!12R locked in on MCX:SILVERMIC1!
I entered with conviction, managed with discipline.
Risk was tight, exits were clear, emotions silent.
Price moved, I trailed. Trend built, I rose with it.
No rush, no greed — just system and patience.
This is sigma trading: controlled risk, amplified reward.
Gold Holds Trendline All Eyes on 3400 & GDP DataGold continues to move higher , on H4 we can see that price respecting the rising trendline support that has been guiding the move since last week’s breakout. Yesterday, bulls made an attempt to push through the 3400 level, but failed to sustain above it, confirming this zone as the immediate resistance for now. On the downside, supports remain unchanged first at the previous week high (3378), followed by the weekly pivot (3353).
For today, the key focus will be on the GDP data release, which could trigger volatility and provide the needed catalyst for gold to either break above 3400–3410 resistance or slide back towards its support zones. Until then, price action suggests a slow but steady bullish bias, with sellers only likely to gain momentum if the trendline breaks decisively.

Gold expected reaction from 1 H fvggold expected to react from 1 H fvg and then aim for liquidity created previous days
XAU/USDThis XAU/USD setup is a buy trade, showing a bullish short-term outlook for gold. The entry price is 3388, the stop-loss is 3384, and the exit price is 3396. The trade looks to capture an 8-point gain while risking only 4 points, offering a solid 1:2 risk-to-reward ratio.
Buying at 3388 indicates the trader anticipates upward momentum, possibly supported by dollar weakness, declining bond yields, or increased demand for gold as a safe-haven asset. The entry zone may also represent a minor support level where buyers are expected to step in, pushing prices higher.
The exit price at 3396 is positioned just below a potential resistance area, allowing profits to be booked before any selling pressure develops. Meanwhile, the tight stop-loss at 3384 ensures losses are limited if the market turns against the trade.
This setup is well-suited for intraday strategies, emphasizing disciplined execution and risk management while targeting consistent, short-term gains.

XAU/USD – Bulls Eye $3,400 as Technicals and Ichimoku Support HoHello friends, on the H1 chart, gold has rebounded sharply from the $3,360 support and is now testing the $3,380–$3,385 resistance zone. The FVG areas at $3,375 and $3,380 are creating short-term barriers, but a clean break above them could reinforce the uptrend.
The Ichimoku cloud remains supportive, with Senkou Span A staying above Span B, confirming that buyers still hold control. Trading volumes also remain healthy, indicating strong buying interest. As long as the price stays above $3,360–$3,375, this zone should act as a solid base for further gains.
From the news side, traders await the US PCE index, a key inflation gauge. A stronger-than-expected reading could weigh on the dollar and boost gold further. Meanwhile, ongoing geopolitical tensions continue to fuel safe-haven demand.
If gold breaks $3,385, the next target is $3,400, and possibly higher levels. On the flip side, any pullbacks to $3,375–$3,360 would likely be healthy corrections to strengthen the bullish structure.
Do you believe gold is ready to break $3,385 and head toward $3,400?

XAUUSD Price Action Analysis Current Market Overview
Price is trading at 3,371.67 🟢, showing bullish momentum after bouncing from the highlighted support zone (purple box).
The support zone (3,358 – 3,348) is currently holding strongly, converting old resistance into support 🔄.
🔑 Key Levels to Watch
Support Zone (3,358 – 3,348) 🛡️ → Price respected this area, confirming it as a demand zone.
Immediate Support: 3,358.65 🟪
Secondary Supports: 3,348.60 📉 | 3,325.99 📉 | 3,311.63 📉
📈 Bullish Scenario
If buyers maintain momentum above 3,358, price may attempt a move toward 3,380+ 🚀.
Break above 3,380 could signal continuation to new highs 📊✨.
📉 Bearish Scenario
A strong break back below 3,358 could re-test 3,348 → 3,325 → 3,311 ⬇️.
Failure to hold support may trigger deeper correction.
✅ Professional Takeaway
Market sentiment is bullish as long as price stays above 3,358 support zone 🟩.
Traders may look for buy opportunities on dips near support with targets toward 3,380 – 3,390 🎯.
Watch price reaction closely at the purple zone for confirmation before entering.

nifty index future analysis with and with out b adjnifty index future analysis with and with out b adj

NG : A FALLING WEDGE BREAKOUT WITH 1:7.5 RR• NG was in downtrend and in a falling wedge for last 2 months
• Today It successfully retest the upper trend line of the wedge and confirming the BO
• A trade with 1:7.5 RR
• SL and the T1 and T2 mentioned in chart.
• Educational purpose only. Happy trading.
