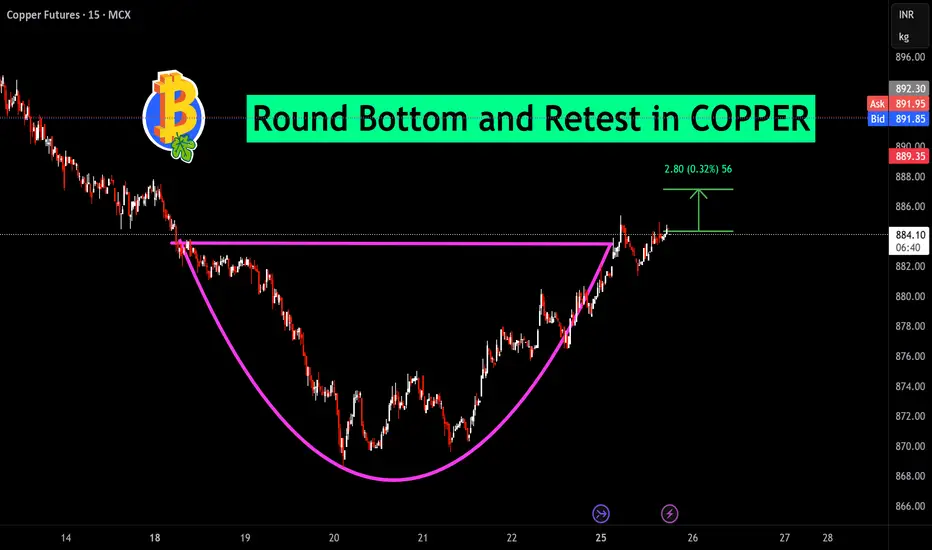
Round Bottom and Retest in COPPERA well-defined Round Bottom formation and subsequent retest is observed in Copper Futures (MCX) on the 15-minute chart. After a prolonged downtrend, price has rounded out a base and reclaimed the neckline resistance near ₹884. This breakout was confirmed by a successful retest, with bulls defending the level and initiating upward momentum. The measured move projects a target of roughly ₹2.80 higher (0.32%) from the neckline, reinforcing the bullish bias for short-term trading.
Trade Context for Posting
Pattern: Round Bottom breakout and retest.
Instrument: Copper Futures (MCX), 15-minute timeframe.
Breakout Level: ₹884.
Target Move: ₹2.80 upside (0.32%), based on breakout projection.
Validation: Multiple tests of the neckline, clear support confirmation, and price expansion following retest.
Trade Plan: Enter long positions above ₹884, place stop-loss below the retest low, and aim for the projected target. Monitor for volume and price action confirmation for sustained gains.
This setup demonstrates classical technical structure, where bottoming and retest provide conviction for the move and risk management.
image.jpg
345.1 KB
Futures market
XAUUSD Gold Trading Strategy August 26, 2025XAUUSD Gold Trading Strategy August 26, 2025:
Gold surged after Trump's move, initial short-term bullish technical conditions in the trend of accumulation status.
Basic news: Gold surged after Trump's move, US President Donald Trump decided to remove Federal Reserve Governor Lisa Cook due to allegations that she falsified mortgage documents. This news affected the US Dollar index to fall sharply at the beginning of today's Asian trading session, while spot gold prices increased by nearly 35 USD.
Technical analysis: Gold prices returned to the support area of 3345 - 3350 after increasing sharply as previously predicted. The rising price channel on the H1 frame has been formed, currently the MA lines and liquidity zones are still supporting the increase in gold prices. In addition, the Fib frames are still effective trading areas. Gold prices may approach the area of 3410 - 3420 this week.
Important price zones today: 3353 - 3358 and 3340 - 3345.
Today's trading trend: BUY.
Recommended orders:
Plan 1: BUY XAUUSD zone 3353 - 3355
SL 3350
TP 3358 - 3368 - 3388 - 3410.
Plan 2: BUY XAUUSD zone 3340 - 3342
SL 3338
TP 3345 - 3355 - 3375 - 3400.
Plan 3: SELL XAUUSD zone 3420 - 3422
SL 3425
TP 3417 - 3410 - 3400 - 3390 (small volume).
Wish you a safe, successful and profitable trading day.🥰🥰🥰🥰🥰

Gold (XAUUSD) – Strength Weakening & Repeat of Structure
🔎 Market Context
Price made a sharp bullish rally, but momentum slowed down quickly.
After the rally, we see sideways consolidations (boxed zones), showing lack of follow-through from buyers.
This is a repeat structure – first big box (distribution) → breakdown → second smaller box (again distribution).
📌 Strength Weakening Signs
Impulsive move up but no higher continuation.
Sideways zones repeating → indicates repeated failure of bulls.
Volume fading → buyers not aggressive, sellers absorbing.
📊 Repeat of Structure
First consolidation broke to the downside → shift of control to sellers.
Current consolidation is a mirror repeat of the previous structure.
If breakdown repeats again, it confirms weak bullish strength and further downside is likely.
✅ Trading View
Bias: Bearish – Expectation of repeated structure breakdown.
Confirmation: Support break with volume push.
Invalidation: Breakout above resistance with strong momentum.
🔑 Key Levels
Resistance: 3386 – 3391
Support: 3365 – 3357
Breakdown target: Towards 3340 & below if repeat structure plays out.

Gold Faces Resistance at 3.380–3.385, Correction LikelyLooking at the H2 XAU/USD chart, gold is struggling around 3.380–3.385 USD, where the supply FVG aligns with the upper Kumo edge. Recent candles indicate sellers are dominating: short bodies, long wicks, and lack of volume suggest buyers lack momentum. With a series of lower highs and a flat Ichimoku cloud ahead, a pullback appears likely. Immediate support is near 3.355 USD, with a further decline possible toward 3.345 USD.

GOLD (XAU/USD) BUY SETUPGold is bullis On 4HR Time frame and Also Bullish on 1 min Timeframe , Liquidity Swept 1HR And 15 Min , All conditions slines for day trade bullsih , SL 3368 , Best sentup for Bullish Trade

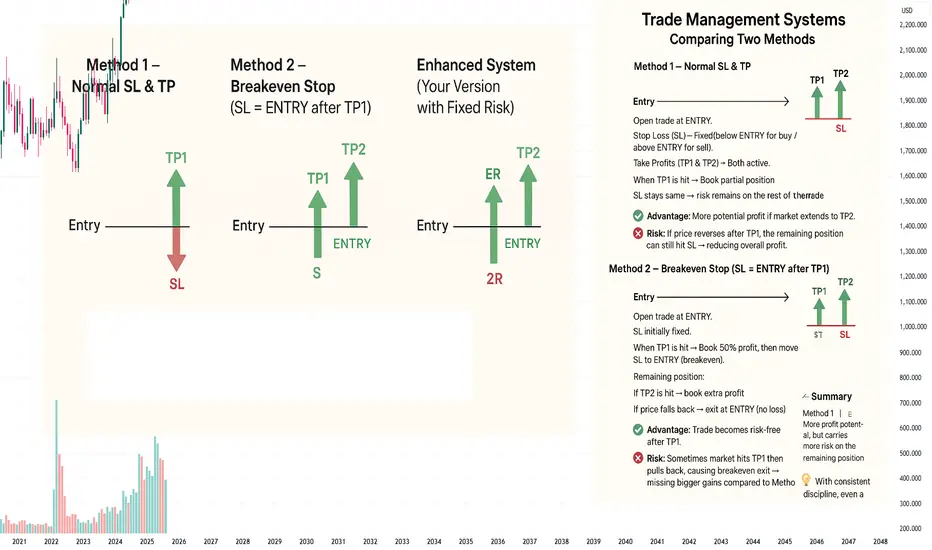
Trade Management Systems: Comparing Two Methods
📌 Method 1 – Normal SL & TP
Entry → Open trade at ENTRY.
Stop Loss (SL) → Fixed (below ENTRY for buy / above ENTRY for sell).
Take Profits (TP1 & TP2) → Both active.
When TP1 is hit → Book partial position.
SL stays the same → risk remains on the rest of the trade.
✅ Advantage:
More potential profit if market extends to TP2.
❌ Risk:
If price reverses after TP1, the remaining position can still hit SL → reducing overall profit.
📌 Method 2 – Breakeven Stop (SL = ENTRY after TP1)
Entry → Open trade at ENTRY.
SL initially fixed.
When TP1 is hit → Book 50% profit, then move SL to ENTRY (breakeven).
Remaining position:
If TP2 is hit → book extra profit.
If price falls back → exit at ENTRY (no loss).
✅ Advantage:
Trade becomes risk-free after TP1.
❌ Risk:
Sometimes market hits TP1 then pulls back, causing breakeven exit → missing bigger gains compared to Method 1.
📌 Enhanced System (Your Version with Fixed Risk)
Initial SL → Always set at 2R.
TP1 → When reached, book 50% profit (+1R on half).
Then move SL to ENTRY (breakeven) for the remaining 50%.
📊 Possible Outcomes:
Scenario Result
Price hits SL (before TP1) –2R loss
Price hits TP1, then reverses to ENTRY +0.5R profit
Price hits TP1, then TP2 +2R total profit
⚖️ Summary
Method 1 (Normal SL & TP) → More profit potential, but carries more risk on the remaining position.
Method 2 (SL = ENTRY after TP1) → Safer, risk-free after TP1, but sometimes cuts off bigger gains.
Your Enhanced Version → A defensive system:
Losers are limited (–2R).
Small winners (+0.5R) happen often.
Big winners (+2R) balance out losses.
💡 With consistent discipline, even a 40–45% win rate can make this system profitable.
Gold Plan 26/08 – Captain VincentXAU/USD – Trump’s surprise move sparks a Gold rally. What’s the next scenario?
1. News Wave 🌍
Trump unexpectedly dismissed FED Governor L. Cook , citing “irresponsible recent financial decisions.”
👉 A political–monetary shock that pushed Gold up by more than 30 points from the 3,350 – 3,352 zone, as investors feared internal instability at the FED could weaken the USD.
Safe-haven demand has been activated, but Gold is unlikely to “fly in a straight line.” The market often requires a pullback to fill liquidity gaps before a clear trend develops.
2. Technical Outlook ⚙️
Price bounced sharply from Golden Harbor 🏝️ (Buy Zone 3350 – 3342) – a key support area.
Currently, Gold is testing Storm Breaker 🌊 (Resistance 3384 – 3400) , a liquidity cluster → potential for profit-taking sell orders.
On H1, multiple FVGs formed around 3363 and 3355 → price may retrace to “fill the gap” before continuing.
👉 Intraday bias: Prioritise Sell at resistance, but watch for short Buy Scalp setups at Quick Boarding 🚤 (3342 – 3340) .
3. Captain Vincent’s Map – Key Levels 🪙
Storm Breaker 🌊 (Main Resistance): 3384 – 3400
Quick Boarding 🚤 (Buy Scalp): 3342 – 3340 | SL 3333 | TP: 3345 → 3347 → 3350 → 33xx
Golden Harbor 🏝️ (Buy Zone): 3350 – 3342
FVG Zones: Around 3363 & 3355 (short-term price magnets)
4. Trade Scenarios 📌
🔻 SELL at Storm Breaker 🌊 (Priority)
Entry: 3400 – 3402
SL: 3408
TP: 3395 → 3390 → 33xx
🔺 BUY Scalp – Quick Boarding 🚤
Entry: 3342 – 3340
SL: 3333
TP: 3345 → 3347 → 3350 → 33xx
5. Captain’s Note ⚓
"Trump’s news wave pushed Gold like an unexpected headwind. But Storm Breaker 🌊 ahead may unleash rough seas. The wise will anchor at Golden Harbor 🏝️ , while the bold may ride Quick Boarding 🚤 for fast scalps. And remember: today’s golden sea depends on the sharks at the helm."

Xauusd trend line break sell , resistance line break buy Sell plan
. Fvg rejection
. Resistance level rejection
. trend line break out

My take on Gold Current PAGold (XAU/USD) – Daily View
Gold is bouncing between two important levels – the daily bullish FVG (support) and daily buyside liquidity (resistance). Since price is rejecting from both sides, the market is uncertain right now.
It’s better to wait for a clear close on the higher timeframe before taking any trades, otherwise there’s a high chance of getting stopped out in this choppy range.

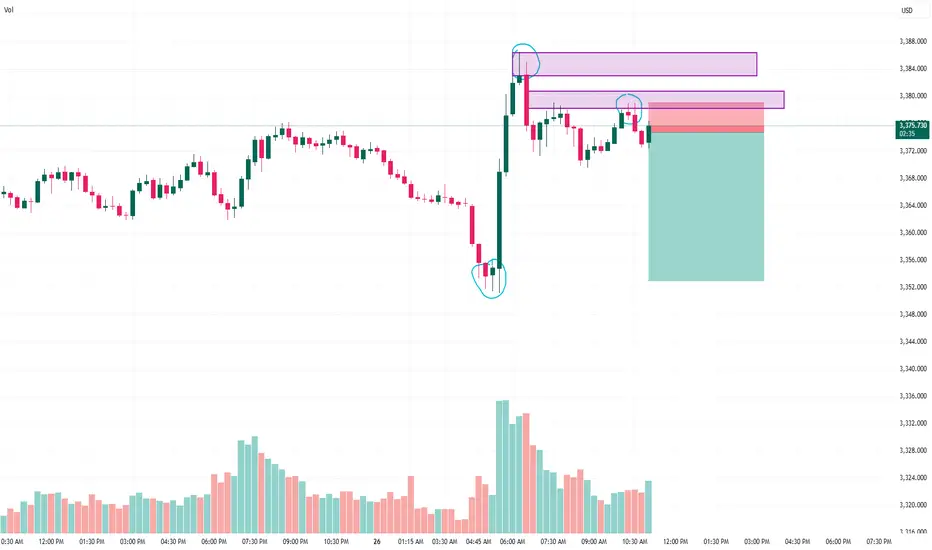
GOLD sell setup Gold (XAUUSD) – Short Trade Idea
🔑 Key Observations:
Strong Rejection Zone:
Price faced rejection at the previous high (highlighted in purple supply zone).
Multiple attempts to break above failed, confirming seller presence.
Volume Confirmation:
The sharp bullish push from the bottom was met with equally strong selling pressure at the top.
Volume spikes indicate distribution at higher levels.
Market Structure:
Clear lower high formation after rejection.
Entry aligns with a retracement into the supply zone.
📊 Trade Setup:
Entry: Short near supply zone (around 3374–3379).
Stop-Loss: Above recent swing high (3380 area).
Target: 3356 level (previous demand zone).
Risk/Reward Ratio: ~1:5 (high probability setup).
⚠️ Risk Management:
Always use a stop-loss to protect capital.
Consider trailing stop-loss once trade moves in favor, to lock in profits.
If price breaks and closes above supply, setup becomes invalid.
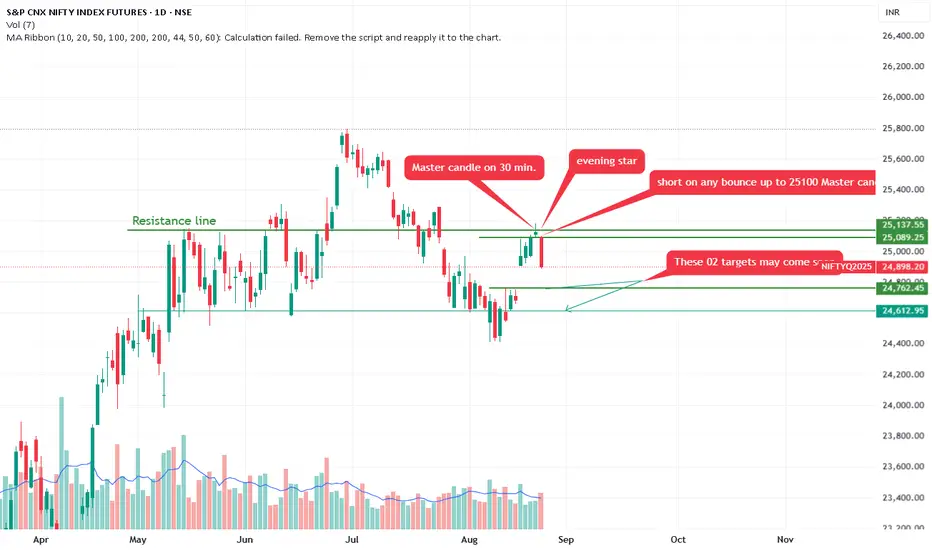
Nifty form Bearish Evening star. Correction expected.Annotations Patterns:
Master Candle on 30 min. Evening Star: Points to the recent high. A "master candle" refers to a large-range candle (here, likely on a 30-minute timeframe) that encompasses subsequent smaller candles, Combined with an "evening star" pattern—a three-candle bearish reversal (large green candle, small-bodied doji/star, followed by a large red candle closing below the first's midpoint)—this suggests a topping formation and potential for further downside.
Short on Any Bounce Up to 25,000-25,100 Master Candle Low.
Recommends selling (shorting) if price rebounds to 25,000-25,100 (labeled as the master candle's low, acting as resistance on pullback).
These 02 Targets May Come Soon: Arrows to lower levels (~24,793 and possibly 24,613), implying quick downside targets.
A downward-sloping green trendline projects further decline.
Overall Trend: The chart depicts a bull market correction or potential reversal. After months of gains, momentum has shifted bearish, with price breaking below key supports (e.g., the green line at 25,137). Higher volume on declines reinforces this.
The chart's creator appears to have a bearish bias, focusing on reversal patterns and downside projections.
Gold Scenario – Tracking the Medium-Term UptrendGold Scenario – Tracking the Medium-Term Uptrend
Hello traders,
Gold continues to follow the expected scenario. Price reacted at the Fibonacci 1.618 resistance, effectively completing the liquidity test. At present, the 3368 zone is a good area to look for buying opportunities.
The previous Elliott cycle has already completed its ABC waves, and gold now appears to be forming a new Elliott structure. Currently, price is likely in wave 3 of the uptrend, reacting at the H4 descending trendline with a mild pullback, before completing wave 5 with a breakout move from the channel and confirming the flag pattern on H4.
Strategy: Buy around 3368 with a strict stop-loss just below the previous swing low.
Target: 3410 is a reasonable profit level. After that, expect wave 4 to form and look for short opportunities from there.
The MACD remains supportive, trading above its average levels and confirming bullish momentum. At this stage, it’s all about timing entries correctly.
This is my personal outlook on gold in the short to medium term. Use it as reference and don’t forget to share your views in the comments so we can learn from each other.

Elliott Wave Analysis – XAUUSD 26/08/2025
1. Momentum
• D1 timeframe: Price is currently in the overbought zone. The ongoing bullish cycle has already produced 5 daily candles. Combined with the overbought condition, this suggests that upside momentum is weakening. If no strong breakout occurs within the next 1–2 days, it is likely that the market is still in a larger corrective phase on the daily chart.
• H4 timeframe: Momentum has turned bearish, with strong selling pressure emerging right after wave 2 was considered complete. This is an unusual sign and raises caution for the bullish scenario.
• H1 timeframe: Momentum is also about to turn bearish, which implies an incoming corrective pullback. This is not an encouraging signal at a stage where wave 3 is expected to develop.
2. Wave Structure
• D1: The main scenario still follows the larger corrective triangle. Price is unfolding waves 1–2 (green), and the current bullish leg is expected to be wave 3 (green). However, the strength so far has not been convincing. Having already completed 5 D1 candles without a decisive breakout suggests weakness in the rally.
• H4: The Asian session opened with a strong rally, but this momentum quickly faded and was followed by aggressive selling. Momentum reversed sharply, highlighting abnormal behavior for the expected uptrend.
• H1: At the 3387 level, strong selling pressure appeared, whereas this should have been the breakout zone for wave 3 (black) after surpassing wave 1 (black). Ideally, price should have pushed straight toward 3403 to confirm the impulsive strength of wave 3. This unusual behavior suggests that wave 1 (black) actually completed at 3387, and the market is now in wave 2 (black).
On the lower timeframe (M15), the current decline is forming an ABC structure, with the measured target for wave C at 3364 – a potential buy zone.
If price falls back to 3350 and breaks below, the 1–2–3–4–5 (yellow) count will be invalidated. In that case, the market may be unfolding a larger corrective structure, and the wave count plan will need to be updated.
3. Trading Plan
• Buy Zone: 3365 – 3363
• Stop Loss: 3349
• Take Profit 1: 3387
• Take Profit 2: 3403
⚠️ Note: The stop-loss range is relatively wide, and momentum does not fully support the bullish wave scenario yet. Traders should consider carefully before entering directly.

XAUUSD: Bulls Eyeing a Spark from the 3357 – 3352 Launchpad!We witnessed a strong bullish surge in Gold following Friday's event-driven move. Now, XAUUSD is pulling back toward a key support zone at 3357–3352, where fresh buying interest is likely to emerge. A confirmed bounce from this area could pave the way for a bullish reversal and a push toward higher targets.
🔻 Trade Setup
Entry: Buy at 3357 | Add on dips near 3352
Targets: Refer to marked zones on the chart
Invalidation: Setup becomes invalid on a daily close below 3346
📌 Risk-Reward Outlook
This setup offers a tight downside risk with strong upside potential. Stick to disciplined risk management and adjust your position size accordingly to suit your strategy.
👍 If this idea resonates with your view, drop a like and share your thoughts in the comments — let’s learn and grow together!
Happy Trading,
– The InvestPro Team

Gold's Bullish Run Meets Resistance – Time to Fade the Rally?Gold (XAUUSD) surged strongly after Friday’s event-driven move, but the momentum now appears to be stalling. Price is consolidating in a defined range, and we’re watching a key resistance zone between 3475 – 3488, where fresh sellers may step in to challenge the bulls.
🔻 Short Trade Setup – Fading the Strength
Entry: Sell at 3475
Add on Strength: 3485
Targets: See chart for marked zones
Invalidation: Daily close above 3495
📉 Risk-Reward Outlook
This setup presents a favorable risk-reward ratio, especially for short-term traders aiming to capitalize on a potential rejection at resistance. As always, keep your risk tight and position sizing disciplined.
Gold has had its run — now the odds may favor the contrarian. Keep an eye on momentum and price action at the resistance zone.
👍 If this idea aligns with your view, give it a like and drop your thoughts in the comments — let’s exchange ideas and insights!
🔔 Follow us for more actionable trade setups.
Happy Trading,
– The InvestPro Team

Gold Weekly Plan: Correction or New Rally Ahead? 🇮🇳Gold surprised everyone last week with a strong rally after the Jackson Hole symposium. The weakness in USD gave bulls fresh momentum, and now traders are once again eyeing the possibility of a new ATH in the coming weeks.
But remember — after every big impulse, the market loves to test patience. A short-term correction is possible before the next strong leg up. This is where smart traders prepare, while emotional traders often get trapped.
📊 Technical Outlook (H4 Chart)
Gold is moving inside a tight triangle pattern, signaling that a breakout is close.
Friday’s bullish candle shows the market still favors buyers, but watch out: gold often dips lower before making a major breakout move.
The strategy? Stay disciplined and only enter at confirmed Key Levels.
📌 Key Levels to Watch
Resistance: 3370 – 3383 – 3400 – 3425
Support: 3350 – 3340 – 3326 – 3315
🔥 Trading Plan (MMFlow Strategy)
BUY ZONE 🟢
Entry: 3340 – 3338
SL: 3334
Targets: 3345 – 3350 – 3355 – 3360 – 3370 – 3380 – 3390 – 3400+
SELL ZONE 🔴
Entry: 3400 – 3402
SL: 3407
Targets: 3395 – 3390 – 3385 – 3380 – 3375 – 3370
✨ Question for Indian Traders: Do you think Gold will retest supports first or break 3400 directly? 🚀
