Gold is compressed; next week’s US data will pick a side.Gold is being compressed, the upcoming US data week will determine which side is squeezed.
Good evening everyone, Brian here with a view on XAUUSD on the H2 and H4 frames for the upcoming week.
Fundamental Analysis – a "tailor-made" week for the USD
Next week is packed with US data, meaning gold will react more to numbers than narratives:
Core PPI, PPI, and Retail Sales
Initial Unemployment Claims
Prelim GDP q/q
Core PCE Price Index m/m – the Fed's preferred inflation measure
If inflation and growth come out weak, the market will lean more towards the slow growth / easing policy narrative. This usually puts pressure on the USD and supports gold, especially when real yields gradually decrease.
Conversely, stronger-than-expected data will strengthen the USD, increase yields, and create short-term downward pressure on gold. In such a context, price and liquidity areas around news release times will be more important than usual – typically, fading emotional spikes back to structural areas is safer than chasing the initial move.
Technical Analysis – triangle, FVG, and key support areas
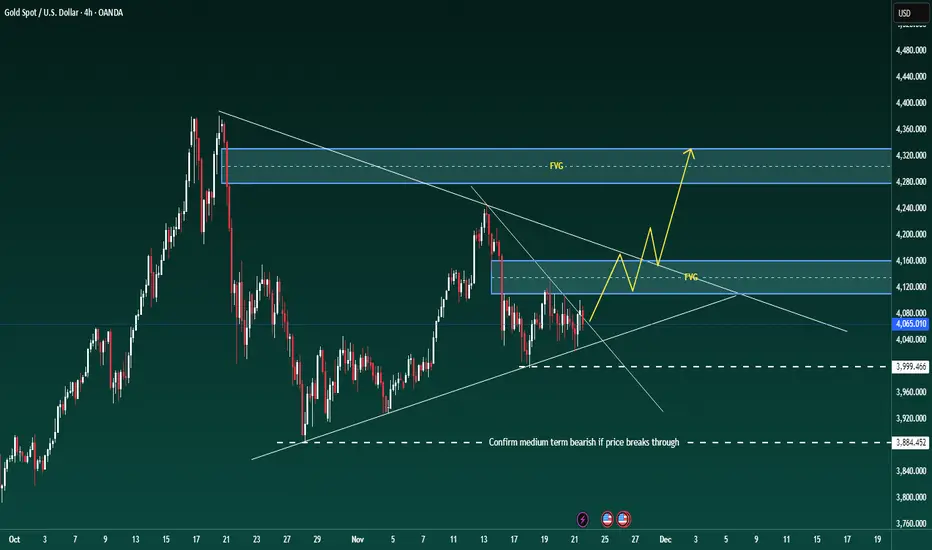
On the H4 frame, gold is still trading within a broad triangle structure. The previous decline has stalled, with prices continuously reacting at the upward support line and around 4,000, but there has yet to be a clear breakout from the pattern.
When zooming into H1–H2:
The price has broken a short-term downtrend line and closed strongly above – this is an early signal that selling pressure in this move is weakening.
The nearest support is around 4050–4040, deeper is the 4000–3998 support band (marked on the chart as important support). As long as it holds above 4,000, the structure remains positive.
Above, we have a very important confluence area around 4135–4160 including:
Fibo 0.382 of the most recent main decline
An old fair value gap (FVG) and resistance block
Chart note: "Gold will go strong if it passes this price range" – aligns with my view: if the price accepts above this area, the potential for a stronger upward move will open up.
Around 4100 is an area prone to "large liquidity response" – expect strong profit-taking and position restructuring if the price returns to this area.
Currently, I consider the market to be accumulating above 4,000 in a corrective pattern, with a slight upward bias as long as 4,000 is maintained.
Key Price Areas
Resistance:
4100 – first liquidity area
4135–4160 – Fibo 0.382 + FVG + strong resistance
Support:
4050–4040 – nearest intraday support
4000–3998 – large frame support; if broken, the picture changes
3940 area – stronger support if 4k is breached
Trading Scenarios for Next Week
(All are for reference only, not investment advice.)
Scenario 1 – Buy when price corrects above 4,000 (foundation for the next upward wave)
Idea: follow the forming upward bias as the price respects the triangle support and the 4,000 mark.
Entry area: 4050–4040 or any clean retest of the broken downtrend line on smaller frames
Cautious position addition area: 4025–4005 if there is a deep sweep to 4,000 with a strong bounce reaction
Stop loss: below 3990–3988 depending on risk appetite
Targets:
First: 4100 (liquidity area)
Second: 4135–4140 (lower edge of FVG/resistance)
Extended: 4155–4160 if a strong continuation move appears
Signals to wait for: wick rejections from support, bullish engulfing candles, or clear intraday structural phase shifts to higher highs and lows.
Scenario 2 – Break & Retest Long above 4135–4140
If the price doesn't give a deep correction and runs straight up:
Condition: H2/H4 candle closes clearly above 4135–4140 and holds on retest
Entry: when price pulls back in a controlled manner to the 4135–4140 area, turning this area from resistance to support
SL: below 4120
TP: 4180 → 4200+ depending on momentum strength
This is the "gold goes strong" scenario as noted on the chart – viewing the FVG/0.382 area as a launchpad for a larger impulsive upward wave.
Scenario 3 – Bearish scenario if 4,000 is broken
If fundamentals and flows turn against gold, decisively pushing the price below 4,000, the bullish view needs to be set aside.
Condition: daily candle closes clearly below 4000–3998
Plan: wait for the price to retrace up to retest 4000–4020 from below
Entry: short when rejection signals appear at that retest area
TP: 3960 → 3940, then reassess the structure
When below 4,000, the triangle will break down, and the market is likely to hunt deeper liquidity areas before potentially forming a new medium-term upward wave.
In summary: as long as 4,000 holds, I prioritize the buy scenario on corrections, respecting the upward potential to 4135–4160 and beyond. If there is a decisive break below 4,000, the picture will reverse – then retracements up will be opportunities to look for shorts.
Trade according to what the structure shows, not what I hope for. Manage risk tightly around next week's data points and let the major price areas "do the heavy lifting."
If this perspective helps you plan better, don't forget to follow Brian for weekly gold analysis and share your scenarios in the comments to compare.
Futures market
Gold is stuck in a wide range, ready for a decisive break.Good evening traders, Brian here with a fresh look at gold on the 2-hour chart.
Price is compressing in a broad sideways range, building energy for the next leg – the break from this structure will set the tone for the coming sessions.
Fundamental analysis
The core driver remains the Fed’s December decision. The market is effectively split on whether we see a cut or a delay:
A camp of institutions argues that rising unemployment and softer data could still justify a 25-basis-point cut in December, keeping pressure on the dollar and supporting gold on dips.
Others point out that the Fed is short of clean, up-to-date data and may prefer to wait until next year before committing to an easing cycle.
As a result, pricing for a December cut is roughly “fifty–fifty” and highly sensitive to the next run of labour-market and activity data.
In short: the macro backdrop is undecided, so intraday direction will be driven mainly by levels and liquidity until the next data catalyst hits.
Technical analysis
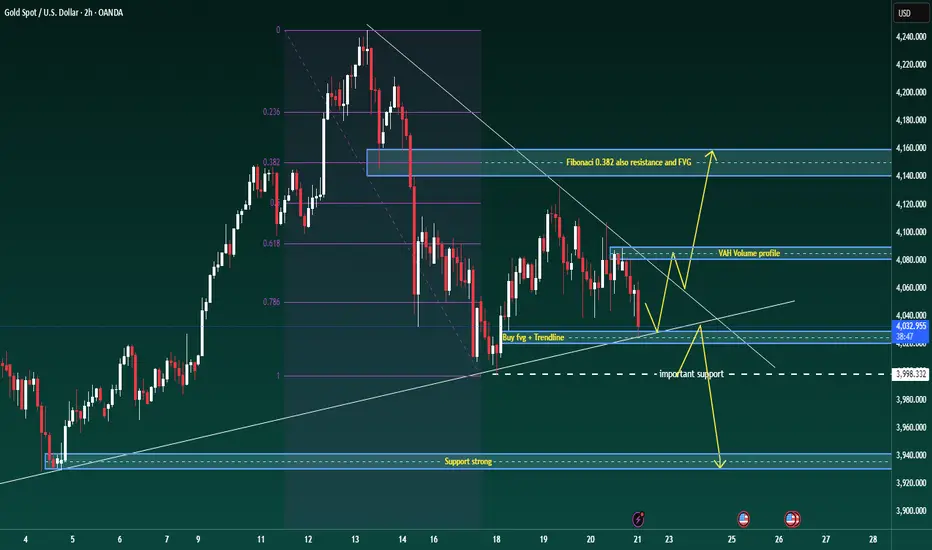
On the H2 chart, gold is in a broad consolidation after the recent sell-off:
Price is trading inside a descending structure, repeatedly respecting the short-term trendline from the recent high.
The Fibonacci retracement of the latest impulse shows the 0.382 level lining up with a prior fair-value gap and horizontal resistance – this forms a key rejection zone overhead.
Below price, there is a confluence of support where the rising trendline meets a small bullish FVG around 4027–4029, followed by a more important horizontal support band near 3998.
The volume profile highlights a Value Area High (VAH) around 4075–4080, which is likely to act as a reaction zone if price rotates back into it.
Until we break convincingly out of this structure, I treat it as a large accumulation range with a slight downside bias: sellers are still defending lower highs, but buyers are stepping in aggressively at trendline support.
Key levels
Resistance zones:
4080–4085 (VAH / short-term supply)
4135–4145 (Fibonacci 0.382 + FVG + structural resistance)
Support zones:
4027–4029 (trendline + FVG confluence buy area)
3995–4000 (important horizontal support)
3940 region (deeper support if the range finally breaks down)
Trade scenarios
1. Primary long – buy the trendline/FVG confluence
Entry: 4027–4029
Stop: 4023
Targets: 4035 – 4050 – 4068 – 4080
Idea: look for price to react at the rising trendline where it overlaps with the small FVG. A clean rejection candle or shift in intraday order flow from that zone sets up a rotation back towards the VAH and potentially the upper boundary of the range.
2. Break-and-retest short – if the trendline fails
Trigger: clear H1/H2 close below the rising trendline and the 4027 area
Plan: wait for price to retest the underside of the broken trendline / prior support
Entry: on rejection of that retest
Initial targets: 4000, then 3940 if momentum accelerates
This scenario treats any breakdown as a structural shift, using the retest as a lower-risk point to join the move rather than chasing the first leg.
3. Intraday scalp zones
These are discretionary, short-term opportunities for active traders:
Reaction sells: around 4085, and higher up if we spike into the 4135–4145 resistance band. Look for exhaustion or rejection patterns back into the range (potential targets 4060 then 4033).
Reaction buys: into 3998–4000 if we see a liquidity sweep below the current range, with tight stops and quick profit-taking back towards the mid-range.
Part 4 Learn Institutional Trading Option Pricing Concepts (Greeks)
Option pricing models use various mathematical tools called Greeks:
1. Delta
Measures how much an option's price moves with the underlying asset.
Call delta: 0 to 1
Put delta: 0 to –1
2. Theta
Measures time decay—how much premium decreases daily.
3. Vega
Measures sensitivity to volatility.
4. Gamma
Indicates how delta changes as the underlying moves.
These Greeks help traders understand risk and adjust their strategies.

Gold 4H – Liquidity Plays Ahead of Fed Minutes & PMI Data🥇 XAUUSD – Weekly Smart Money Outlook | by Ryan_TitanTrader
📈 Market Context
Gold continues to trade inside a controlled 4H consolidation as markets brace for a highly event-driven week: U.S. PMI releases, updated Fed guidance, and renewed debates over the timing of future rate cuts.
Recent data has shown mixed momentum — softer employment trends but steady business activity — keeping the dollar volatile and gold reactive near mid-range liquidity.
Institutional flows remain cautious, reducing aggressive positioning ahead of major macro catalysts. This environment typically leads to engineered sweeps on both sides of the range as Smart Money hunts liquidity before revealing direction.
Expect short-term volatility spikes, especially around U.S. session opens and PMI releases.
🔎 Technical Analysis (4H / SMC View)
• Price is navigating a minor bearish structure, forming lower highs while protecting deeper liquidity beneath 4020.
• The recent 4H BOS + corrective pullback suggests the market may generate a liquidity grab toward the discount zone before any strong bullish leg develops.
• A Premium Sell Zone at 4225–4227 sits above resting liquidity, making it an ideal region for stop hunts and short-term distribution.
• The Discount Buy Zone at 4010–4008 aligns with structural reaction points, unmitigated demand, and a liquidity shelf — ideal for accumulation.
• Mid-range liquidity around 4060–4080 may be swept before the market chooses a larger weekly direction.
🟢 Buy Zone: 4010–4008
SL: 4000
TP targets: 4085 → 4120 → 4175 → 4220
Rationale:
• Deep discount zone beneath 4H liquidity
• Confluence of demand + structural mitigation
• High probability of engineered sweep before bullish expansion
🔴 Sell Zone: 4225–4227
SL: 4235
TP targets: 4175 → 4120 → 4060 → 4015
Rationale:
• Premium supply above equal-high liquidity
• Favors stop hunt + distribution before correction
• Aligns with previous 4H rejection and imbalance fill
⚠️ Risk Management Notes
• Wait for M15 ChoCH / BOS inside each zone before entering — avoid blind entries.
• Expect spreads and liquidity manipulation around news: US PMI, Fed speeches, and data surprises.
• Avoid trading 10–20 minutes before high-impact events.
• Scale partial profits at each structural target to secure gains and let runners develop.
✅ Summary
Gold remains trapped in a structured 4H range where Smart Money is likely to sweep one side before delivering a decisive expansion.
Discounted buys at 4010–4008 and premium sells at 4225–4227 remain the highest-probability weekly setups.
Stay patient, respect liquidity, and follow confirmation.
🔔 FOLLOW @Ryan_TitanTrader for more weekly SMC setups 🚀

Gold at a Crossroads: Up or Down?If we zoom in and carefully observe how the GOLD price is moving, it becomes immediately clear:
The market has just shown a very strong upward impulse, but now something interesting is happening. The price is tightening and forming a small, narrow triangle, which indicates that the market is accumulating energy. In these situations, there are usually two possible directions, but given the clearly bullish context, I feel that a breakout to the upside is much more likely.
What do you think? Do you agree with me?
Leave your thoughts in the comments. And trust me, being part of the TradingView community will help you improve every day as a trader.
Of course, this is not financial advice, just my personal view on the chart.

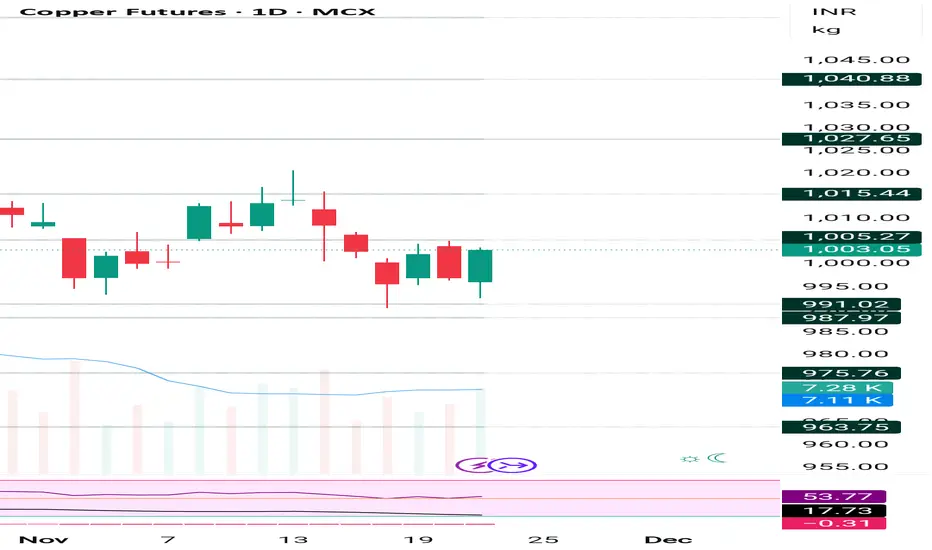
Copper AI Tool showing upmove continue holding buy 995Parameters Data
Asset Name : Price 🟩 Copper MCX : 1004.25
Price Movement 🟩 Upmove will continue to 1015.50, 1024.90 if break 1024.90 then breakout Until 998.05 not break if break then 991.50, 988.90 possible.
Reason 🟩 Technical Breakout & Long Build-up: Price ka key technical resistance (₹1000) ke upar sustain karna aur Derivatives data se Long Build-up. 🟥 Dollar Strength: US Dollar Index ki mazbooti upar ke levels par selling la sakti hai.
Confidence 🟩 Bullish 19/30 Bullish , Avoid , Bearish (63.33% score Above 60% hai, isliye Green.)
Probability 🟩 70% Upside: Price ka key moving averages ke upar trade karna aur strong Long Build-up high upside probability dikhata hai.
R:R 🟩 Favorable (Buy Side: Agar SL ₹998 aur T1 ₹1015.50 rakha jaaye, approx 1:2.5)
FNO Data 🟩 Long Build-up: Price up, OI up (Fresh buying ka sanket).
Liquidity Zones 🟩 Support Zone: ₹995.00 - ₹1000.00 (20 DEMA aur Psychological Level) 🟥 Resistance Zone: ₹1015.50 - ₹1025.00 (R1 aur R2 Levels)
Max Pain 🟨 N/A (No specific Max Pain data found)
DEMA Levels 🟩 20 DEMA: ₹998.05 50 DEMA: ₹983.07 100 DEMA: N/A 200 DEMA: N/A 250 DEMA: N/A (Short-term average ke upar trade, strong signal)
Supports 🟩 S1: ₹991.50 S2: ₹988.90 S3: ₹978.20
Resistances 🟩 R1: ₹1015.50 R2: ₹1024.90 R3: N/A
ADX/RSI/DMI 🟩 RSI(14): 58.90 (Bullish Momentum ki taraf) MACD: Bullish Crossover (Expected)
Market Depth 🟩 Buy-biased (Current price action buying interest dikhata hai)
Volatility 🟨 Moderate (VIX mein koi bada spike nahi hai)
Source Ledger 🟩 Investing.com / MCX India / QuantData (Verified sources used)
OI 🟩 Expected Increase (High volume, high conviction buying)
PCR 🟨 N/A (No explicit PCR data available)
VWAP 🟩 Buy (Price VWAP ₹999 ke upar trade kar raha hai)
Turnover 🟩 High (Volume mein badhotri expected)
Harmonic Pattern 🟨 N/A
IV/RV 🟨 IV Low: Volatility mein kami.
Options Skew 🟨 N/A (No detailed Skew data available)
Vanna/Charm 🟨 N/A (Advanced Greeks data not available)
Block Trades 🟨 N/A (No immediate Block Trades reported)
COT Positioning 🟨 N/A (No specific COT Positioning data available)
Cross‑Asset Correlation 🟨 Neutral/Inverse: Dollar se correlation weak ho raha hai, jisse Copper ko support mila.
ETF Rotation 🟨 N/A (No direct Indian ETF data)
Sentiment Index 🟩 Cautious Buy (Technical breakout aur fundamental support ke chalte)
OFI 🟨 N/A (Order Flow Imbalance data not explicitly available)
Delta 🟨 N/A (Options Delta data not explicitly available)
VWAP Bands 🟩 Price above VWAP (Bullish indication)
Rotation Metrics 🟨 N/A
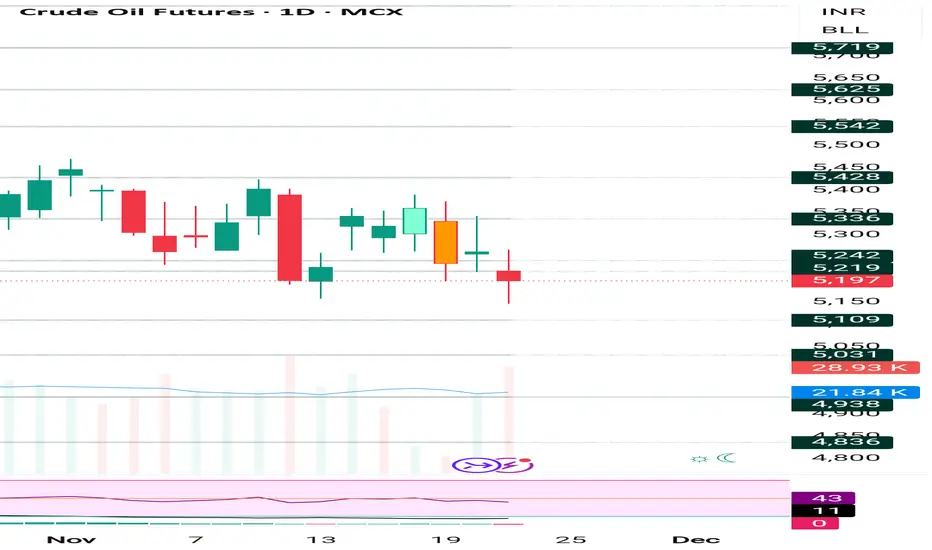
Crude MCX AI tool showing sideways till 5100 or 5280 not break Parameters Data
Asset Name : Price 🟥 Crude Oil MCX (Dec) : 5,188
Price Movement 🟨 Sideways will continue to 5,280, 5,350 if break 5,350 then breakout Until 5,100 not break if break then 5,030, 4,950 possible.
Reason 🟨 Demand Concerns vs. OPEC+ Cuts: Global demand ki chinta aur US inventories mein build-up se prices par dabaav, jise OPEC+ ke supply cuts support de rahe hain.
Confidence 🟨 Neutral 15/30 Bullish , Avoid , Bearish (50.00% score 40% se 60% ki range mein hai, isliye Yellow/Neutral.)
Probability 🟨 60% Sideways/Consolidation: Jab tak ₹5,100 aur ₹5,350 ki range break nahi hoti, tab tak range-bound movement expected hai.
R:R 🟨 Neutral: Current levels par R:R 1:1 ke aas-paas hai.
FNO Data 🟨 Liquidation/Unwinding: Price down aur OI down (-2.15%) dikha raha hai.
Liquidity Zones 🟩 Support Zone: ₹5,100 - ₹5,150 (Key Psychological Support) 🟥 Resistance Zone: ₹5,300 - ₹5,350 (Previous Highs)
Max Pain 🟨 N/A (No specific Max Pain data found)
DEMA Levels 🟨 20 DEMA: ₹5,250 50 DEMA: ₹5,105 100 DEMA: N/A 200 DEMA: N/A 250 DEMA: N/A (Price 20 DEMA ke neeche, 50 DEMA ke upar, neutral bias.)
Supports 🟩 S1: ₹5,100 S2: ₹5,030 S3: ₹4,950
Resistances 🟥 R1: ₹5,280 R2: ₹5,350 R3: ₹5,500
ADX/RSI/DMI 🟨 RSI(14): 49.20 (Neutral) ADX: 18.00 (Weak Trend)
Market Depth 🟨 Neutral (No strong bias)
Volatility 🟨 Moderate (ATR values stable hain.)
Source Ledger 🟩 MCX / CME / OANDA (Verified sources used)
OI 🟨 16,500 contracts (Change: -2.15%; minor unwinding)
PCR 🟨 N/A (No explicit PCR data available)
VWAP 🟥 Sell (Price VWAP ₹5,220 ke neeche trade kar raha hai)
Turnover 🟨 Moderate
Harmonic Pattern 🟨 N/A
IV/RV 🟨 IV Moderate: Implied Volatility stable hai.
Options Skew 🟨 Neutral (No strong directional Skew dikh raha hai)
Vanna/Charm 🟨 N/A (Advanced Greeks data not available)
Block Trades 🟨 N/A (No immediate Block Trades reported)
COT Positioning 🟨 Neutral (Large money managers long position maintain kar rahe hain.)
Cross‑Asset Correlation 🟨 Neutral to Equities: Correlation weak hai.
ETF Rotation 🟨 Neutral
Sentiment Index 🟨 Cautious Neutral
OFI 🟨 N/A (Order Flow Imbalance data not explicitly available)
Delta 🟨 N/A (Options Delta data not explicitly available)
VWAP Bands 🟥 Price below VWAP (Bearish indication)
Rotation Metrics 🟨 N/A
Silver comex AI Tool showing bounce back, holding buy 49.25 Parameters Data
Asset Name : Price 🟥 Silver Comex (Dec) : 49.975
Price Movement 🟥 Downmove will continue to 49.35, 48.06 if break 48.06 then breakdown Until 50.55 not break if break then 50.85, 51.57 possible.
Reason 🟥 Strong US Dollar & Profit Booking: Recent rally ke baad short-term profit booking aur Fed rate cut expectations mein kami se Dollar Index strong hua, jiske kaaran selling pressure aaya.
Confidence 🟨 Neutral 14/30 Bullish , Avoid , Bearish (46.67% score 40% se 50% ki range mein hai, isliye Yellow/Neutral.)
Probability 🟨 50% Sideways/Correction: Strong support par hai, par selling pressure aur Dollar strength ke chalte major upside filhaal limited hai.
R:R 🟨 Neutral: R:R ratio current levels par 1:1.5 ke aas-paas hai.
FNO Data 🟥 Short Term Liquidation: Price down aur OI High (around 54.39K) hai, jo Short Build-up ya Long Unwinding ka sanket deta hai.
Liquidity Zones 🟩 Support Zone: $49.00 - $48.06 (Day's Low, Technical Support) 🟥 Resistance Zone: $50.35 - $50.55 (Previous Close, Day's High)
Max

Gold mcx AI Tool report showing upmove, holding buy @121600 Parameters Data
Asset Name : Price 🟩 Gold MCX (Feb '26) : 1,24,101
Price Movement 🟩 Upmove will continue to 1,24,500, 1,25,500 if break 1,25,500 then breakout Until 1,22,000 not break if break then 1,21,800, 1,19,250 possible.
Reason 🟩 Technical Reversal & Analyst View: Strong buying interest ne ₹1,22,000 ke crucial support ko hold kiya. Global cues (US rate cut bets) se thoda pressure.
Confidence 🟩 Bullish 19/30 Bullish , Avoid , Bearish (63.33% score Above 60% hai, isliye Green.)
Probability 🟩 70% Upside: Bullish trend structure intact hai, aur price key support se upar trade kar raha hai.
R:R 🟩 Favorable (Upside Target ₹1,27,000 vs SL ₹1,22,000. Approx 1:1.45)
FNO Data 🟩 Short Covering / Long Build-up: Correction ke baad recovery indicates short-covering aur fresh buying.
Liquidity Zones 🟩 Support Zone: ₹1,22,000 - ₹1,21,800 (Crucial Technical/Analyst Support) 🟥 Resistance Zone: ₹1,24,500 - ₹1,25,500 (Near-Term Supply Zone)
Max Pain 🟨 N/A (No specific Max Pain data found for this contract)
DEMA Levels 🟩 20 DEMA: ₹1,21,875 50 DEMA: ₹1,18,985 100 DEMA: N/A 200 DEMA: N/A 250 DEMA: N/A (Price 20 DEMA ke aas-paas hai, 50 DEMA ke upar, long-term trend bullish.)
Supports 🟩 S1: ₹1,22,000 S2: ₹1,21,570 S3: ₹1,20,905
Resistances 🟩 R1: ₹1,24,500 R2: ₹1,25,500 R3: ₹1,27,000
ADX/RSI/DMI 🟨 RSI(14): 49.129 (Neutral) ADX: 15.033 (Weak/No Trend)
Market Depth 🟨 Neutral (Day-end data, no strong bias)
Volatility 🟨 Moderate (ATR values low volatility show kar rahe hain)
Source

Gold Comex XAUUSD holding buy @4035 , target 4110, 4150, 4185Parameters Data
Asset Name : Price 🟩 Gold Comex : 4080.50
Price Movement 🟩 Upmove will continue to 4095, 4110 if break 4110 then breakout Until 4050 not break if break then 4025, 4000 possible.
Reason 🟩 Geopolitical Risk & US Dollar Weakness: Middle East tension aur Dollar Index mein kami se safe-haven demand badhi. 🟥 RSI Overbought: Short-term correction ki possibility.
Confidence 🟩 Bullish 22/30 Bullish , Avoid , Bearish (73.33% score Above 60% hai, isliye Green.)
Probability 🟩 80% Upside: Price all-time high zone mein hai, jahan momentum aur risk appetite strong hai.
R:R 🟨 Neutral: Current level par R:R 1:1 hai. Pullback par entry favorable (1:2) ho sakti hai.
FNO Data 🟩 Strong Long Build-up: Price up aur OI up expected hai. Fresh buying ka sanket.
Liquidity Zones 🟩 Support Zone: $4050 - $4065 (Previous Resistance turned Support) 🟥 Resistance Zone: $4095 - $4110 (Next Technical Target)
Max Pain 🟨 N/A (No specific Max Pain data found for this contract)
DEMA Levels 🟩 20 DEMA: $4045.00 50 DEMA: $3995.00 100 DEMA: N/A 200 DEMA: N/A 250 DEMA: N/A (All key averages ke upar trade, extremely bullish signal)
Supports 🟩 S1: $4065.00 S2: $4050.00 S3: $4025.00
Resistances 🟩 R1: $4095.00 R2: $4110.00 R3: N/A
ADX/RSI/DMI 🟥 RSI(14): 75.10 (Overbought) ADX: 45.00 (Very Strong Trend)
Market Depth 🟩 Buy-biased (High demand at $4075 levels)
Volatility

Gold I already posted in the base to blast the gold now it's going very nice with 1:11 ratio.i will blast again also.plan execute Sl or target no partial booking no cost to cost .follow the system

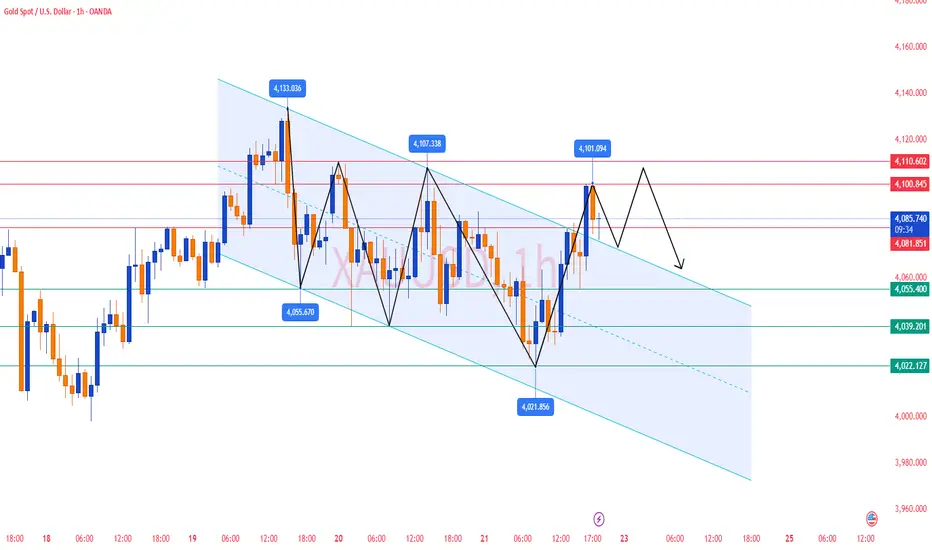
Gold Analysis and Trading Strategy | November 21-22✅From the 4-hour timeframe, gold rebounded strongly to 4101 (previous high + Bollinger upper band + MA20 resistance) and then quickly fell back to the 4080 area, indicating that selling pressure at higher levels remains very strong.
1️⃣ Moving averages remain bearish
MA5 and MA10 have turned upward slightly, but overall still remain below MA20.
MA20 (around 4155) acts as strong resistance, and the failure to break above shows the rebound is still a weak corrective move, not a trend reversal.
2️⃣ Bollinger Bands remain weak
Price continues to trade near the Bollinger mid-band (around 4071) and has failed multiple times to break the upper band.
The Bollinger Bands have not expanded upward, indicating the market is still in a weak, range-bound structure.
3️⃣ Clear rejection signal
A long upper wick formed at 4101 — a classic “spike and reversal” pattern.
Bears aggressively sold at resistance, forming a clear short-term top.
📌 H4 Conclusion:
Rebound met resistance, the market remains in a weak corrective phase, and no bullish reversal structure has formed.
✅ On the 1-hour timeframe, gold rebounded strongly from 4022 → 4101, but still failed to break through key resistance.
1️⃣ Rebound failure at 4101 → structure shifts to consolidation
After touching 4101, gold quickly pulled back to the 4080 area, showing weakening bullish momentum.
This level corresponds to previous highs + Bollinger upper band resistance, making a breakout difficult.
2️⃣ Moving averages continue to suppress
MA10 / MA20 / MA60 remain in a bearish configuration; the H1 structure has not turned bullish.
Although 4080 provides support, rebound highs are gradually decreasing, signaling fading momentum.
3️⃣ Short-term rebound strength is limited
The most recent rebound only reached MA10 and failed to regain key levels.
This confirms the bounce is a weak correction, not a structural trend change.
📌 H1 Conclusion:
Short-term spike faded, structure remains weak, and rebound is unlikely to break above the 4100–4110 strong resistance zone.
🔴 Resistance Levels
4100–4110 (major resistance zone: previous high + MAs + Bollinger upper band)
4132
4155
🟢 Support Levels
4075–4070
4044–4038
4022
3997
✅If you would like to receive real-time trading signals and professional guidance, you are welcome to join our membership. We provide comprehensive services including account risk management, position control, and strategy adjustments to help you achieve stable and consistent profits in the market🤝
✅ Trading Strategy Suggestions (Key Focus Today)
🔰 Strategy 1: Sell the Rebound (Primary Strategy)
If gold rebounds to 4095–4105 and faces rejection:
✔️ Light short positions
❌ Stop-loss: 4118 (exit immediately if price breaks above 4110)
🎯 Targets: 4075 / 4055 / 4040
👉 Reason: 4100–4110 is extremely strong resistance with low probability of a breakout.
🔰 Strategy 2: Short After a Failed Breakout
If price makes a false breakout above 4110 but fails to hold:
✔️ Enter short immediately
🎯 Same targets as above
⚠️ A long upper wick is a bearish signal.
🔰 Strategy 3: Trend-Following Short on Breakdown
If gold breaks 4038–4044:
✔️ Follow with breakout shorts
🎯 Targets: 4022 / 4008 / 3997
👉 This zone is the key dividing line; breaking it gives full control to the bears.
🔥Trading Reminder: Trading strategies are time-sensitive, and market conditions can change rapidly. Please adjust your trading plan based on real-time market conditions.
Smart Money Liquidity Trap Explained⭐ Smart Money Liquidity Trap Explained
✨ A deep dive into how institutions manipulate price before major moves ✨
In every financial market — Forex, Crypto, Stocks, Indices — price doesn’t simply move at random. Behind the scenes, Smart Money (institutions, banks, hedge funds) engineer setups that allow them to enter positions at the best possible price. One of their most effective tools is the Liquidity Trap.
Let’s break it down beautifully and clearly. 👇
🔥 What Is a Liquidity Trap?
A Liquidity Trap occurs when Smart Money deliberately pushes price into areas loaded with:
❌ Stop-loss orders
📉 Sell-side liquidity
📈 Buy-side liquidity
😰 Emotional retail entries
🔥 Breakout traders placing pending orders
These areas become liquidity pools — perfect fuel for institutions to fill their massive positions.
Retail traders think it’s a breakout…
But Smart Money thinks:
➡️ "Thank you for the liquidity."
🧩 How Smart Money Creates the Trap
1️⃣ Phase 1: Build the Setup
Smart Money guides price slowly toward an obvious level:
A clean high
A clean low
A trendline
A double top/bottom
Retail traders get excited:
📢 “Breakout coming!”
But institutions are simply gathering attention.
2️⃣ Phase 2: The Liquidity Grab ⚡
Price spikes violently above/below the obvious level.
This move triggers:
🟥 Stop-loss hunts
📉 Forced liquidations
💥 Breakouts that fail instantly
This sudden spike gives institutions the liquidity needed to place large buy or sell orders without causing massive slippage.
This is why the spike is often fast and dramatic.
3️⃣ Phase 3: The Real Move Begins 🚀
After the liquidity is collected, price reverses sharply.
This is the moment Smart Money actually commits to the real direction.
Retail traders feel:
🤯 “Why did it reverse?!”
😭 “I got stopped out for nothing!”
😵 “The breakout was fake!”
But Smart Money simply executed their strategy perfectly.
🎯 How to Use Liquidity Traps in Your Trading
Study where retail traders commonly place:
⛔ Stops
📌 Breakout orders
❗ Predictable entries
Then wait for the fast liquidity grab followed by:
A displacement 🎇
A sharp wick rejection
A structure shift (CHoCH / BOS)
These signals often reveal the true direction of the upcoming move.
💡 Key Features of a Smart Money Liquidity Trap
✨ Sudden spike into obvious areas
✨ Fast liquidation and stop-hunting behavior
✨ Sharp wick rejections
✨ Structure shift after the spike
✨ Smooth continuation in the real direction
🚀 Why This Concept Is So Powerful
Recognizing liquidity traps allows you to:
❌ Avoid fake breakouts
🛡️ Protect yourself from stop-hunts
🎯 Enter the market at premium/discount levels
🤝 Align with Smart Money
💼 Improve long-term consistency
This is how professional traders stay on the right side of volatility — by understanding why the market moves, not just where it moves.

Instant BEARish Trade Any RISE above 4068 is SELL till 4072
SL at 4077.30
TP 1: 4061
TP 2: 4058
TP 3: 4053

Gold H1 – Is This Just a Range or a Break Incoming?🟡 XAUUSD – Intraday Smart Money Plan | by Ryan_TitanTrader (21/11)
📈 Market Context
Gold continues to trade inside a compressed intraday range as markets react to the latest discussion on whether the Federal Reserve is likely to cut interest rates anytime soon.
According to new reports, policymakers remain cautious, and early rate-cut expectations are fading as inflation progress slows.
This shift pushes USD stronger, increases Treasury yields, and temporarily weakens gold’s bullish momentum.
Key takeaways from the news:
• Fed officials note that inflation is “still not where it needs to be,” reducing the probability of early rate cuts.
• Markets have scaled back expectations for a Q1 cut, keeping USD supported.
• Higher yields → tighter financial conditions → gold struggles to break premium levels.
• Institutions are likely engineering liquidity grabs on both sides before committing to a new directional move.
Price is currently sitting near the 4030–4045 zone, right above discount liquidity, waiting for a catalyst to break out of the short-term compression.
🔎 Technical Analysis (1H / SMC Structure)
• Market Structure:
Gold has completed a clear CHoCH + short-term bearish sequence and is now compressing into the discount zone around 4030.
• Premium Sell Zone (4H Supply):
4128–4130 aligns with unmitigated supply + buy-side liquidity resting above internal highs.
• Discount Buy Zone:
4030–4028 sits inside the last clean demand zone where a previous sweep occurred.
• Liquidity Map:
→ Buy-side liquidity: above 4128–4135
→ Sell-side liquidity: below 4028–4020
Institutions are likely to sweep one side before delivering direction.
🔴 Sell Setup (Premium Reaction Zone)
• Entry: 4128 – 4130
• Stop-Loss: 4140
• Take-Profit:
→ 4080 (minor imbalance fill)
→ 4045 (range EQ)
→ 4030–4028 (discount demand retest)
📌 Execution rule: Wait for liquidity sweep into the zone + bearish CHoCH on M5–M15 before entering.
🟢 Buy Setup (Discount Reaction Zone)
• Entry: 4030 – 4028
• Stop-Loss: 4020
• Take-Profit:
→ 4060 (short-term reaction level)
→ 4095 (inefficiency fill)
→ 4120 (premium retest)
📌 Valid only if price sweeps the 4030–4028 pocket and shows bullish displacement from discount.
⚠️ Risk Management Notes
• USD strength may spike unexpectedly as rate-cut bets fade — reduce position size during volatility.
• Avoid trading inside the 4045–4085 chop zone unless a clean structure break forms.
• Manage trades aggressively once liquidity levels are taken.
• Expect engineered manipulation during low-volume Asian hours.
📝 Summary
Gold is compressing inside a narrow intraday range as markets reassess the likelihood of Fed rate cuts.
SMC structure suggests a two-sided liquidity sweep before a decisive move:
• Sell Zone: 4128–4130 (premium supply)
• Buy Zone: 4030–4028 (discount demand)
Expect classic accumulation → sweep → displacement patterns until macro conditions create a new trend.
📍 Follow @Ryan_TitanTrader for more Smart Money updates.

XAUUSD – Where Smart Money Strikes Today🌐 MARKET CONTEXT
Gold enters today’s session after a period of controlled volatility, with price repeatedly reacting around key liquidity pockets but failing to produce a clean breakout. The M30 structure remains bearish, with price rejecting premium levels and forming consistent lower highs.
Recent Drivers
USD stays firm as markets maintain expectations of a slightly hawkish Federal Reserve
Traders await upcoming mid-week data → low conviction, cautious positioning
Overall sentiment remains neutral — no strong safe-haven pressures
Session Outlook
London Session: Likely to engineer early sweeps into premium supply zones
New York Session: Higher chance of real directional expansion
Bias: Bearish intraday until discount zones trigger a CHoCH (shift of character)
Price is currently inside mid-range, so the safest setups remain at extremes where liquidity is concentrated.
📉 TECHNICAL ANALYSIS (SMC + LIQUIDITY)
Market Structure
M30 Trend: Lower High → Lower Low sequence
Equilibrium zone: 4068–4085
Inducement layers resting above 4147 and 4081
Liquidity Levels
BSL: Above 4147 & 4081
SSL: Below 4033 & deep liquidity at 3993
Market continues printing engineered wicks, trapping impulsive traders
Imbalances
Bearish FVG: 4147–4148 → perfect for premium scalp sells
Minor imbalance: 4081
Discount inefficiencies near 4033 and 3993 → ideal buy setups
🔑 KEY PRICE ZONES (Strong Logic + Clear Explanation)
4148–4147 ▶️ Premium Liquidity Trap – High-Quality Sell Zone
This area holds an unmitigated bearish order block combined with buy-side liquidity.
Smart Money typically uses this zone to trap breakout buyers before reversing sharply.
4079–4081 ▶️ Secondary Premium Sweep Zone – Fast Rejection Expected
A mini liquidity pool just above equilibrium, designed for early-session stop hunts.
Often triggers sharp intraday reversals.
4035–4033 ▶️ Discount Reaction Zone – Clean Scalping Demand
This zone holds micro-demand + SSL resting below.
Expect low-drawdown reactions ideal for quick intraday buys.
3995–3993 ▶️ Deep Discount Liquidity Pool – High-Probability Reversal Base
A rich accumulation of Sell-Side Liquidity combined with HTF discount structure.
Strong reversal potential if price reaches this level.
⚙️ TRADE SETUPS (High-Precision SMC Execution)
✔️ SELL SETUP 1 – Premium Rejection Sell
Entry: 4148–4147
Stoploss: 4126
TP1: 4135
TP2: 4120
TP3: 4085
Logic: BSL sweep + bearish imbalance fill → sharp sell-off expected.
✔️ SELL SETUP 2 – Mid-Range Liquidity Sweep
Entry: 4079–4081
Stoploss: 4087
TP1: 4065
TP2: 4048
TP3: 4033
Logic: Quick liquidity hunt above equilibrium followed by displacement.
✔️ BUY SETUP 1 – Intraday Scalping Rebound
Entry: 4035–4033
Stoploss: 4027
TP1: 4048
TP2: 4070
Logic: SSL sweep → micro CHoCH → ideal for fast bullish reaction.
✔️ BUY SETUP 2 – Deep Discount Reversal
Entry: 3995–3993
Stoploss: 3987
TP1: 4010
TP2: 4040
TP3: 4070
Logic: Major discount zone + liquidity buildup → strong reversal potential.
🧠 NOTES / SESSION PLAN
Avoid mid-range trading — only trade at liquidity extremities
Expect London fake-outs; real movement likely in NY
Always wait for M5/M15 confirmation (CHoCH + BOS)
Avoid buying in premium areas; avoid selling in deep discount zones
Follow strict risk management — volatility may spike unexpectedly
🏁 CONCLUSION
Gold continues to hold a bearish intraday structure, favouring premium sell setups at 4147 and 4081.
Discount zones at 4033 and 3993 offer high-probability buy reactions and possible deeper reversals.
Trade with patience. Execute only at liquidity extremes.
Let Smart Money show its trap — then strike with precision.

#XAUUSDPlease stick to your strategies
Any resistance will lead to big losses
Never take revenge on the market if a loss is triggered
Close the trade if the channel ceiling is broken

XAUUSD Bullish Retracement Setup from Support Zone Toward Key Re1. Market Structure
Price is currently trading near a major support zone (~4055–4060 area), highlighted in blue.
Multiple rejections from this zone in the past indicate strong buying interest.
The structure shows higher lows forming intraday, suggesting bullish pressure building.
2. Key Zones
🔵 Support Zone (Entry Region)
Marked around 4055–4060.
Price dipped into this zone and bounced, showing a potential demand area for long positions.
🔵 Resistance Level (First Target Region)
Around 4081–4098.
This is the first major resistance the price is likely to test after bouncing.
🔵 Final Target Zone
4120 area, the upper major resistance.
Previous highs around this level show strong selling interest historically.
3. Expected Price Movement
The chart suggests a potential bullish move:
Price bounces from the support (entry) area.
Climbs toward 4081 (minor resistance).
Retraces slightly.
Continues upward toward 4097–4100.
Final push toward 4120 target zone.
This is a classic retracement + continuation bullish structure.
4. Trade Idea
Bias: Bullish
Entry: 4055–4060 (support zone)
First TP: 4081
Second TP: 4097–4100
Final Target: 4120
Stop Loss: Below 4050 (beneath support zone)

Gold XAUUSD – Fresh Resistance Tested Twice, Bears Eye 4057 PullGold gave us a clean reaction today, rejecting the 4107–4110 supply zone not once, but twice. That double tap reinforced a fresh resistance band at 4087–4095, where sellers stepped back in with intention.
As long as 4012 holds on the upside, this resistance zone remains my short-term line in the sand. Any push back into 4087–4095 may attract renewed selling pressure, keeping the door open for a move toward 4057, with momentum potentially extending lower if sellers stay in control.
I’ll be watching how price behaves on each revisit—structure remains king.
Your feedback drives our content and keeps everyone trading smarter. Let’s make those pips together! 🚀
Happy Trading,
– The InvestPro Team

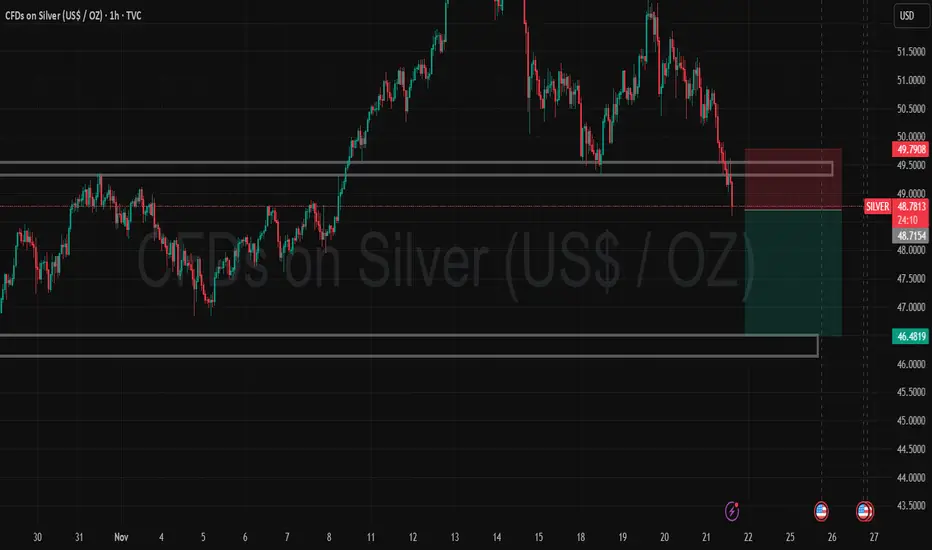
Silver Look Good for short with 1:2 target Trend: Bearish. The market has shifted from an uptrend to a downtrend.
Pattern: Break and Retest. Price broke below the 49.50 support level, retested it as resistance, and is now rejecting it.
The Trade: A Short (Sell) setup is active.
Target (TP): 46.48 (Lower support zone).
Stop Loss (SL): 49.79 (Just above the current resistance).
Outlook: Sellers are in control as long as the price stays below 49.80
XAU/USD: Gold Set to Test Downtrend Line!⏰ Timeframe: 30m
📅 Update: 11/21/2025
🔍 Market Context
After adjusting from the 4,107 USD area, gold is moving sideways in the liquidity rebalancing zone – indicating a tug-of-war between the two sides.
The consecutive CHoCH – BOS movements forming around the 4,006 USD bottom show that buying pressure is starting to reappear.
The current decline seems to be just a correction phase, not yet showing enough signs of a complete reversal of the medium-term uptrend structure.
📊 Technical Structure
Downtrend line: continues to act as dynamic resistance – a confirmation area for the recovery trend if broken.
OB Bullish (4,006 USD): confluence with the previous liquidity bottom, is a potential BUY Zone.
Break–Resistance (4,045 USD): the first level to surpass to confirm buying pressure.
OB Bearish (4,086–4,107 USD): short-term supply zone – short-term SELL Zone, may witness profit-taking reactions if the price touches it.
🎯 Market Outlook
1️⃣ Priority Scenario:
– Price may retest the OB Bullish / BUY Zone (4,006–4,025 USD).
– When a clear upward reaction appears, gold is likely to break through the downtrend line, heading towards OB Bearish (4,086–4,107 USD).
2️⃣ Alternative Scenario:
– If the price does not hold the 4,006 USD area, the short-term structure will be invalidated, opening the possibility of retreating to a lower equilibrium area around 3,985 USD.
💎 Key Zones
BUY Zone: 4,006 – 4,025 USD → demand zone confluence OB + liquidity bottom.
SELL Zone: 4,086 – 4,107 USD → potential supply zone if the recovery trend is activated.
🧠 Analyst’s View
Gold is in a short-term accumulation state with signs of capital flow gradually leaning towards the buyers.
The retest phase of the 4,006 USD support area will be the key confirmation for a reversal – retest – continuation phase.
As long as the price stays above this area, the priority remains a buy-the-dip scenario in the short term.
🛡️ Risk Note
The market is operating in a "break or hold" zone – clear confirmation is needed before following the trend.
Analysis is for technical and educational purposes, not trading advice.

OVERVIEW GOLD CHART H1 11/21 🧭 1. CURRENT MARKET CONTEXT
Gold remains in a downtrend on the H1 timeframe, despite a minor rebound after the NFP release.
A sharp drop to 4,039 created a new low, followed by a weak recovery and sideways movement during the Asian session.
When the London session opened, price broke below the consolidation zone, confirming that sellers are still in control of the market.
Key highlights:
• The market remains bearish as long as price stays below 4,052–4,060
• Volume Profile shows VAL at 4,052 turning into a new resistance
• Intraday structure continues to form lower highs → maintaining the main downtrend
⸻
🔍 2. TECHNICAL ANALYSIS – H1
🔹 Trend overview
• H1: Clear bearish pattern with consecutive LL – LH.
Breakout from the Asian session sideways confirms the continuation of the downtrend.
🔹 Price action
• Asian session: Price consolidates after the sharp drop
• European session: Break below the sideways range → sellers continue to push
• All upward moves are just retracements – not a reversal
⸻
📌 3. IMPORTANT PRICE ZONES
🔥 Resistance zones (SELL priority)
• 4,040 – 4,052 → Strong intraday resistance
– Confluence of VAL, supply zone, and downtrend line
• 4,060 – 4,070 → For deeper pullbacks
🟩 Support zones (downside targets)
• 3,995 – 4,005 → Stronger support – extended target if selling momentum increases
⸻
🎯 4. TRADING SCENARIOS
🔻 Scenario 1 – Most important (priority)
SELL on pullback
If price retraces to 4,040 – 4,052 and shows rejection signals (M5/M15):
Sell zone: 4,040 – 4,052
TP: 4,025 → 4,010 → 3,995
SL: Above 4,060
🔻 Scenario 2 – Continuation after breaking the low
If price breaks 4,028 with a strong H1 candle close:
Sell continuation
TP: 4,010 → 3,995
SL: 4,045
🔻Scenario 3 – Only trigger on reversal structure
If price breaks & closes above 4,060, the structure weakens:
➡️Quick Buy: up to 4,075 → 4,092
(Only trade with strong signals – this is a counter-trend setup)
⸻
🥇 5. CONCLUSION
• Main trend: Down – SELL is preferred
• Best entry zone: 4,040 – 4,052 (strong confluence)
• Only Buy on a clear break above 4,060

Trade deal on Monday ????# NIFTY FUTURES - Clean Breakout & Successful Retest 🎯
## Key Observations:
**Price Action:**
- Strong breakout from the consolidation range (marked in blue)
- Successfully retested the breakout level around 26,000
- Currently trading at 26,170.50, holding well above the breakout zone
**Technical Strength:**
- Price firmly above 42-period VWMA (shown in white)
- Moving averages aligned in bullish formation and trending upward
- Despite global market weakness, Nifty showing remarkable resilience
**Market Sentiment:**
- International markets showing negativity
- Indian markets displaying relative strength - decoupling from global weakness
- Strong institutional support evident
## Conclusion:
All technical indicators converging toward one direction - **BULLISH BIAS**
The successful retest of breakout level combined with strong relative strength against weak global markets presents a high-probability long setup.
**Strategy:** Look for long entries on minor dips with stop loss below recent retest lows.
---
*Current Price: 26,170.50 | Change: +30.50 (+0.12%)*
#NIFTY #NiftyFutures #TechnicalAnalysis #Breakout #IndianMarkets #NSE
