Elliott Wave Analysis XAUUSD – September 19, 2025
Momentum
• D1 timeframe: Momentum is currently declining, suggesting that the downtrend may continue until momentum enters the oversold zone. This process could take at least 2 daily candles, including the current one.
• H4 timeframe: Momentum is turning upward, but repeated reversals at the oversold zone, along with overlapping price action, indicate that the market is in a complex corrective phase.
• H1 timeframe: Momentum has already turned upward, with 3 H1 bullish candles formed. It is expected that within 1–2 more candles, momentum will likely reach the overbought zone.
Wave Structure
• D1 timeframe: The 5-wave black structure has been completed. The current correction is expected to last longer compared to the previous WXY triangle correction.
• H4 timeframe: Wave counting is complicated due to overlapping price movements. With momentum now recovering, wave B is likely unfolding, which will then be followed by the completion of wave C.
• H1 timeframe: A temporary channel can be drawn to observe price behavior. The market is likely in wave B (black), forming a Flat structure (ABC in blue). Wave C (blue) is projected to equal wave A (blue) at the 3667 level. This price zone also coincides with the boundary between high and low liquidity areas on the Volume Profile, making it a strong resistance zone for potential short entries.
Trading Plan
• Sell Zone: 3667 – 3670
• SL: 3680
• TP: 3644
Futures market

Gold Today Intraday TradeDear Trader I,m Analysis
Gold has recently hit fresh highs around $3,700/oz, but now there’s profit-booking and resistance in that zone.
Support is seen near $3,640–$3,630/oz, which has acted as a demand zone in recent dips.
Some indicators are overbought (like RSI / Williams %R) or showing signs that upside momentum could be weakening unless price breaks certain resistance levels.
There is a possible bearish bias now if gold fails to clear resistance—to the upside, a breakout above ~$3,700+ could trigger further gains
---
📈 Key Levels to Watch
Level Type Approximate Price ($/oz)
Strong Resistance ~ $3,700–$3,707
Near Resistance ~$3,678–$3,680
Strong Support ~$3,640–$3,630
Deeper Support ~$3,600

GOLD SHOWING A GOOD UP MOVE WITH 1:10 RISK REWARD GOLD SHOWING A GOOD UP MOVE WITH 1:10 RISK REWARD
DUE TO THESE REASON
A. its following a rectangle pattern that stocked the market
which preventing the market to move any one direction now it trying to break the strong resistant lable
B. after the break of this rectangle it will boost the market potential for break
C. also its resisting from a strong neckline the neckline also got weeker ald the price is ready to break in the outer region
all of these reason are indicating the same thing its ready for breakout BREAKOUT trading are follws good risk reward
please dont use more than one percentage of your capitalfollow risk reward and tradeing rules
that will help you to to become a bettertrader
thank you

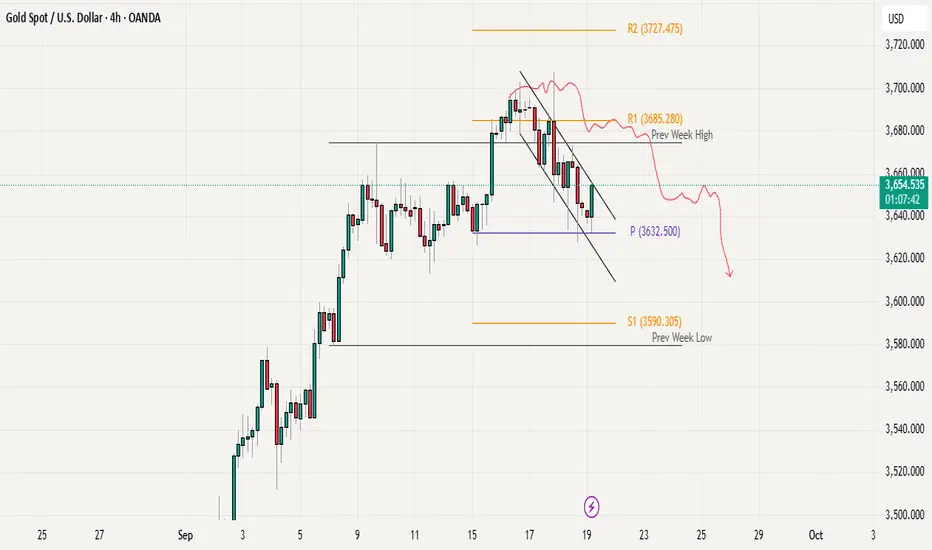
Gold Intraday Analysis: Range Play Until BreakoutGold is currently trading in a range-bound structure after pulling back from the 3700 level. The weekly pivot around 3632 is acting as strong support, while the 3700 zone serves as resistance, forming the upper boundary of the range. Price is showing signs of consolidation between these levels, suggesting a sideways market. For any breakout confirmation, we need to see a clear H1 or H4 candle close above 3700 or below 3632, along with volume or strong price rejection/follow-through. Until then, the price action favors range trading within these key levels.

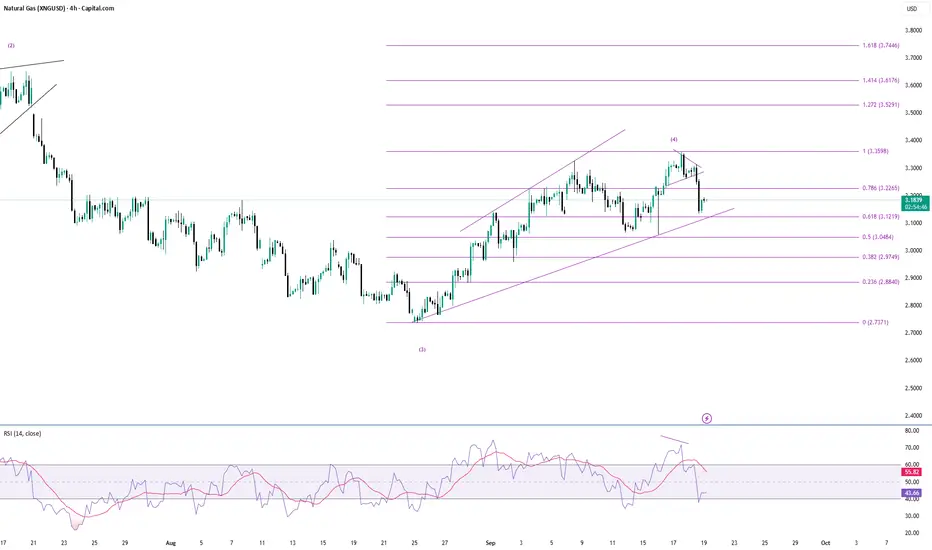
Natural Gas another leg of correction?Looks like natural gas is taking support at the 0.618 level of the previous swing. If this level (3.1228) is broken, we can expect a big move on the down side.
Gold longGold can touch 3654 SL is 3638, education purpose only you can monitor,if you trade there may be somewhat happen either side

Gold Trading Inside Channel – Key Support & Resistance Levels!Hello Traders!
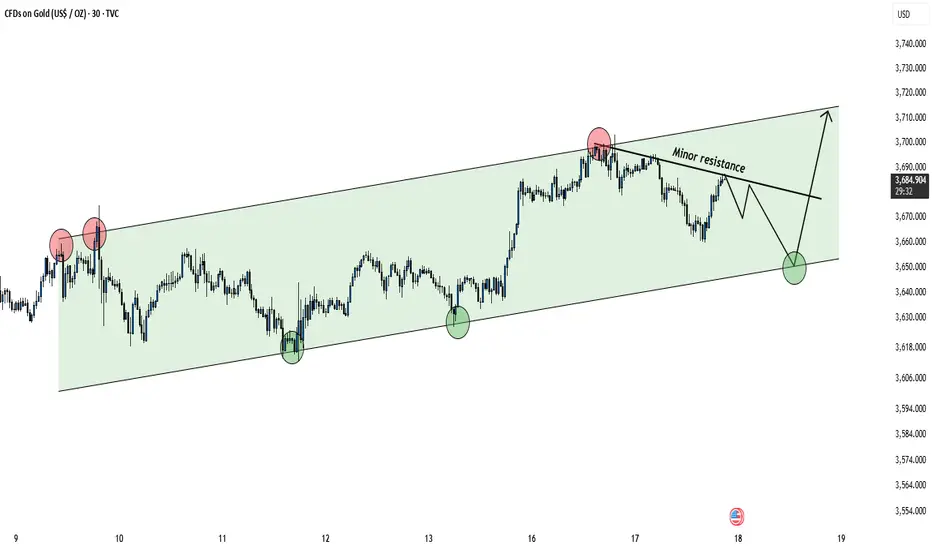
Gold is currently moving inside a well-defined ascending channel on the 30-min chart. Both buyers and sellers are respecting the levels of this channel, giving us clear trading opportunities.
Key Observations
Price has tested the upper channel resistance multiple times, facing rejection near $3,710–$3,720.
The lower channel support around $3,650 has been well respected, creating strong buying reactions.
A minor resistance trendline is now forming, which could temporarily limit upside momentum.
Short-term path suggests: rejection from minor resistance → retest of channel bottom → potential bounce back toward the upper channel.
Trading Plan
Bullish bias remains intact as long as Gold holds above $3,650 channel support.
A bounce from support may target $3,710–$3,720 zone again.
If support breaks, deeper correction may follow.
Rahul’s Tip
Always wait for confirmation near channel edges. Trading inside the channel can be tricky, but respecting support and resistance gives you high-probability setups.
Disclaimer: This analysis is for educational purposes only and should not be taken as financial advice. Please do your own research or consult your financial advisor before investing.
Analysis By @TraderRahulPal (TradingView Moderator) | More analysis & educational content on my profile
👉 If you found this helpful, don’t forget to like and follow for regular updates.
Gold Trading Strategy | September 18-19🎉 Congratulations to our members who followed our trading strategy - today's trades yielded a profit of over 300++ pips!
✅ Based on the 4-hour chart, gold formed a phase top at 3707 and has since pulled back in a consolidation.
The moving averages MA5 and MA10 have crossed downward, while MA20 near 3670 is acting as resistance.
The short- to medium-term trend shows weakening bullish momentum with bears gradually taking control. The Bollinger Bands’ midline is around 3670, and the price has broken below it, now moving near the lower band, indicating weakness. If it cannot quickly reclaim the midline, the trend is likely to remain bearish.
Currently, gold is trading in the 3640–3650 range. If this zone breaks, the price may further test the 3625–3630 support. A break below 3625–3630 would open more downside potential, with the next target around 3600.
🔴 Resistance levels: 3660–3670
🟢 Support levels: 3640–3630
✅ Trading Strategy Reference:
🔰 If the price rebounds to 3660–3670 and faces resistance, consider light short positions with targets at 3630–3625.
🔰 If the price drops to around 3625 and stabilizes, short-term long positions can be considered, targeting 3655–3660.
🔥Trading Reminder: Trading strategies are time-sensitive, and market conditions can change rapidly. Please adjust your trading plan based on real-time market conditions. If you have any questions , feel free to contact me🤝

FED slows down: Cuts 25bps, gold stays flat🟡 XAU/USD – 18/09 | Captain Vincent ⚓
🔎 Captain’s Log – News Context
FED : Cut rates by 25bps as expected, hinted at 2 more cuts this year → initially supported Gold to rebound around 3,65x.
Powell turned hawkish :
• “No need to move quickly on rate cuts.”
• “Today’s cut is mainly risk-management.”
This message signaled that the FED is not fully opening the easing door → Gold fluctuated and stalled its upside momentum.
Tonight: Awaiting Jobless Claims & Philly Fed for more clarity on the FED’s path.
⏩ Captain’s Summary
Gold is supported by the rate cut, but Powell’s “braking” caused volatility.
Zone 3,663 – 3,665 has become the pivot support to determine the next move.
📈 Captain’s Chart – Technical Analysis
Storm Breaker (Resistance / Sell Zone)
3,684 – 3,686 (strong OB)
3,717 – 3,719 (ATH Zone – very strong, likely heavy selling)
Golden Harbor (Support / Buy Zone)
Pivot Dock: 3,663 – 3,665 (new pivot support)
Main Harbor: 3,629 – 3,630 (BoS confluence & old sideway)
Market Structure
After breakout and profit-taking, Gold returned to test support.
3,663 – 3,665 : pivot support.
• If it holds → rebound to 3,684 – 3,717.
• If it breaks → deeper correction to 3,629.
🎯 Captain’s Map – Trade Plan
✅ Buy (priority)
Buy Zone 1
Entry: 3,663 – 3,666
SL: 3,655
TP: 3,684 – 3,717
Buy Zone 2
Entry: 3,629 – 3,630
SL: 3,618
TP: 3,663 – 3,684 – 3,717
⚡ Sell (only at resistance)
Sell Zone OB
Entry: 3,684 – 3,686
SL: 3,695
TP: 3,665 – 3,645
Sell Zone ATH NEW
Entry: 3,717 – 3,719
SL: 3,727
TP: 3,706 – 3,690 – 3,675
⚓ Captain’s Note
“The Golden sails caught wind as the FED cut rates, but Powell’s headwind slowed the advance. Golden Harbor 🏝️ (3,663 – 3,629) is the pivot dock to decide the next course. If it holds, the ship may rebound to test Storm Breaker 🌊 (3,684 – 3,719) . If it breaks, the ship will retreat deeper to gather strength. For now, Quick Boarding 🚤 should only be done at strong resistance, while the larger voyage still leans northward.”

Gold Breaking Limits – Trend Speaks for ItselfGold Breaking Limits – Trend Speaks for Itself
Gold Market Outlook
Gold continues to demonstrate a well-structured bullish cycle, characterized by steady momentum and clean trend development. The market has transitioned from a prolonged consolidation phase into a sustained directional move, where each breakout is validated by controlled retracements. This reflects strong participation and confidence from larger players.
The sequence of market shifts and break-of-structure signals highlight how short-term pullbacks are consistently absorbed, turning into fuel for further expansion. Price action is orderly, with no signs of erratic volatility, showing that buyers remain in control and liquidity is being managed efficiently.
Overall, gold is moving in line with the broader macro sentiment. The rhythm of accumulation, expansion, and continuation suggests that the current cycle has not yet exhausted its potential. While interim pauses are expected, the structural integrity of the trend continues to favor upside development over the medium term.

Strategic Long-Term Perspective on GoldGold Market Analysis – Report View
Gold has delivered a strong bullish cycle after weeks of accumulation. The past phase showed a contracting range where liquidity was built up and multiple structural shifts occurred, signaling preparation for expansion. Once price broke out of that range in late August, momentum accelerated, leading to a clean and sustained rally into September.
The recent move highlights how market flow continues to favor the upside, with each correction acting as a re-accumulation zone rather than a trend reversal. Institutional order flow remains visible, supporting higher valuations as price respects bullish market structure.
Currently, gold is stabilizing after the sharp leg upward. This pause suggests a phase of healthy consolidation, likely absorbing liquidity before attempting the next impulsive wave higher. Overall sentiment remains constructive, with bullish continuation the dominant narrative unless a major structural shift occurs.

Book 2 trades 1:4 Each in Gold. Took 2 trades in Gold, went legit very smooth & clean. Loved every second.
Good luck for tomorrow bois!!

XAUUSD - 18/09/2025 - Tp Hit 1. Price broke support during London session
2. Expected price to retrace ( pullback ) during Pre NY
3. Resistance confirmed during Ny session
4. once price broke the newly formed support and closed below it ,
expected fall
5. NYSE open volume push happened

Gold’s Next Bullish Move: Key Buy Zones & Targets to Watch Today🔥 Gold (XAUUSD) Bullish Momentum Alert! 🔥
After a strong rally, Gold bounced back impressively from today’s low at 3633 and is pushing up towards 3673. For intraday traders, the setup is clear: look for dips to jump in on the long side around 3654 - 3646 with exciting upside targets ahead!
📈 Trade Setup – Long on Pullback
Entry: Buy Gold at 3654
Add-on Dip: Add more at 3646
Targets: First target 3670-3675, then aiming for 3685
Invalidation: Cut losses if price falls below 3630
📊 Risk/Reward Snapshot
This is a tight-risk, high-reward setup — perfect for traders who want to keep their stops close while chasing solid gains. As always, manage your risk wisely and size your positions according to your plan.
Do you see the same bullish opportunity?
👍 Drop a like if you’re in!
💬 Share your thoughts or questions below — let’s build a sharp, winning community together!
Your feedback fuels us and keeps everyone trading smarter. Let’s make those pips! 🚀
Happy Trading,
– The InvestPro Team

Gold 1H – Retail Sales Impact Before FedOn the 1H chart, Gold is holding near 3,682 after showing a clear Break of Structure. Liquidity is now seen both above the premium resistance at 3,700 and below the Fair Value Gap demand around 3,669–3,667. With U.S. Retail Sales data due at 19:30 IST today, intraday volatility is expected, but overall positioning is still cautious ahead of the Federal Reserve’s interest rate decision later this week. Traders can look for liquidity sweeps towards premium levels before retracements into demand zones.
________________________________________
📌 Key Structure & Liquidity Zones (1H):
• 🔴 SELL ZONE 3,700 – 3,698 (SL 3,707): Premium resistance likely to trigger rejection towards 3,690 → 3,680 → 3,670.
• 🟢 FVG BUY ZONE 3,669 – 3,667 (SL 3,660): Fair Value Gap demand zone for retracements, targeting 3,680 → 3,690 → 3,700+.
• 🟢 BUY SUPPORT 3,641 – 3,639 (SL 3,632): Deep discount support, targeting 3,655 → 3,670 → 3,685+.
________________________________________
📊 Trading Ideas (Scenario-Based):
🔺 Buy Setup – FVG Reclaim (3,669–3,667)
• Entry: 3,669 – 3,667
• Stop Loss: 3,660
• Targets:
TP1: 3,680
TP2: 3,690
TP3: 3,700+
👉 Look for a liquidity sweep into the FVG zone before New York session begins.
🔺 Buy Setup – Discount Sweep (3,641–3,639)
• Entry: 3,641 – 3,639
• Stop Loss: 3,632
• Targets:
TP1: 3,655
TP2: 3,670
TP3: 3,685+
👉 A good risk-to-reward opportunity if price sweeps stops below structure before Retail Sales release.
🔻 Sell Setup – Premium Liquidity Run (3,700–3,698)
• Entry: 3,700 – 3,698
• Stop Loss: 3,707
• Targets:
TP1: 3,690
TP2: 3,680
TP3: 3,670
👉 Expect engineered stop-runs into premium supply before fading lower.
________________________________________
🔑 Strategy Note
While Retail Sales data may bring short-term price swings, market attention is focused on the Fed. Smart Money is likely to trap both sides of liquidity: fading premium near 3,700–3,698 while accumulating buys at 3,669–3,667 and 3,641–3,639. Trade with smaller positions and confirm with H1 closes before entries.

NATURAL GAS HARMONIC PATTERN
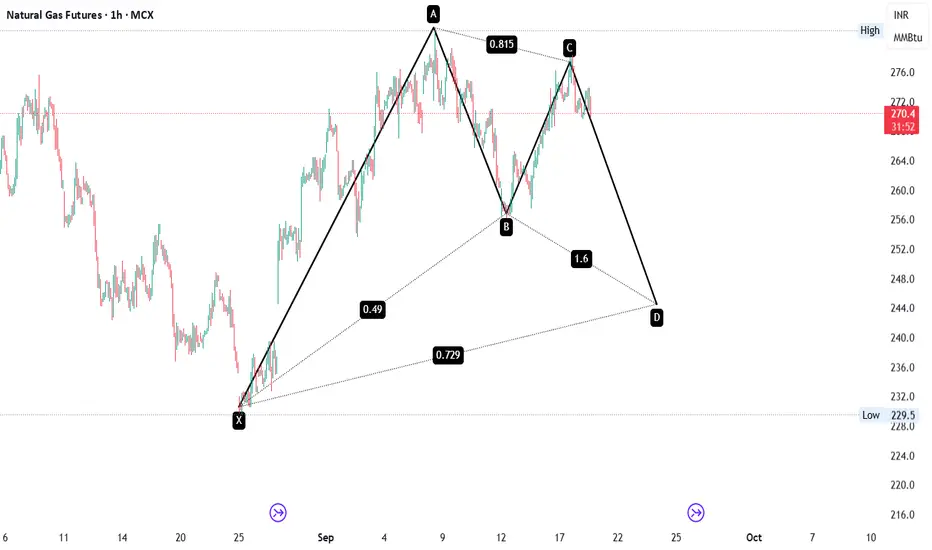
📈 Chart Pattern: Bearish Harmonic (Possibly Bearish Bat or Gartley Variant)
⚠️ Price Structure Breakdown:
A clean XABCD Harmonic Pattern is visible on the 1H timeframe:
🔹 XA Leg: Sharp impulsive rally from ₹229 → ₹281
🔹 AB Leg: Pullback retraced 49% of XA
🔹 BC Leg: Strong recovery to 81.5% of AB
🔹 CD Projection: 1.6x extension of BC, projecting a potential D point near ₹244–248 zone
📌 Key Technical Highlights:
✅ Pattern in play: Bearish harmonic indicating upcoming correction phase
🧲 D target zone aligns with previous demand cluster from late August
🔄 Ideal reversal zone between ₹244–248 (Watch for price-action confirmation near D)
🎯 Possible Trade Setup (Anticipated Post Completion at Point D):
📉 Sell NG Futures near ₹244–248 (on reversal confirmation)
🎯 Targets: ₹234 → ₹229
🛑 SL: Above ₹251 (on closing basis)
🧠 Why This Matters:
Harmonic patterns like this, especially with clean Fibonacci alignment, often mark high-probability reversal zones. Combined with volume + divergence filters, this zone could provide a lucrative swing trade setup.
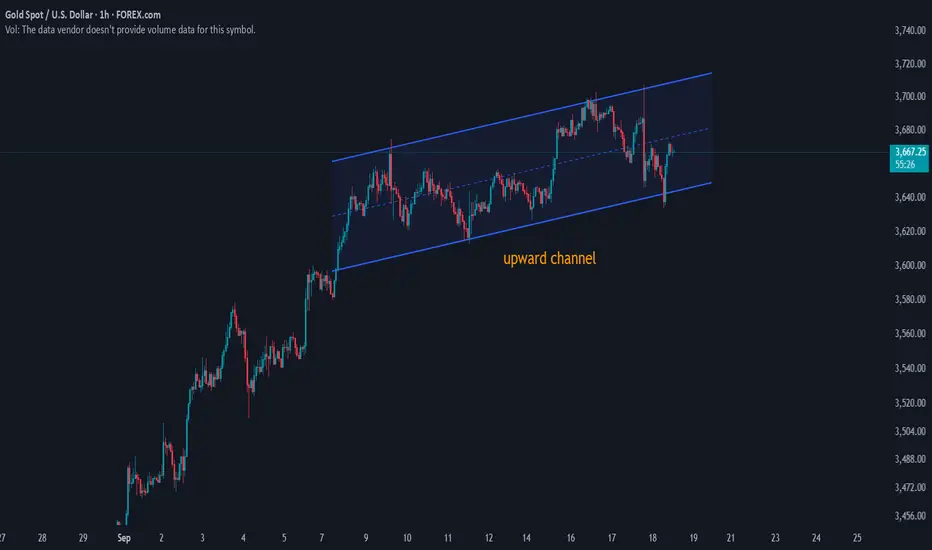
Gold Rebounds Within Upward Channel – Eyes on $3,700+Gold (XAUUSD) is holding inside its upward channel on the 1H timeframe, bouncing strongly off the lower boundary near $3,640. The bullish structure remains intact as long as price respects channel support, keeping $3,700+ in play.
Technical Setup:
Price continues to trend within a rising channel since early September.
The recent dip tested the lower band near $3,640, where buyers stepped back in.
Current price action shows momentum building toward the channel midpoint (~$3,680).
A decisive breakout above $3,685–3,700 could trigger further upside toward $3,720–3,740.
Key Levels to Watch:
Support: $3,640, $3,610, $3,600
Resistance: $3,685, $3,700, $3,720–3,740
Takeaway:
Gold’s trend remains bullish while holding above $3,640. A push above $3,700 confirms bullish continuation toward $3,720–3,740. A close below $3,640 shifts bias bearish toward $3,600.
#Gold #XAUUSD #Commodities #TradingStrategy
XAUUSD/GOLD Unemployment Claims 18.09.25XAUUSD/Gold – Unemployment Claims (18.09.25):
Current Price Zone: Gold is trading around $3,668.81.
Trading Idea: The chart suggests a buying opportunity if the U.S. unemployment claims data comes out negative (worse than expected).
Key Levels:
Major Resistance R1 → Around $3,685 – $3,690
Breakout and retest of this level signals a buy entry.
Resistance 2 – Yesterday’s High & News High → Around $3,710
Acts as the next upside target after breakout.
Resistance 3 – Expected New ATH → Around $3,736 – $3,740
This is the final bullish target if momentum sustains.
Strategy:
Plan A (Main Setup):
Wait for breakout above R1 (3,690) → Enter buy trade on retest.
Ride the move towards R2 (3,710) and possibly R3 (3,736–3,740).
Confirmation Zone:
If news is negative for USD, gold is expected to rally strongly (bullish bias).
Risk Management:
Stop Loss (SL): Below 3,680 zone, as marked in the red area.
Take Profit (TP): Stepwise at 3,710 → 3,736 → 3,740.
👉 In summary: The chart indicates a news-driven bullish breakout plan — gold buys are favored if the data weakens the USD, with targets up to 3,740.

LONG XAUUSD📌 Trade Idea
Entry: Above 3675
Target: 3705
Potential Gain: 30 points (3705 – 3675)
Stop Loss (suggested): 3659
R:R- 1:2

XAUUSD/GOLD 1H BUY PROJECTION – 18.09.25The 1-hour chart of Gold shows a recent V pattern formation, signaling a strong bullish reversal after a sharp drop.
A downtrend breakout is confirmed, supported by a Three White Soldiers pattern, strengthening the bullish momentum.
Entry Zone: Around 3,668 (current price).
Support (S1): 3,655 – strong demand zone where buyers are likely to defend.
Resistance (R1): 3,685 – key target level for this bullish move.
Risk-to-Reward Setup: Stop-loss below support (S1) at 3,655, with take-profit at resistance (R1) near 3,685.
🔑 Conclusion: Gold (XAUUSD) is showing bullish signs with breakout confirmation. As long as price holds above support at 3,655, the projection favors upside movement towards 3,685.

“XAU/USD 1H – Bullish Continuation from Demand Zone Key Observations:
Uptrend Structure:
Price has been consistently making Higher Highs (HH) and Higher Lows (HL), confirming an overall bullish market structure.
Break of Structure (BOS) levels confirm continuation of the trend.
Market Structure Shift (MSS):
Recently, price created a short-term shift downward (MSS) but retraced into a POI zone (demand area) near 3,646 – 3,659.
Current Setup:
The price bounced from the POI zone and is now recovering upward.
A long position was marked with entry near 3,659, Stop Loss at 3,646, and Target around 3,709.
Bias:
As long as price holds above 3,646 (POI zone), bullish continuation is favored.
If broken below 3,646, bearish correction could extend further.

BANKNIFTY FUTURE TRG 55584Banknifty Futures Bullish above 54385 for Trg 55584. Exit if closes below previous day low on trailing basis. Imp Date 15th Sept Mark H/L
Trgs are derived from Time & Angles.
Chk for updates.
