Wheat Analysis – Opportunity DevelopingHi Everyone,
Today, an interesting setup is forming on the wheat market.
On the daily timeframe, price is making a third pullback on the bearish trendline, following two previous retests clearly visible on the chart.
Historically, a third pullback on this type of structure significantly increases the probability of a bearish reversal.
📉 Primary scenario: bearish movement expected in the coming days
🎯 Target price: 500
Futures market

Silver Weekly EW counting As per EW counting, Silver looks like completed W3/3 .. Today gap up once get closed will confirm exhaustion Gap...

A quick scalp in gold It's a clear againt the trend tred but candle closing below 20 ena in 5 min and also it might go down to hunt some liquidity. Let's hope for the best
Elliott Wave Analysis XAUUSD – Week 1 of December 20251. Momentum
W1 – Weekly Timeframe
Weekly momentum is currently turning upward, exactly as warned last week: if weekly momentum continues to rise strongly, the market may enter a bullish phase lasting 4–5 weeks.
However, the candlestick structure still shows short, overlapping candles, which do not yet reflect a clear long-term uptrend. Therefore, we need to continue monitoring closely.
D1 – Daily Timeframe
Daily momentum remains compressed in the overbought zone, indicating a potential reversal on the daily chart in the coming week.
H4 – 4-Hour Timeframe
H4 momentum is currently rising, suggesting that early in the Asian session on Monday the market may continue with another upward move or remain in a sideways structure.
________________________________________
2. Wave Structure
W1 – Weekly Timeframe
On the weekly chart, the main focus remains on weekly momentum:
• If weekly momentum pushes decisively into the overbought zone and price breaks the 4,396 high, the current corrective structure may be considered complete, and the market could begin yellow wave 5.
• The initial upside target in this scenario would be the 4,592 region.
However, weekly candles still do not support a long-term bullish view, as they lack a pattern of higher highs and higher lows and instead show overlapping behavior.
Therefore, for now, we prioritize monitoring the wave structure and momentum on D1.
________________________________________
D1 – Daily Timeframe
The strong rally on Friday pushed the price higher, threatening the red 1–2–3–4–5 count.
However, to fully invalidate this structure, price must reach or exceed 4,245.
→ Therefore, at this moment, the red 1–2–3–4–5 wave count remains valid.
If price breaks above 4,245, it suggests that purple wave X is still unfolding, forming a W–X–Y Flat correction in purple, with wave Y potentially ending near the previous wave X bottom.
If price breaks strongly above the orange wave 3 high (4,383), the market will enter orange wave 5, and given the nature of commodities—where wave 5 often extends—targets could exceed 4,592.
________________________________________
H4 – 4-Hour Timeframe
Since the red 1–2–3–4–5 count has not been invalidated, we continue to follow this plan.
On the H4 chart:
• Price is currently inside blue wave 5, which itself belongs to black wave 5 of blue wave C.
• Black wave 5 shows a five-wave internal structure in blue, but with overlapping price action, suggesting a possible ending diagonal formation for black wave 5.
If this is indeed an ending diagonal, the market should experience a sharp decline to confirm the pattern.
Key confirmation signals to watch on Monday:
• A H4 candle closing below 4,184
• Ideally, a stronger close below 4,158
If these conditions appear, we will prioritize breakout trading around:
• 4,184
• 4,158
I will provide a detailed update once we have real market data early next week.

Massive Commodity Profits1. The Nature of Commodities: Volatility Breeds Opportunity
Commodities are essential goods with relatively inelastic demand. People still need fuel, food, and metals regardless of price fluctuations. However, supply is far more unstable. Weather conditions, mining delays, geopolitical tensions, shipping bottlenecks, and regulatory changes can all reduce availability overnight. When supply tightens against steady or rising demand, prices can spike dramatically.
For example:
A drought in Brazil can send coffee futures surging.
Tensions in the Middle East can push crude oil prices upward.
A mining strike in Peru may cause copper prices to rally.
This structural instability is what makes the commodity market capable of delivering massive profits in short periods.
2. Demand Cycles and Economic Trends
Massive commodity profits also emerge during strong global macroeconomic cycles. When economies expand, they consume more energy, metals, and agricultural products. Industrial expansion in countries like China, India, and the U.S. has historically led to major commodity supercycles.
For instance, China’s industrial boom (2000–2013) sent prices of iron ore, copper, and oil to record highs. Traders who recognized the multi-year demand trend and positioned early captured enormous profits. These long-cycle rallies happen roughly every 10–15 years and often create fortunes for large funds and early participants.
3. Supply Shocks: The Fastest Profit Drivers
The biggest and quickest commodity profits typically arise from supply shocks—unexpected events that disrupt production. A single headline can trigger a wave of volatility.
Common supply shock triggers include:
Wars or geopolitical conflict (oil, natural gas)
Extreme weather (wheat, corn, soybeans)
Export bans (rice, sugar, palm oil)
Mining accidents or strikes (copper, nickel, gold)
Because supply shocks occur unexpectedly, prices often move before retail traders even react. Institutions and professional traders who monitor real-time logistics, shipping data, and political events can capitalize on these early movements.
4. Inflation: A Powerful Catalyst for Commodity Surges
Inflation is another core driver of massive commodity profits. When currencies lose value, real assets—especially commodities—rise to preserve purchasing power. Gold and silver are classic hedges, but even energy and food commodities benefit from inflation cycles.
During inflationary shocks:
Crude oil rallies due to cost-push pressures.
Agricultural commodities rise as farming inputs become more expensive.
Industrial metals climb as production costs rise.
Traders who understand the macroeconomic environment anticipate these moves and position accordingly, often using futures or long-dated options for leverage.
5. Futures and Options: The Engines of High Profit Potential
Massive commodity profits often come from futures markets, where traders use small margins to control large contract sizes.
Why futures create big profits:
High leverage means small price moves generate large percentage gains.
Futures prices react faster than spot markets.
Liquidity allows rapid entry and exit.
Global participation increases volatility and opportunity.
Options add an additional profit dimension:
Buying calls during bullish commodity cycles can multiply capital several times.
Selling options during high-volatility spikes generates income for advanced traders.
Spreads allow directional and neutral strategies with controlled risk.
Professional traders often combine futures, options, and spot positions to maximize returns.
6. Algorithmic Models: Profit From Micro-Volatility
Modern commodity markets are heavily influenced by algorithmic and high-frequency trading (HFT). Algorithms exploit micro-movements in futures markets, such as:
Order flow imbalances
Spread arbitrage
Statistical mean reversion
Volume spikes
Institutional block orders
While these strategies may seem small in isolation, their compounded results can produce significant profits, especially during volatile periods like harvest seasons, geopolitical uncertainty, or inventory report releases.
7. The Role of Fundamental Reports in Profit Opportunities
Commodity markets are deeply influenced by high-impact reports. For example:
USDA reports move agricultural markets.
OPEC announcements shake oil markets.
EIA crude inventory data impacts short-term energy prices.
LME warehouse stocks influence metals.
Traders who deeply understand these reports know how to interpret supply estimates, production forecasts, and consumption trends. This anticipatory edge often creates large profit opportunities before the broader market reacts.
8. Supercycles: The Biggest Profit Windows
A commodity supercycle is a long-term period of rising prices driven by structural global changes. Past supercycles have been triggered by:
Global industrialization
Technological revolutions
Decarbonization and renewable energy demand
Infrastructure expansion in emerging markets
During supercycles, prices can rise for 5–15 years, creating the largest profits in commodity trading. Investors in gold during the 1970s, oil in the 2000s, and lithium between 2018–2022 saw exponential returns. Commodity supercycles often reshape entire economies.
9. Risk Management: Protecting Massive Profits
Massive profits are only meaningful if protected. Commodity markets can reverse violently due to announcements, policy changes, or macroeconomic developments. Smart traders use:
Hedging with futures
Position sizing
Stop-loss and trailing stops
Diversification across sectors (energy, agri, metals)
Options for protection (protective puts)
Risk control ensures that large profits are not wiped out by sudden counter-moves.
10. Psychology: Mastering Volatility
The final ingredient in generating massive commodity profits is trader psychology. Commodity markets are emotional. Greed, fear, and panic accelerate volatility. Traders who remain disciplined, patient, and analytical tend to outperform.
Key psychological traits of profit-making commodity traders include:
Patience in waiting for setups
Speed in execution
Ability to endure volatility
Emotional neutrality
Long-term vision during supercycles
Mindset is often the difference between consistent profits and emotional decisions.
Conclusion
Massive commodity profits arise from the unique nature of global supply and demand, geopolitical tensions, inflation, natural events, and human psychology. Commodities offer some of the most volatile and opportunity-rich markets in the world. By understanding macroeconomic drivers, supply-chain dynamics, fundamental reports, futures strategies, and disciplined risk management, traders can position themselves to capture extraordinary profits during both short-term shocks and long-term supercycles.
Market Swings and Interest Rates–Inflation Dynamics1. What Are Market Swings?
Market swings refer to rapid or significant changes in asset prices—either upward (rallies) or downward (corrections). These swings reflect shifts in sentiment, liquidity, macroeconomic conditions, and expectations for future growth. Markets don’t move in straight lines; instead, they react continuously to new information, especially related to interest rates and inflation.
Causes of Market Swings
Economic Data Releases
Inflation reports, GDP numbers, unemployment data, and consumer spending directly influence investor expectations.
Central Bank Decisions
Changes in interest rates or monetary policy guidance drive sharp reactions across asset classes.
Geopolitical Events
Wars, trade conflicts, sanctions, and political instability often trigger sudden risk-off movements.
Corporate Earnings
Better-than-expected profits cause upward swings, while weak results trigger sell-offs.
Global Liquidity Conditions
Tight liquidity increases volatility; easy liquidity fuels risk taking.
Investor Psychology
Fear, greed, herd behavior, and algorithmic trading amplify swings.
Market swings become more intense when inflation becomes unpredictable or interest rates change sharply, because these two variables determine the cost of money and purchasing power.
2. Inflation: The Root Variable
Inflation is the rate at which the general price level of goods and services rises. Moderate inflation indicates healthy demand in an economy. Excessive inflation, however, erodes purchasing power, compresses profit margins, and destabilizes savings and investment.
Types of Inflation
Demand-pull inflation: When aggregate demand outpaces supply.
Cost-push inflation: When production costs (energy, wages, commodities) rise.
Built-in inflation: Wage-price spirals where higher prices lead to demands for higher wages.
Why Inflation Matters for Markets
Inflation directly influences:
Corporate profits: Higher raw material and wage costs reduce margins.
Consumer behavior: Purchasing slowdowns hurt sectors like retail, automotive, and housing.
Bond yields: Investors demand higher returns for inflation-eroded value.
Currency value: High inflation weakens the currency relative to trading partners.
Asset valuation: Higher inflation reduces present value of future cash flows.
Inflation affects every sector differently. For instance, banks may benefit from higher interest margins, but real estate might slow down as borrowing becomes expensive.
3. Interest Rates: The Policy Lever
Interest rates—primarily influenced by central banks—represent the cost of borrowing money. They are the most powerful tool used to control inflation, regulate liquidity, and stabilize financial systems.
How Central Banks Use Interest Rates
When inflation rises: Central banks increase interest rates to cool consumption and credit growth.
When economic growth slows: They cut interest rates to stimulate borrowing and investment.
Impact of Interest Rate Movements on Markets
Equity Markets:
Rising rates reduce corporate earnings and lower stock valuations.
Lower rates boost profits, lending, investment, and stock market rallies.
Bond Markets:
Bond prices fall when interest rates rise.
They rise when interest rates fall.
Currency Markets:
Higher interest rates attract foreign capital, strengthening the currency.
Lower rates weaken the currency.
Commodity Markets:
Higher rates usually push commodities down due to stronger currency and weaker demand.
Lower rates boost commodities like gold and crude oil.
Interest rates are the bridge between inflation and market swings: when they rise rapidly, volatility spikes across global markets.
4. The Relationship Between Interest Rates and Inflation
Interest rates and inflation are strongly interconnected:
When Inflation Rises
Central banks raise rates.
Borrowing becomes expensive.
Consumption slows.
Investment reduces.
Inflation gradually falls.
Markets often correct due to tightening liquidity.
When Inflation Falls
Central banks cut rates.
Loans become cheaper.
Business investment grows.
Consumer spending increases.
Economic activity expands.
Markets rally.
This push-and-pull relationship keeps the economy balanced. But when inflation rises too quickly, central banks hike rates aggressively, causing sharp market swings.
5. How Inflation and Interest Rates Create Market Swings
A. Sudden Inflation Surges
When inflation rises faster than expected:
Bond yields jump.
Stock markets decline due to fear of rate hikes.
Growth stocks suffer more because future earnings become less valuable.
Commodity markets become volatile.
Currency markets react abruptly.
Example:
A spike in oil prices can raise inflation suddenly, forcing central banks to tighten policy sooner than expected.
B. Aggressive Rate Hikes
Rapid rate hikes lead to:
Liquidity shortages
Corporate borrowing stress
Sell-offs in equity markets
Currency appreciation
Bond yield inversion
Most market crashes historically have been linked to sharp tightening cycles, where rising rates choke liquidity.
C. Rate Cuts After High Inflation
When inflation cools and rates fall:
Markets rally strongly.
Growth and tech stocks lead recoveries.
Housing and auto sectors revive.
Emerging markets attract foreign capital.
Investors reposition from defensive assets (like bonds and gold) to riskier assets.
6. Sector-Wise Impact of Rate and Inflation Movements
1. Banking & Financials
Benefit from moderate rate hikes (higher interest margins).
Get hurt during extreme hikes (loan defaults rise).
2. Technology & Growth Stocks
Highly sensitive to rising interest rates (high future earnings valuation).
3. Real Estate & Infrastructure
Dependent on borrowing; rate hikes reduce demand sharply.
4. FMCG & Consumer Goods
Damaged by high inflation (cost pressures)
Recover with falling inflation
5. Metals, Oil & Commodities
Move with inflation trends
Benefit from low interest rates and strong demand cycles
7. Psychological and Liquidity Effects
Markets are not driven only by numbers—sentiment and liquidity play major roles. Rising inflation creates uncertainty; investors fear erosion of purchasing power. Rate hikes reduce liquidity; lower liquidity increases volatility. Algorithms and institutional money amplify moves, making swings sharper.
When inflation stabilizes and liquidity improves, investor confidence returns, reducing volatility.
8. Final Thoughts
Market swings are natural outcomes of changing economic conditions. Inflation and interest rates act as the core variables that shape the direction, magnitude, and speed of these swings. Investors who understand this relationship can anticipate major turning points, position portfolios wisely, and avoid panic during volatile periods. In a world where economic conditions shift rapidly, understanding the dynamics between inflation, interest rates, and market behavior becomes essential for long-term investment success.
GOLD preparing for a big move. gold is trading in close consolidation range. wait for a break out or break down with price action for entry.

gold spot update after breakoutgold spot given major breakout now have to see support 4160$ for any down correction. all eyes on fomc rate cut or not!! if gold spot stya abv 4225 than mkt looks big up side 4280--4345$ very soon .
trading ideas--- if market come down than buy only with support sl or relax for big tgt if any change in fomc rate cut than will cause to sudden down fall.
mcx gold--gold hold above 130000 than no worry for bulls for short term soon tgt 131--132k than afer may be some correction than after again 137k+++++ only close blow 130000 for 2days than down side expect 129300-128500--128000++++

TRADING PLAN XAUUSD 12/1/2025🔔 Hello everyone!
Let’s take a quick look at today’s market context and the trading plan for gold (XAUUSD).
📌 1. Market Context & Fundamentals
Gold has broken above the previous descending trendline and is maintaining a bullish structure on the H4 timeframe.
Bullish momentum is supported by several macro factors:
Expectations of a Fed rate cut in December.
Geopolitical tensions between the U.S. and Venezuela, as well as rising friction between Japan and China, which increases safe-haven demand.
Price may move sideways/pin during the session before continuing its broader uptrend.
2. Main Trading Idea: BUY BIAS
✅ Key BUY Zones
4190 – 4194
4150 – 4153
4105 – 4110 (deeper zone)
Nearest zone: 4210 – 4215
➡️ Each entry targets approximately 100 pips
3. Short-term SELL Reaction Zones (Scalping Only)
4250 – 4256 (recent high)
4294 – 4295
4300
4312 – 4315
➡️ Sell setups are only for quick scalps, not for holding long. Target ~100 pips
4. Expected Price Scenarios
If price pulls back to support → look for BUY setups aligned with the trend.
If price reaches strong resistance → only scalp SELL setups, avoid long holding.
Overall trend remains bullish, so BUY remains the primary strategy.
Summary
H4 Trend: Bullish
Trading Bias: Mainly BUY – SELL only at key resistance for scalps
Macro & geopolitical environment is supportive for gold upside.

XAU/USD: Buy Gold at 4,217 or FVG 4,182!📊 Market Structure
Gold continues to maintain a strong upward structure after creating a series of BoS continuously from the 4,156 USD region.
This morning's H1 breakout pushed the price above the short-term peak, confirming that the BUY side is in full control.
The price is currently returning to retest the Demand intraday 4,217 – 4,210 USD area — this is the first support area where buyers can continue to push the upward wave.
If the pullback is deeper, gold may reach the FVG 4,182 – 4,172 USD area, coinciding with fibo 0.5 – 0.618 → the most attractive discount area in this wave.
The main trend remains bullish as long as the price stays above:
• 4,217 – Demand 1
• 4,182 – FVG Discount
• 4,156 – Key Demand Zone
💎 Key Technical Zones
• Demand Zone 1: 4,217 – 4,210
• FVG Discount: 4,182 – 4,172
• Strong Demand (structure holding bottom): 4,156
• Target Zones:
– 4,285
– 4,309
– 4,321
– 4,342
– 4,369 (liquidity above peak)
🎯 Trading Plan – Prioritize BUY
1️⃣ BUY 1 – Retest Demand 4,217
When the price touches 4,217 – 4,210 with confirmation signals (long wick, H1 engulfing).
• Entry: 4,217 – 4,210
• SL: below 4,200
• TP1: 4,285
• TP2: 4,309
• TP3: 4,342
• TP4: 4,369
→ Quick setup – follow the momentum.
2️⃣ BUY 2 – Deep Pullback to FVG 4,182
In case the price shakes strongly before continuing to push the wave.
• Entry: 4,182 – 4,172
• SL: below 4,156
• TP: 4,217 → 4,285 → 4,342
→ This is the “best” price area to accumulate BUY in the session.
🧠 Vincent’s View
H1 shows a strong upward structure, clear momentum. The current adjustment is just a technical pullback before hitting the upper liquidity levels.
As long as gold stays above 4,182 – the trend remains bullish and the targets 4,285 – 4,342 are entirely feasible.
“Smart money buys the dip — not the hype.” ⚜️
⏰ Timeframe: 1H
📅 Updated: 01/12/2025
✍️ Analysis by: Captain Vincent

XAUUSD – Early-week continuation buys, targeting Fibonacci ...✨ XAUUSD – Early-week continuation buys, targeting Fibonacci extension zones
Gold enters the new week under a very special market backdrop:
+6.0% in November, marking the 4th consecutive bullish month.
This follows +3.7% in October and +11.9% in September.
Year-to-date, gold is up about 60.7%, on track to record its strongest yearly gain in nearly five decades.
With a market that is literally making history, I am not trying to pick the top. I continue to prioritise trend-following buys, and only consider quick counter-trend sells at extended Fibonacci levels.
🎯 Scenario 1 – BUY THE DIP in line with the bullish trend
Buy: 4,194 – 4,195
SL: 4,185
TP: 4,210 – 4,235 – 4,270 – 4,295
The 4,194–4,195 zone on H1 is the VAL / lower boundary of the volume distribution after a strong impulsive move. It aligns with short-term structural support. If price pulls back cleanly into this area and forms a solid rejection candle, I prefer adding BUY positions with the prevailing trend.
Take-profit structure:
4,210 – 4,235: Near-term resistance zone, also around the 1.618 Fibonacci extension.
4,270 – 4,295: Major extension zone 2.618 Fibo, where selling pressure and short-term reversals may become stronger.
🔁 Scenario 2 – Short-term SELL at Fibo 2.618 extension
Sell: 4,285 – 4,287
SL: 4,295
TP: 4,262 – 4,240 – 4,210
This is a counter-trend setup, suitable only for small-lot scalping trades.
If price is pushed into the 4,285–4,287 region (near the 2.618 Fibo extension) but fails to sustain momentum—leaving long wicks or clear bearish reversal signals—I will consider SELLing back toward 4.26x – 4.24x, and deeper to 4.210.
1. Technical View from the Charts
The trend on H1/H4 remains strongly bullish, with higher highs and higher lows, and price respecting the upward channel.
The latest impulse has already extended above the 1.618 Fibo, now targeting the 2.618 extension around 4.28x–4.29x.
Below, VAL around 4.19x is the first support; deeper lies sell-side liquidity near 4.16x, where many buy-side stops are clustered (only relevant for deeper intraday corrections).
Given this structure, every pullback into support is treated as a trend-continuation opportunity, not a reversal signal.
2. Market Sentiment & Action Plan
After months of strong gains, the market is showing clear FOMO behaviour. This is why I avoid buying directly at resistance and instead wait for price to return to accepted value zones (VAL/POC) for better risk-to-reward entries.
The SELL setup is only a secondary scenario, triggered when price reaches a high Fibo extension and fails—usually leading to heavy profit-taking from earlier buyers.
✅ My Trading Plan
Primary Setup
BUY 4,194–4,195
SL 4,185
TP 4,210 – 4,235 – 4,270 – 4,295
Secondary Setup
SELL 4,285–4,287 (only with a clean bearish reversal signal)
SL 4,295
TP 4,262 – 4,240 – 4,210
Risk per scenario remains capped at 1–2% of the account.
No widening of stop-losses, and I stay out if market structure breaks.

Premium Chart Patterns 1. Identify overall trend
Use BOS and CHoCH to read trend direction.
2. Mark premium and discount zones
Use Fibo 0.50 or volume profile to find optimal buy/sell zones.
3. Look for liquidity pools
Check where:
Retail stop losses are
False breakouts may occur
4. Wait for sweep or fake breakout
This is the strongest confirmation that institutions are active.
5. Mark order blocks & fair value gaps
These become entry and target zones.
6. Enter on retest
Never jump in early—wait for retest of order block, FVG, or structure.
7. Manage risk tightly
Premium patterns give small stop-loss and large RR opportunities.

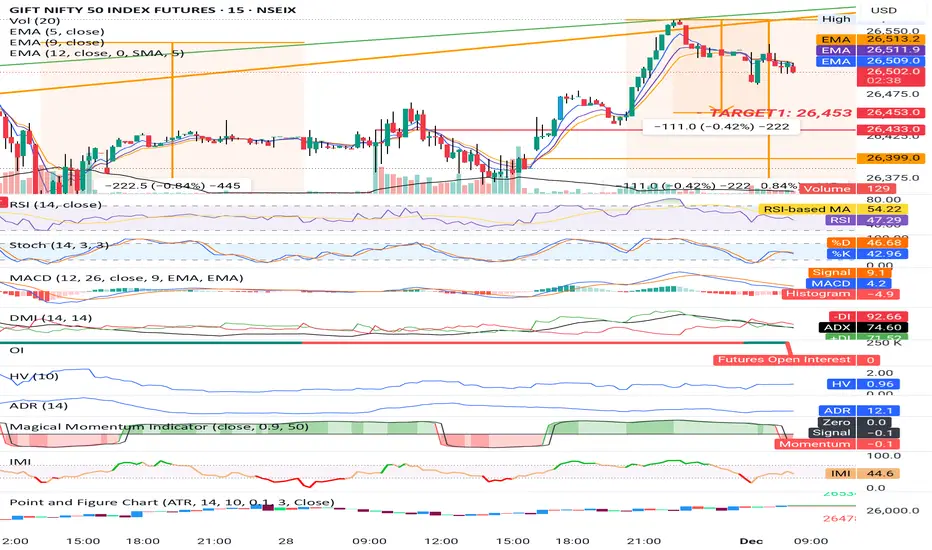
GIFT NIFTYGIFT NIFTY is moving at high but with very less volume. Which shows the correction in market. Gift nifty is showing bearish in short term view with target 26,400 and strong support atbsame level, if support was not taken we can expect further downside with a target of 26,120. If Gift Nifty took support and moves above 26,600 we can see upside target 26,800.
This is just my analysis
Gold Holds Strong Inside Trend Channel,Prepares for New ATH PushGold continues to maintain impressive bullish momentum, trading steadily within its rising trend channel. With structure firmly supported and macro sentiment leaning dovish, the market appears to be positioning for a new short-term ATH if liquidity aligns.
📊 Technical Outlook (M30 – MMF Flow)
Gold has respected the ascending channel perfectly, with each corrective leg finding buyers along channel midline and lower boundary.
The most recent impulse broke through the 4,23x region before pulling back into local liquidity.
Key Liquidity Zones
4,236 – 4,254 → Short-term supply reacting
4,218 – 4,220 → Minor demand zone
4,196 – 4,199 → Major BUY Zone (channel support + imbalance fill)
Market structure remains bullish as long as price holds above 4,196, the confluence level where:
✔️ Demand zone
✔️ Trend channel support
✔️ Fibonacci retracement
all align.
A clean bounce from this zone could trigger the next expansion leg.
🎯 MMF Trading Plan – BUY Priority
Scenario 1 – Continuation Bounce
Entry (Buy): 4,218 – 4,220
SL: 4,210
TP: 4,254 → 4,272 → 4,281
Scenario 2 – Strong Liquidity Sweep BUY (Preferred for RR)
Entry (Buy): 4,196 – 4,199
SL: 4,188
TP: 4,236 → 4,254 → 4,281
SELL Trades
Only scalp sells at supply zones
(4,254–4,257 / 4,281–4,283)
→ Not a main strategy while trend remains bullish.
⚜️ MMF View
Gold is showing healthy bullish structure, with clear liquidity engineering and controlled corrections.
As long as price stays within the trend channel and above 4,196, the path of least resistance remains up.
A breakout toward 4,281+ is highly likely before any deeper correction.
“In bullish markets, the best trades come from buying the dip—never chasing the pump.”XAU/USD – Gold Holds Strong Inside Trend Channel, Prepares for New ATH Push
Gold continues to maintain impressive bullish momentum, trading steadily within its rising trend channel. With structure firmly supported and macro sentiment leaning dovish, the market appears to be positioning for a new short-term ATH if liquidity aligns.
📊 Technical Outlook (M30 – MMF Flow)
Gold has respected the ascending channel perfectly, with each corrective leg finding buyers along channel midline and lower boundary.
The most recent impulse broke through the 4,23x region before pulling back into local liquidity.
Key Liquidity Zones
4,236 – 4,254 → Short-term supply reacting
4,218 – 4,220 → Minor demand zone
4,196 – 4,199 → Major BUY Zone (channel support + imbalance fill)
Market structure remains bullish as long as price holds above 4,196, the confluence level where:
✔️ Demand zone
✔️ Trend channel support
✔️ Fibonacci retracement
all align.
A clean bounce from this zone could trigger the next expansion leg.
🎯 MMF Trading Plan – BUY Priority
Scenario 1 – Continuation Bounce
Entry (Buy): 4,218 – 4,220
SL: 4,210
TP: 4,254 → 4,272 → 4,281
Scenario 2 – Strong Liquidity Sweep BUY (Preferred for RR)
Entry (Buy): 4,196 – 4,199
SL: 4,188
TP: 4,236 → 4,254 → 4,281
SELL Trades
Only scalp sells at supply zones
(4,254–4,257 / 4,281–4,283)
→ Not a main strategy while trend remains bullish.
⚜️ MMF View
Gold is showing healthy bullish structure, with clear liquidity engineering and controlled corrections.
As long as price stays within the trend channel and above 4,196, the path of least resistance remains up.
A breakout toward 4,281+ is highly likely before any deeper correction.
“In bullish markets, the best trades come from buying the dip—never chasing the pump.”

GOLD EXPLOSION: XAUUSD READY TO ACCELERATE!📰 BASIC SUMMARY (FA): PRESSURE ON USD AND SAFE HAVEN DEMAND
Gold is receiving strong support thanks to:
FED DOVISH: Recent comments from FED Governors (Waller, Williams) and information about Kevin Hassett potentially taking the position of FED Chairman (supporting strong rate cuts) are boosting expectations for rate cuts, weakening the US Dollar (USD).
GEOPOLITICS/ECONOMICS: News about conflicts in the Black Sea and weakening Chinese manufacturing data (PMI decline) reinforce Gold's safe haven role, pushing prices to a 6-week high.
📈 TECHNICAL ANALYSIS (TA): MAINTAINING UPWARD STRUCTURE
The 2H chart shows Gold in a clear UPWARD trend (with multiple BOS). The optimal strategy is to wait for price adjustments to the key demand zone:
Action: ENTRY (BUY)
Price Range: $4,185 – $4,192 (Breakout/Demand zone established. Wait for confirmation here.)
STOP LOSS (SL): Below $4,160.9 (Invalidates upward structure if price breaks.)
TARGET 1 (TP): $4,244.8 (Nearest resistance.)
TARGET 2 (TP): $4,270.1 – $4,276.1 (Main growth target.)
Strategy: Patiently wait for a Pullback to the $4,185 – $4,192 zone to enter a LONG position following the trend.
⚠️ IMPORTANT ECONOMIC CALENDAR:
Pay attention to the US ISM Manufacturing PMI data and other macro reports this week to assess USD momentum.
#XAUUSD #GOLD #GoldAnalysis #FED #Dovish #Uptrend #MarketStructure #TradingView #Forex

XAUUSD – LANA FOCUSES ON BUYING WITH THE SWING TREND AT THE...✨ XAUUSD – LANA FOCUSES ON BUYING WITH THE SWING TREND AT THE START OF THE WEEK
Fundamental Analysis
The Fed has just announced that it will end its QT (Quantitative Tightening) programme starting from 1st December, along with setting the federal funds target rate at 3.75–4%.
When QT stops, the balance-sheet reduction slows down, meaning liquidity is no longer being aggressively withdrawn from the market. This generally supports risk assets — and gold as well.
Mechanism recap:
QE: Expands the Fed’s balance sheet, injecting liquidity into the market.
QT: Shrinks the balance sheet, pulling liquidity out.
With QT paused, the market expects the Fed to take a softer stance on monetary policy, which strengthens the medium-term bullish outlook for gold.
Given this environment, Lana expects gold to retain upside potential early in the week, though price may show volatility near key liquidity zones.
Technical Analysis
On the H4 timeframe, price structure is following a clear bullish Elliott Wave sequence (1)–(2)–(3)–(4)–(5). The current upward wave has not shown any major reversal signal yet.
The Swing Zone at 4190–4195 is the nearest important low and serves as the primary short-term support. This is Lana’s preferred zone for swing-trend buying.
Above price, two notable Liquidity Zones are forming:
4250–4260: Near liquidity zone where fake breaks or temporary pullbacks may appear.
4365–4370: Higher liquidity zone aligned with previous highs — likely an area for significant profit-taking if the bullish wave continues.
Lana’s main expectation: gold may pull back slightly into the 4190–4195 swing zone, then extend the bullish wave to re-test the liquidity regions above. However, since liquidity zones often create stop-hunts and fake breakouts, Lana does not recommend buying directly at these resistance levels.
Key Price Levels
Main Support (Swing Buy Zone): 4190 – 4195
Resistance / Liquidity Zones:
4250 – 4260
4365 – 4370
Trade Setup
Buy: 4190 – 4195
Stop Loss: 4185
Take Profit: 4250 – 4260 – 4365 – 4370


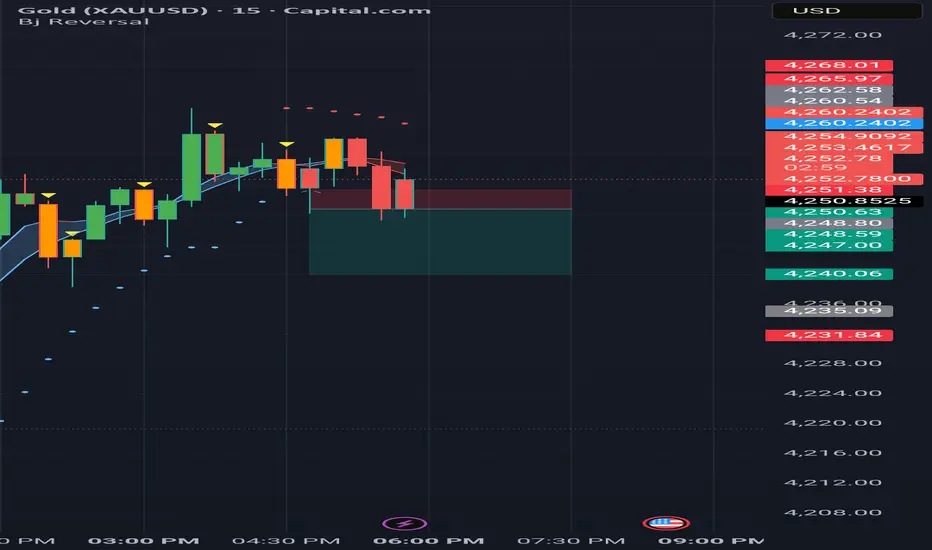
Gold Trading Strategy for 01st December 2025📈 GOLD Intraday Trading Plan
🟢 BUY Setup (Long Position)
Entry Trigger: Buy above the high of the 15-minute candle after a confirmed close above $4248.
Reasoning: A breakout above 4248 on a lower timeframe signals bullish momentum and continuation strength.
🎯 Targets for LONG
Target 1: $4260
Target 2: $4276
Target 3: $4290
🛡️ Suggested Stop-Loss (SL)
Place SL below the breakout candle low or follow your risk management rules.
📉 SELL Setup (Short Position)
Entry Trigger: Sell below the low of the 1-hour candle after a confirmed close below $4196.
Reasoning: A breakdown on a higher timeframe confirms stronger bearish pressure.
🎯 Targets for SHORT
Target 1: $4183
Target 2: $4170
Target 3: $4155
🛡️ Suggested Stop-Loss (SL)
Place SL above the breakdown candle high or align with your risk tolerance.
📊 Risk Management Tips
Use 1–2% maximum risk per trade.
Avoid trading during major news events unless you’re experienced.
Always wait for candle close confirmations (VERY important).
Scale out partial profits at each target for balanced gains.
⚠️ Disclaimer
This analysis is for educational and informational purposes only. It is not financial advice or a recommendation to buy or sell any asset. Trading in gold and financial markets involves high risk, and you should assess your own risk tolerance and consult a professional financial advisor if needed.

XAUUSD Smart Money Outlook – Intraday Discount Buy ModelXAUUSD Bias: Bullish – Looking for Longs Only
The market remains in a clear bullish structure on the Daily, H4, and H1. Price is currently trading in premium levels after a strong displacement. The expected behavior for the next trading day is for price to retrace into the Intraday Discount zone during Asia, accumulate in London, and then expand bullishly during New York session.
#XAUUSD #Gold #Forex #Trading #ICT #SmartMoney #OrderFlow #Liquidity #PriceAction #NYSession #LondonSession #FVG

XAUUSD Positional Long with SL#Gold Positional Trade Outlook
Gold is currently pulling back after a sharp rally, offering #positional traders an opportunity to build entries gradually with the target upto prev ATH or rejection. Price is approaching key demand zones, so follow a scaled stop-loss (SL) structure to manage risk effectively. Consider building positions in phases as price reacts to each support level:
SL1: 4,008 – Early protective stop for light entries
SL2: 3,930 – Medium-risk level for second build-up
SL3: 3,886 – Deep stop for long-term positional holds
Stick to disciplined risk management, add positions only on confirmations, and allow the trend structure to guide your exposure.

XAU/USD Bullish Continuation Setup Toward 4,223 After Liquidity 1. Market Structure
The chart highlights a COCH (Change of Character) followed by a BOS (Break of Structure), signaling a shift from bearish to bullish structure.
Several smaller coch points confirm internal bullish structure building.
2. Liquidity & POI Zones
There is a clear liquidity sweep near the PDL (Previous Day Low), where price dipped into a demand zone to collect orders.
An Extreme POI (Point of Interest) sits below current price — this acted as the strong reaction zone for the bullish move.
PDH (Previous Day High) is marked as an early short-term target/liquidity area.
3. Expected Move
The projection (zig-zag line) indicates bullish continuation after a pullback into the POI zone.
The target is marked around 4,223.629, matching the red horizontal resistance line.
The EMA (9) serves as dynamic support, showing price respecting the bullish trend.
4. Probability Outlook
As long as price stays above the trendline and POI, the bias remains bullish.
A break below the POI would invalidate the setup and open the lower liquidity region again.

XAUUSD DECISION POINT: hold for longs or break for shorts XAUUSD is currently retesting a major weekly level after a strong bullish push, and this area will decide the next directional move. I’m watching for price to reject this resistance zone and pull back into the trendline/structure support—if we see bullish rejection there, longs remain in play toward the 4,330 region. However, if price breaks and closes below the trendline and key support area, that would invalidate the bullish structure and open clean downside continuation into lower levels. Pure price action: reaction at this weekly level will guide whether gold continues its climb or shifts into a deeper correction.

XAUUSD MULTI TIMEFRAME ANALYSIS Hello traders , here is the full multi time frame analysis for this pair, let me know in the comment section below if you have any questions , the entry will be taken only if all rules of the strategies will be satisfied. wait for more price action to develop before taking any position. I suggest you keep this pair on your watchlist and see if the rules of your strategy are satisfied.
