Weekly Gold analysis & 8R scenarioLast week gold closed positively with a strong candle showing positivity and approaching to a strong 4H FVG nested inside weekly quadrant level and making cluster. We may see both buying and selling scenarios.
Gold has also broken 4H trend line and retested it. So we can see a possible move till FVG.
We may also witness a breakout if price violates FVG and breaks all time high with strong volume support.
1. Price is creating higher highs in micro structure level and approaching towards 4hours FVG after breaking and retesting trend line at 4 Hours.
2. Trend line breakout is supported by strong volume.
3. Price is continuously running above EMAs confirming up move for now.
4. We may see a reversal scenario at 4 hour FVG level.
5. Most probably price will take liquidity of FVG/RDRB level and create MSS/CISD/TS/iFVG in LTF.
6. Price should show rejection/reversal in respective LTF (1h/15m) at FVG zone.
7. Take the trade only once clear entry model i.e. turtle soup. iFVG break, CDS or MSS happens on LTF
All these combinations are signalling a high probability and ~8R trade scenario.
Note – if you liked this analysis, please boost the idea so that other can also get benefit of it.
Also follow me for notification for incoming ideas.
Also Feel free to comment if you have any input to share.
Join me on live stream for real time update.
Disclaimer: This analysis is for educational purposes only and does not constitute investment advice. Please do your own research (DYOR) and check with your financial advisor before making any trading decisions.
Futures market

Part 11 Trading Master Class What Are Options?
Options are financial contracts that give the buyer the right, but not the obligation, to buy or sell an underlying asset at a predetermined price (called the strike price) before or on a specific date. Unlike shares, which give ownership, options only provide trading rights.
There are two main types of options:
Call Option – gives the right to buy.
Put Option – gives the right to sell.
The buyer of an option pays a premium, while the seller (or writer) receives the premium and must fulfill the contract if the buyer exercises it.

SILVER MIC LONG TRADEWith Silver on up trend and breaking a pivot.
The marked levels in chart are good opportunities for taking 1:2 R:R
The demand zone formed is also in line with 50/ 21 moving average on daily.
#safer trades
#take proper position size as per risk management

GOLD EXPLOSION: READY TO CONQUER NEW HEIGHTS?I. HOT NEWS 💥
Gold is experiencing its 4th consecutive monthly increase, reaching $4,192.78/oz (closing on 11/28) thanks to significant changes from the Fed.
Interest Rate Reversal: Recent statements from the Fed Governor have increased the probability of a rate cut in December 2025 to 89% (up from 50% last week).
Gold Connection: A low-interest-rate environment is a paradise for Gold, propelling it to become a safe-haven asset. The fundamental momentum is EXTREMELY STRONG.
II. TECHNICAL ANALYSIS 📊
The price is approaching a critical supply zone. The current strategy is Buy on Dip with higher targets.
Short-term Resistance Target (PDI):
Price Range: $4,210 – $4,235
Strategy: Short-term resistance, requires a decisive Breakout to continue the upward momentum.
Ultimate Target (FVG):
Price Range: $4,260 – $4,330
Strategy: The next potential profit-taking target for Smart Money. Main Long target.
Strong Demand Zone (OB - Order Block):
Price Range: $4,046 – $4,064
Strategy: Strategic support (Demand Zone). A safe buying area if the price corrects deeply.
III. CONCLUSION & RISKS 🎯
Market Sentiment: Strongly BULLISH thanks to momentum from the Fed.
Focus: Monitor price action around $4,235. If surpassed, $4,330 is not far off.
Warning: Always manage risk (SL) tightly. Do not trade without Price Action confirmation!
#XAUUSD #GOLD #FOREX #FedDovish #RateCuts #SMC #OrderBlock #FVG #BullishTrend #TradingView

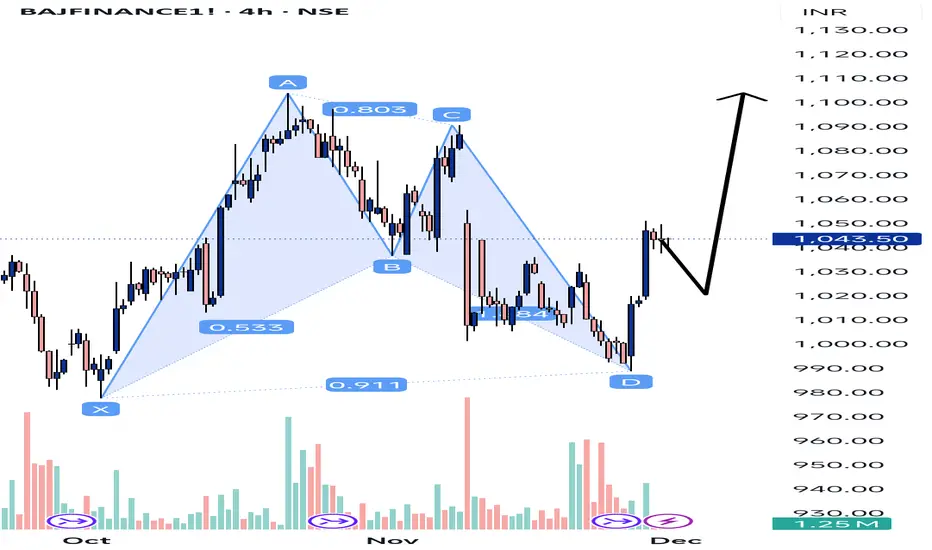
Bat pattern in bajaj finance The shaded blue structure with points X – A – B – C – D is a harmonic pattern (looks like a bullish Gartley / Bat-type pattern):
X → A → B → C → D marks swings in price.
The little numbers like 0.803, 0.533, 0.911 are Fibonacci ratios used to validate the harmonic pattern.
Point D is at the bottom right – that’s usually the potential reversal zone (PRZ) where price is expected to stop falling and start moving up.
So:
👉 The pattern is suggesting bullish reversal from D (buyers stepping in around the lows near ₹990–1,000 area).
---
Current price action
After hitting D, price has bounced up and is now near ₹1,040+.
The candles from D to current level show recovery, confirming that the pattern’s reversal is (so far) working.
XAUUSD is skyrocketing after the Adam & Eve pattern!OANDA:XAUUSD is really interesting right now. The price seems likely to rise further after the formation of the Adam & Eve pattern. With such an easy-to-remember name, the Adam & Eve pattern is one of the most memorable. Below, I’ll explain the reasons and how to easily recognize it.
The Adam pattern is characterized by a sharp drop, followed by a quick recovery, forming a "V" on the chart. High, sharp, and aggressive! You could say it's more "masculine."
On the other hand, the Eve pattern develops more slowly. The price becomes more rounded, forming a wider and smoother base before rising again, creating a shape similar to the letter "U." Softer, more curved, and more "feminine."
Combining these two elements gives us the Adam & Eve pattern, which often signals a potential trend reversal. Especially when accompanied by fundamental analysis or other strong technical indicators.
This pattern will stick in your mind when you connect its shapes to the male and female aspects. A pattern that's truly hard to forget.

XAUUSD - GOLD - Trying to catch TOP is like chasing your crush# Here are the key factors currently supporting gold:
Momentum remains bullish:
#GOLD has gained as markets increasingly price in a potential Federal Reserve interest rate cut.
Gold continues to be regarded as a safe-haven and hedge asset. Amid economic uncertainty, inflation concerns, geopolitical risks, and sustained demand from central banks and investors, gold retains its primary drivers.
# Here are the key technical levels to watch over the next month:
According to recent chart data:
The immediate support region is approximately $4,110–$4,010, which serves as a pivot zone. A break below this level could lead to further downside toward $3,817–$3,683.
On the upside, a breakout above $4,282–$4,325 could pave the way for a move toward $4,450–$4,550.
Target-6
If the current bullish momentum persists and supportive fundamental conditions remain in place, gold may target the level marked as 6 on the chart.
#Here are the factors most likely to influence the movement of XAU/USD in the near future:
1. U.S. interest rates and Federal Reserve policy.
2. U.S. economic data and inflation figures.
3. Strength or weakness of the U.S. dollar: Since gold is priced in U.S. dollars, a weaker dollar typically supports higher gold prices.
4. Geopolitical risk and global uncertainty: Global instability, trade tensions, or major macroeconomic concerns often drive investors toward gold as a safe-haven asset.
Conclusion
Gold will remain strong as long as key support levels hold and market sentiment remains favorable. With momentum in its favor, any dips are likely to present buying opportunities, while a clean breakout could initiate the next leg higher.
~ Disclaimer ~
High Risk Investment
Trading or investing in assets like crypto, equity, or commodities carries high risk and may not suit all investors.
Analysis on this channel uses recent technical data and market sentiment from web sources for informational and educational purposes only, not financial advice. Trading involves high risks, and past performance does not guarantee future results. Always conduct your own research or consult a SEBI-registered advisor before investing or trading.
This channel, Render With Me, is not responsible for any financial loss arising directly or indirectly from using or relying on this information.

Gold Bulls vs Bears: Who Will Win the $4,100 Battle?🧭 Market Overview
Current Price Zone: Gold is trading near $4,141.27, slightly below recent highs around $4,200.
52-Week Range: From a low of $2,583.49 to a high of $4,381.60, indicating strong bullish momentum over the past year.
Recent Action: Price is consolidating between $4,040 and $4,080, suggesting a pause after a multi-month rally.
📊 Technical Indicators
Trend: Long-term bullish, but short-term momentum is neutral to slightly bearish.
Support Zones:
$3,987: 55-day SMA, acting as a dynamic support.
$3,886: Weekly low, a key horizontal support level.
Resistance Zones:
$4,245: November high, first major resistance.
$4,380: All-time high, ultimate bullish target.
Momentum Indicators:
RSI and MACD show weakening bullish momentum.
Stochastics and Williams %R suggest potential overbought conditions.
📐 Chart Analysis
Demand Zone: The grey rectangle around $4,173.23 likely marks a support area where buyers previously stepped in.
Stop-Loss Zone: The red rectangle below current price could represent a risk threshold for long positions.
Take-Profit Zone: The upper grey rectangle suggests a bullish target zone, possibly aligned with the $4,245–$4,380 resistance band.
Time Markers: Vertical red dashed lines may indicate key news events or session starts that influenced volatility.
🧠 Strategic Insights
Bullish Scenario: A breakout above $4,245 could trigger a run toward $4,380. Traders may look for confirmation via volume spikes or bullish candlestick patterns.
Bearish Scenario: A breakdown below $4,040 could expose the $3,987 and $3,886 supports. Watch for bearish divergence in momentum indicators.
Neutral Bias: Until price breaks out of the current range, scalping or range-bound strategies may be more effective than trend-following.
🛠 Trade Setup Suggestions
Entry: Consider entries near $4,100 if bullish signals emerge (e.g., bullish engulfing, MACD crossover).
Stop-Loss: Below $4,040 or $3,987 depending on risk tolerance.
Take-Profit: Target $4,245 initially, with extended targets at $4,380 if momentum continues.
🔍 Final Thoughts
Gold’s technical landscape is rich with opportunity but demands precision. The current consolidation phase is a battleground between bulls and bears. Traders should stay nimble, monitor macroeconomic cues (like Fed rate decisions), and adjust risk management accordingly.

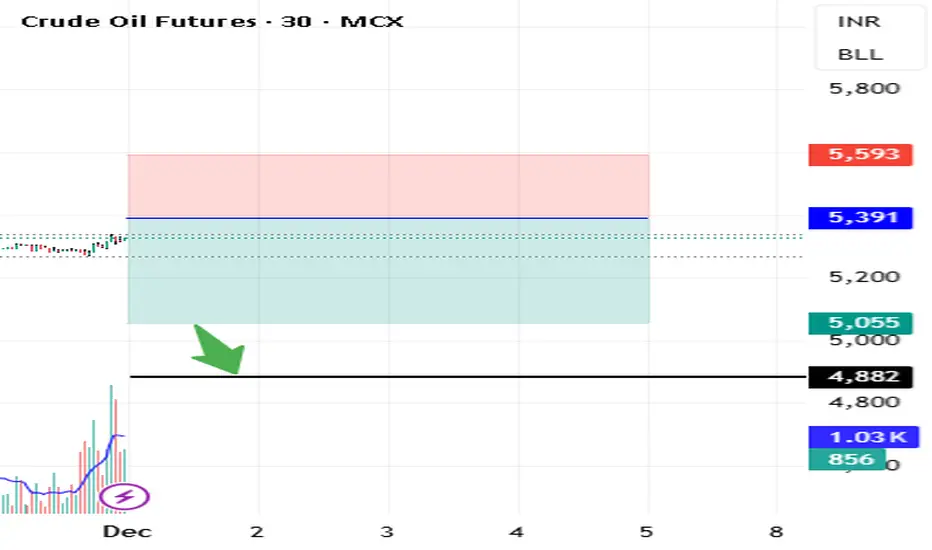
CRUDEOIL crudeoil sell zne 5390 to 5550.if there creat sell trend then bias 5050/4985,invalidation above 5590
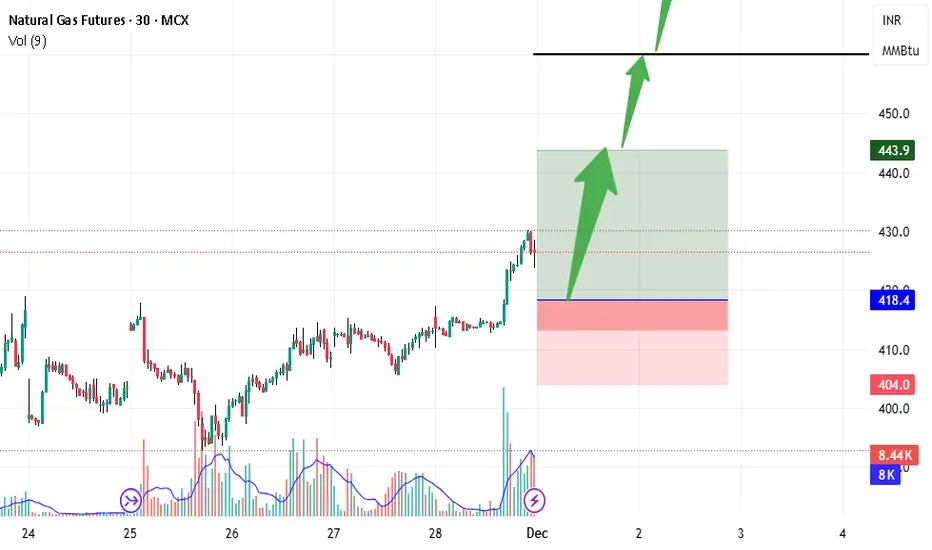
NATURAL GASVnatural gas december contract best one 418.50to 413 invalidation beloe 404 upside bias 444/460/477
Crude Oil at Key Decision Zone”Crude Oil (MCX) currently testing a major decision zone.
Price has reached a confluence of:
Higher-timeframe falling trendline
1H supply zone
Previous structure resistance
Is zone se market do clear structure moves bana sakta hai:
✔ Bullish Scenario
Price cleanly breaks above the supply zone
Retest holds as support
Upside extension target: 5400–5420
✔ Bearish Scenario
Price rejects the trendline + supply confluence
Breakdown below intraday support
Downside target: 5260 zone
Bias:
No early entry. Reaction confirmation on the zone will decide the next directional trade.

natural gas bearish setupnatural gas reaching resistance from the most recent swing which also happens to be bearish ob.
from last year we can expect a fall

Part 7 Trading Master Class Why Traders Use Options
1. Hedging
Investors use options to protect their portfolios from downside risk.
Example: Buying a put option acts like insurance.
2. Speculation
Options allow traders to take directional bets with limited capital.
3. Income Generation
Selling options (covered calls, cash-secured puts) generates regular income through premium collection.
4. Leverage
Options enable traders to control large positions with small capital.

Gold upside breakout?After a brief phase of consolidation, is gold facing another minor rally. Given the current levels chances of a big rally is limited but the upside bias was confirmed as soon as the recent profit booking was arrested at 3900 levels. With central banks like PBoC piling up on Gold, a minor rally is not out of question. Target should be previous high. SL at 4050.

Gold 4H – Can XAUUSD reject 4245 before diving into 4140?📈 Market Context
Gold rallied as the U.S. dollar closed softer on repriced Fed rate-cut expectations, with market headline flow confirming USD finishes lower and gold rallies on renewed cuts timing debates — a setup that encourages external liquidity raiding before weekly direction is revealed. Forex Factory
4H conditions are classic for liquidity engineering: price trades near balanced mid-range flows, institutions exploit USD weakness into weekly open, and both buyer/seller pools are vulnerable to strategic sweeping before expansion.
Expect volatility spikes around U.S. session opens and PMI headline catalysts.
🔎 Technical Analysis (4H / SMC View)
🟢 Buy Zone: 4140–4138
SL: 4130
TP targets: 4175 → 4200 → 4220 → 4250 → 4280+
Rationale:
• Discount zone beneath 4H liquidity shelf
• Demand mitigation + accumulation narrative after sweep
🔴 Sell Zone: 4245–4247
SL: 4255
TP targets: 4220 → 4200 → 4175 → 4150 → 4140
Rationale:
• Premium supply above equal-high liquidity
• 4H imbalance magnet below waiting to be filled
⚠️ Risk Management Notes
• Wait for M15 ChoCH / BOS confirmation before entries — avoid blind positioning.
• Expect wider spreads and wick manipulation on USD headline releases.
• Avoid trading 10–20 minutes before high-impact USD news (PMI, Fed speakers).
• Scale partials at each TP level, let runners work only after confirmation is printed.
Summary
Gold remains in 4H rangebound engineering territory where Smart Money is likely to sweep premium above 4245, deliver a correction to 4140, then seek a validated bullish reaction from discount demand on confirmed USD volatility.
Patience and confirmation first. Liquidity always wins.
🚀 Follow @Ryan_TitanTrader for more weekly SMC setups

Silver last week we booked 10300 points profit & Gold 3800 pointParameters Data
Reason 🟩 Extreme Bullish Momentum due to: 1) Global Breakout above $56. 2) Physical Scarcity driving spot premiums. 3) Aggressive Safe-Haven Buying ahead of the Fed meeting.
Asset Name Silver MCX (Dec Futures) ₹1,71,850
Price Movement Buy side: 🟩 R1: ₹1,73,500, 🟩 R2: ₹1,75,000, 🟩 R3: ₹1,78,000. If break 🟥 S1: ₹1,69,800 then downside possible towards 🟥 S2: ₹1,65,000, 🟥 S3: ₹1,61,800.
Current Trade 🟩 BUY Active / T1: ₹1,73,500, T2: ₹1,75,000 / SL: ₹1,69,800
Risk Reward 🟩 1 : 1.5
Confidence 🟩 27/30 (Dominant signals Bullish/Positive हैं, confirming very high conviction for the BUY trade.)
Probability 🟩 95% (Momentum is backed by fundamental deficits and macro tailwinds.)
Max Pain 🟨 ₹1,68,000 (Options data suggests writers are trapped below this level, fueling a short-covering rally.)
DEMA Levels 🟩 20/50/100/200/250 DEMA: Price is significantly above all major averages (50-DEMA approx ₹1,58,000), indicating a "Blue Sky" zone.
Supports 🟩 S1: ₹1,69,800 (Immediate Breakout Support), 🟩 S2: ₹1,65,000, 🟩 S3: ₹1,61,800.
Resistances 🟥 R1: ₹1,73,500 (Spot High/Target), 🟥 R2: ₹1,75,000 (Psychological), 🟥 R3: ₹1,78,000 (Fibonacci Extension).
ADX/RSI/DMI 🟩 RSI (14): 76.4 (Overbought but typically stays elevated in parabolic moves). 🟩 ADX (14): 55.2 (Trend is extremely strong).
Market Depth 🟩 Bullish Skew (Aggressive buying at Ask prices; sparse selling volume).
Volatility 🟩 High (ATR 14 is expanding; expect daily ranges of ₹2,000-₹3,000).
Source Ledger 🟩 Verified (MCX, TradingView, Investing.com, Spot Market Rates via Data Accuracy Protocol.)
OI 🟩 OI Up / Price Up (Fresh Longs being added even at record highs).
PCR 🟩 1.45 (Put Call Ratio indicates strong bullish sentiment and support building).
VWAP 🟩 Price > VWAP (Intraday average is well below current market price, supporting longs).
Turnover 🟩 Very High (Record volumes recorded in near-month contracts).
Harmonic Pattern 🟨 N/A (Parabolic moves invalidate standard harmonic reversal patterns).
IV/RV 🟩 IV Spiking (Implied Volatility is rising, suggesting traders expect the explosive move to continue).
Options Skew 🟩 Positive Skew (Far OTM Calls are trading at a premium).
Vanna/Charm 🟨 N/A (Weekend data limitation).
Block Trades 🟩 Large Institutional Buys detected in the last hour of trade.
COT Positioning 🟩 Net Long Exposure is at a 6-month high for Managed Money.
Cross-Asset Correlation 🟩 Positive with Gold and Industrial Metals, Negative with USD.
ETF Rotation 🟩 Inflows continuing into Silver ETFs globally.
Sentiment Index 🟩 Extreme Greed (FOMO buying is visible in retail and prop desks).
OFI 🟩 Strongly Positive (Order flow is one-sided towards buying).
Delta 🟩 Long Delta dominating the options chain.
VWAP Bands 🟩 Breakout above the +2 Standard Deviation band.
Rotation Metrics 🟩 Outperformer (Beating Gold and Copper in daily percentage gains).

Gold mcx last week we booked Gold 3800 points & silver 10300 Parameters Data
Reason 🟩 Strong Bullish Resurgence due to: 1) Dovish Fed Expectations (85% chance of cut). 2) Wedding Season Demand in domestic spot markets. 3) Weak US Dollar Index boosting safe-haven appeal.
Asset Name Gold MCX (Dec Futures) ₹1,26,960
Price Movement Buy side: 🟩 R1: ₹1,27,800, 🟩 R2: ₹1,28,500, 🟩 R3: ₹1,29,600. If break 🟥 S1: ₹1,25,500 then downside possible towards 🟥 S2: ₹1,24,200, 🟥 S3: ₹1,23,000.
Current Trade 🟩 BUY Active / T1: ₹1,27,800, T2: ₹1,28,500 / SL: ₹1,25,500
Risk Reward 🟩 1 : 1.5
Confidence 🟩 25/30 (Dominant signals Bullish/Positive हैं, confirming strong conviction for the BUY trade.)
Probability 🟩 88% (Supported by "Golden Cross" on hourly charts and strong global cues.)
Max Pain 🟨 ₹1,25,000 (Data suggests significant option writing support at this level).
DEMA Levels 🟩 20/50/100/200/250 DEMA: Price has closed above the key 20-Day and 50-Day DEMAs, reconfirming the short-term bullish trend.
Supports 🟩 S1: ₹1,25,500 (Breakout retest level), 🟩 S2: ₹1,24,800 (Weekly Pivot), 🟩 S3: ₹1,23,500 (Strong Base).
Resistances 🟥 R1: ₹1,27,800 (Immediate Swing High), 🟥 R2: ₹1,29,000 (Psychological Barrier), 🟥 R3: ₹1,31,500 (All-Time High Zone).
ADX/RSI/DMI 🟩 RSI (14): 64.5 (Bullish momentum rising, not yet overbought). 🟩 ADX (14): 38.2 (Trend strength is increasing).
Market Depth 🟩 Buy Skew (Order book shows higher bid quantities at lower levels, indicating accumulation).
Volatility 🟩 Moderate to High (Implied Volatility is rising ahead of US inflation data and Fed meeting).
Source Ledger 🟩 Verified (MCX, India Bullion & Jewellers Association (IBJA), Investing.com via Data Accuracy Protocol).
OI 🟩 Long Build-up (Open Interest increased along with price, suggesting fresh bullish positions).
PCR 🟩 1.15 (Put-Call Ratio > 1 suggests bullish sentiment with Put writers active at support).
VWAP 🟩 Price > VWAP (Closing price is comfortably above the Volume Weighted Average Price).
Turnover 🟩 High (Strong participation seen in both December and February contracts).
Harmonic Pattern 🟨 N/A (No immediate reversal pattern; trend is impulsive).
IV/RV 🟩 IV Rising (Premium expansion expected as traders hedge against event risk).
Options Skew 🟩 Call Skew (Upside calls are commanding higher premiums relative to OTM puts).
Vanna/Charm 🟨 N/A (Greeks data limited for MCX commodities on weekends).
Block Trades 🟩 Institutional Buying noted in Feb expiry contracts.
COT Positioning 🟩 Net Longs Increased (Global hedge funds have increased their net long exposure to Gold).
Cross-Asset Correlation 🟩 Positive with Silver and EUR/USD, Negative with DXY (Dollar Index).
ETF Rotation 🟩 Inflows (Gold ETFs seeing renewed interest after a brief pause).
Sentiment Index 🟩 Greed (Market sentiment has shifted back to "Buy on Dips").
OFI 🟩 Positive ( Buying pressure at the Ask price is dominant).
Delta 🟩 Positive (Option Delta leans heavily towards the long side).
VWAP Bands 🟩 Upper Band Test (Price closed near the upper deviation band, indicating strength).
Rotation Metrics 🟩 Stable (Gold is performing well, though Silver is currently the high-beta outperformer).

XAUUSD – H4 Fibonacci Supports the Bullish Trend, Prefer ...XAUUSD – H4 Fibonacci Supports the Bullish Trend, Prefer Buying at the POC for the Coming Week
Gold closed Friday near 4,215, following a strong rally after the CME system glitch.
On the H4 timeframe, the bullish structure is now clearly forming and remains relatively stable. Price has just broken out of a multi-day consolidation zone and is moving into the Fibonacci extension levels.
With the current context, I continue to prioritise medium-term buy setups on pullbacks to the POC, rather than chasing price at new highs.
🎯 Primary Trading Plan – BUY THE DIP Using Fibonacci & POC
Buy Entry: around 4,187
Stop Loss: 4,175
Target Levels: 4,225 – 4,240 – 4,290 – 4,300
These profit-taking zones are derived from the H4 Fibonacci extensions, with the 1.618–2.618 levels being areas where strong profit-taking often appears in the market.
For every position, I maintain risk at only 1–2% of the account — staying in the game matters more than trying to catch every top or bottom of a wave.
Key Level:
4,160 is the major support and the “life line” of the H4 uptrend.
If price breaks below and closes under 4,160 on H4, the current bullish structure is invalidated. In that case, I will pause the BUY scenario and rebuild a new plan — possibly considering a deeper SELL setup in the next analysis.
1. Fundamental Context
Gold’s strong recovery momentum recently slowed down after failing to stay above the 4,160 region.
However, the previous rally took place while the USD was weakening again, despite US bond yields attempting to recover across the curve.
On the higher timeframes, gold is on track for its fourth consecutive bullish month, following the major breakout in October that once again drew attention to the 4,400 region.
Prolonged geopolitical tensions combined with expectations of further Fed rate cuts give buyers enough reason to maintain mid-term positions, even if short-term volatility increases.
Overall, the fundamentals remain supportive of the uptrend — unless there is a major shift in interest-rate expectations or systemic risk.
2. H4 Technical Analysis – Fibonacci Perspective
The previous consolidation zone around 4,160–4,185 was broken to the upside with a series of strong bullish candles, confirming a higher-high, higher-low structure on H4.
The POC (Point of Control) has shifted upward to 4,187, signalling heavy trading activity before the breakout — a suitable area for waiting on a retest to buy again.
Fibonacci extensions from the latest bullish swing highlight important resistance clusters ahead:
1.618: the 4.24x zone — first profit-taking target, likely to see volatility.
2.618: the 4.35x–4.36x region — an extended target if the bullish trend continues strongly.
With this structure, any pullback to 4,187 while holding above 4,160 is, for me, a medium-term BUY opportunity, not a reversal signal.
3. Market Sentiment & Action Plan
After a strong rally, the market is experiencing FOMO buying at elevated levels.
This phase often brings sudden pullbacks to shake out late buyers.
I avoid chasing the price during this stage.
Instead, I wait for price to revisit the POC at 4,187, where volume previously accumulated, to secure a better risk-to-reward and a tighter SL.
If buyers truly dominate, they will protect the 4,160–4,187 region.
If not, stepping aside after structure breaks is safer than forcing a bias.
Plan for Next Week
Priority: Buy around 4,187
SL: 4,175
TP: 4,225 – 4,240 – 4,290 – 4,300
If price breaks strongly below 4,160 and closes under it on H4 →
Cancel all BUY plans and wait for a new structure before considering any deep correction SELL setup.
Do not chase buys near high Fibonacci extension levels unless there is a clear intraday setup with a well-defined SL.
If you find this perspective useful for your gold trading plan next week, follow the TradingView account and share which levels you are watching for entries. I always read the feedback to improve future analyses.

Gold 4H – Liquidity Plays Ahead of Fed Minutes & PMI Data🥇 XAUUSD – Weekly Smart Money Outlook | by Ryan_TitanTrader
📈 Market Context
Gold continues to trade inside a controlled 4H consolidation as markets brace for a highly event-driven week: U.S. PMI releases, updated Fed guidance, and renewed debates over the timing of future rate cuts.
Recent data has shown mixed momentum — softer employment trends but steady business activity — keeping the dollar volatile and gold reactive near mid-range liquidity.
Institutional flows remain cautious, reducing aggressive positioning ahead of major macro catalysts. This environment typically leads to engineered sweeps on both sides of the range as Smart Money hunts liquidity before revealing direction.
Expect short-term volatility spikes, especially around U.S. session opens and PMI releases.
🔎 Technical Analysis (4H / SMC View)
• Price is navigating a minor bearish structure, forming lower highs while protecting deeper liquidity beneath 4020.
• The recent 4H BOS + corrective pullback suggests the market may generate a liquidity grab toward the discount zone before any strong bullish leg develops.
• A Premium Sell Zone at 4225–4227 sits above resting liquidity, making it an ideal region for stop hunts and short-term distribution.
• The Discount Buy Zone at 4010–4008 aligns with structural reaction points, unmitigated demand, and a liquidity shelf — ideal for accumulation.
• Mid-range liquidity around 4060–4080 may be swept before the market chooses a larger weekly direction.
🟢 Buy Zone: 4010–4008
SL: 4000
TP targets: 4085 → 4120 → 4175 → 4220
Rationale:
• Deep discount zone beneath 4H liquidity
• Confluence of demand + structural mitigation
• High probability of engineered sweep before bullish expansion
🔴 Sell Zone: 4225–4227
SL: 4235
TP targets: 4175 → 4120 → 4060 → 4015
Rationale:
• Premium supply above equal-high liquidity
• Favors stop hunt + distribution before correction
• Aligns with previous 4H rejection and imbalance fill
⚠️ Risk Management Notes
• Wait for M15 ChoCH / BOS inside each zone before entering — avoid blind entries.
• Expect spreads and liquidity manipulation around news: US PMI, Fed speeches, and data surprises.
• Avoid trading 10–20 minutes before high-impact events.
• Scale partial profits at each structural target to secure gains and let runners develop.
✅ Summary
Gold remains trapped in a structured 4H range where Smart Money is likely to sweep one side before delivering a decisive expansion.
Discounted buys at 4010–4008 and premium sells at 4225–4227 remain the highest-probability weekly setups.
Stay patient, respect liquidity, and follow confirmation.
🔔 FOLLOW @Ryan_TitanTrader for more weekly SMC setups 🚀

XAUUSD – Weekly outlookXAUUSD – Weekly outlook: structure points towards 4,580 as long as bulls hold the line
Brian – Favouring buy-the-dip setups while price holds above 3,996
1. Market overview – triangle break and trend confirmation
On the daily chart, gold has finally broken out of the long consolidation triangle, with Friday’s candle closing cleanly above the descending trendline that has capped price for weeks.
For me, this breakout is the first proper confirmation that the primary bullish trend is resuming.
The next major resistance on the chart sits around 4,246 – a key level I’m watching as a trend-confirmation line.
If price can break and hold above 4,246, the path towards the higher zone around 4,580 opens up, in line with the Fibonacci extension drawn on the chart.
In short: the structure into next week is bullish, with pullbacks seen as opportunities to position for a potential move towards new highs.
2. Technical structure – from breakout to extension targets
The breakout from the triangle comes after a sequence of higher lows bouncing off the rising trendline, indicating accumulation rather than distribution.
Below price, we have demand zones clustered around the 4,110 trendline area and deeper supports near 4,040 and 3,920.
Above price, the roadmap is fairly clear:
First, a test of 4,246 (local resistance & former supply).
Then the ATH / prior high region around 4,360–4,380.
Finally, the Fibonacci 1.618 extension projects into the 4,560–4,580 zone, which is my medium-term upside objective if bulls can maintain control.
As long as daily structure keeps printing higher highs and higher lows and price stays above the key invalidation at 3,996, I will continue to treat gold as buy-on-dip rather than looking for major tops.
3. Key zones & trading ideas for next week
I’m not treating this as a signal service, but here’s how I’m mapping the chart for my own trading:
Primary idea – Buy the dip into trendline / support
Watch zone: around the rising trendline near 4,110.
If price pulls back into this area early in the week and shows a clear rejection on H4/D1 (wick rejections, bullish engulfing etc.), I’ll be interested in building long positions.
Upside path:
First objective: 4,246 – trend-confirmation resistance.
If broken and retested from above, the next leg could extend towards 4,360–4,380.
Extension target: 4,560–4,580 in line with the 1.618 Fibonacci projection.
Secondary idea – Using Fibonacci zones on break above 4,246
If gold breaks and holds above 4,246, the Fibonacci zones between roughly 4,360 and 4,580 become interesting for scaling in / managing positions:
Partial profits or tight trailing stops can be considered as we approach 4,360–4,380.
Any healthy corrective pullback from that region that respects the rising structure could still offer add-on entries with the 4,580 zone as a medium-term target.
Invalidation:
A daily close below 3,996 would seriously damage this bullish structure and force me to reassess. Below that, I would step aside and wait for a new pattern rather than trying to force the long idea.
4. Fundamental backdrop – why gold still has a bid
From a macro point of view, gold is navigating a mix of:
Tariff and trade tensions, which keep hedging demand alive as investors look for protection against policy shocks.
Ongoing geopolitical risks and conflict, supporting gold’s role as a classic safe-haven asset.
A late-cycle interest-rate environment, where markets are increasingly focused on when and how aggressively central banks will adjust policy after a period of elevated rates and liquidity distortions.
This combination tends to limit the downside for gold: even when we see corrections, dip-buyers are never too far away, especially when the technical structure is aligned with the macro story.
5. Strategy & risk management
Into next week, my bias is clear: structure is bullish above 3,996, so I prefer buying pullbacks rather than trying to short into strength.
The trendline around 4,110 is my first area of interest for fresh longs; anything closer to 4,040–4,000 (if we see a deeper flush) would be considered an even better price, provided the daily structure doesn’t break.
As always, position sizing and stop placement are key – one good weekly move is far more valuable than several emotional entries trying to catch every candle.
What do you reckon – does this breakout have enough fuel to take us towards 4,580, or do you see a deeper correction setting up first? Feel free to share your view in the comments.

XAUUSD – LANA TRACKS MID-TERM WAVE 5 TOWARDS THE ATH ZONE AT ...XAUUSD – LANA TRACKS MID-TERM WAVE 5 TOWARDS THE ATH ZONE AT 4360
1. Fundamental Analysis
On the geopolitical front, President Putin has once again reiterated the conditions for a ceasefire between Russia and Ukraine. While the possibility of a peace agreement remains uncertain, his firm stance suggests the conflict is unlikely to end soon. This keeps gold supported as a mid-term safe-haven asset.
On the US side, Donald Trump continues to emphasise that the stock market will keep making new all-time highs, and even mentioned the potential removal of most income taxes, replacing them with tariff-based revenue. These comments fuel “risk-on” sentiment for equities and the USD, creating short-term fluctuations for gold.
Overall, Lana expects gold to maintain a mid-term bullish bias over the next 1–2 weeks, though short-term volatility is likely as the market constantly re-prices geopolitical risks and US policy expectations.
2. Technical Analysis
On the D1 timeframe, gold is forming a mid-term Elliott Wave 5 structure. Wave (4) has completed at a key support region, accompanied by a bullish market structure shift (MSS), signalling the start of Wave (5).
Using the Fibonacci extension tool, the theoretical target for Wave (5) lies around the 2.618 extension at 4360 — a strong psychological level and close to the potential ATH zone, where significant profit-taking from buyers may appear.
On the way up, the 4246 level is a major resistance zone:
If price breaks this level decisively and closes above it on D1, the bullish trend strengthens, confirming buyers are willing to push price to new highs.
The descending trendline has already been broken. After the breakout, price retested the line and bounced, showing buyers have regained control. A pullback towards the trendline zone at 4133–4139 would give Lana a clean opportunity to join Wave 5 with a better risk-to-reward ratio.
3. Key Price Levels to Watch
Major Resistance / Mid-term Take-Profit Zones:
4240 – 4246: Intermediate resistance; needs a clear breakout to reinforce the bullish trend.
4360: Fibonacci 2.618 extension & potential ATH target for Wave 5.
Support / Potential Buy Zones:
4133 – 4139: Near the trendline; Lana’s preferred buy zone if price pulls back.
4124: Technical stop-loss level; a break below may weaken the short-term bullish wave structure.
4. Trade Setup
BUY: 4133 – 4139
SL: 4124
TP: 4240 – 4280 – 4350
👉 Follow Lana on TradingView for the earliest gold analysis updates. 💛

XAUUSD – LANA WAITING TO BUY THE CONTINUATION WITHIN THE ...XAUUSD – LANA WAITING TO BUY THE CONTINUATION WITHIN THE UPTREND CHANNEL
1. Fundamental Analysis
Gold is maintaining its upward momentum as investors closely monitor the Russia–Ukraine tension and the mixed signals around potential peace efforts.
President Putin’s recent statements suggest peace proposals could form the basis of a future agreement, yet Russia is still prepared to continue fighting if conditions are not favourable. This creates a mixed risk environment — reducing short-term safe-haven demand but still keeping geopolitical uncertainty elevated, which may pressure the USD in the medium term.
In this context, Lana prefers the scenario where gold continues to follow the broader uptrend, looking for opportunities to buy on technical pullbacks into major liquidity zones rather than FOMO entries at higher prices.
2. Technical Analysis
On the H1 timeframe, XAUUSD is moving inside a clear ascending channel, currently trading near the midline of the channel. The dominant structure remains bullish, with no sign of a break of market structure.
After a strong bullish candle, the market left a Strong Liquidity area below and created a small Gap under the channel — this is where Lana expects price to retrace and retest before resuming the upward movement.
The Buy zone aligns with a major liquidity region near 4,166–4,167, close to the lower boundary of the channel — an ideal level for continuation buys during a controlled pullback.
Using Fibonacci extensions, the key levels include:
1.618: near the current price — a region where price often pauses or consolidates
2.618: around 4,210 — Lana marks this as a potential short-term Sell scalping zone
3.618: around 4,235–4,237 — a stronger Sell zone where heavy profit-taking may appear
The 4,155 level is a key structural boundary:
If price breaks below and holds under this zone, Lana will stop prioritising long-term buy setups, as the bullish channel may be invalidated.
3. Key Levels to Watch
Support / Buy zone & strong liquidity:
4,166 – 4,167 (near the midline descending toward the lower channel boundary)
4,155 — mid-term trend boundary
Resistance / Fibo extension & Sell zones:
4,210 – 4,213: Sell scalping zone (Fibo 2.618)
4,235 – 4,237: Strong Sell zone (Fibo 3.618), near the channel top
4. Trade Setups
BUY Setup:
Buy: 4166 – 4167
SL: 4160
TP: 4182 – 4195 – 4210 – 4250
SELL Setup 1:
Sell: 4210 – 4213
SL: 4218
TP: 4200 – 4185 – 4160 – 4145
SELL Setup 2:
Sell: 4235 – 4237
SL: 4243
TP: 4212 – 4200 – 4185 – 4160
👉 Follow Lana on TradingView to read all updates early. 💛

XAUUSD Weekly Analysis 01/12/2025 - 07/12/2025Namaste Everyone,
It doesn't get easier than this, all timeframes are bullish, overall i am bullish. (no blind entries, wait for the pullback)
Price will move up although i feel that the h4 fvg might be disrespected because of monday open, i don't think that monday will expand directly. Overall bullish bias I will wait for my setup before entering not entering directly ahahaha. There's SMT With XAGUSD at the highs but I believe that it's just a lag and price will catch up with silver.
Thank you and keep winning!
