GOLD MARKET UPDATE 11/19 – STRUCTURE HAS SHIFTED1. Market Structure
Gold has broken above the H4 downtrend line and completed a successful retest around 4,060–4,070.
The strong push toward 4,100 confirms a transition from bearish → short-term bullish.
Structural Signals:
Buyers are gaining control as price continues forming higher lows
The POC zone 4,072–4,075 has turned into strong support
Intraday structure is leaning clearly toward a bullish recovery
2. Technical Breakdown – H1 & H4
H4 Trend
After the previous strong drop, price is forming a potential bottom around 4,030–4,050
H1 Trend
The short-term bullish trend is confirmed after breaking and retesting the descending trendline
3. Key Levels to Watch
Support Zones
4,072–4,075 → POC – major support maintaining the bullish structure
4,060–4,065 → minor support – quick-reaction area
Resistance Zones
4,108–4,112 → first resistance (H1/H4 confluence)
4,147–4,150 → strong H4 resistance, potential higher target if bullish continuation remains
⚠️ Disclaimer
This analysis is for informational and educational purposes only and does not constitute financial advice. Trading involves risk, and you should always conduct your own research before making any trading decisions.
Futures market

Gold Possible scenarioIn 4H TF price has been made 5 ways structure so please very carefully trade, my bias still bullish side, one of the reason is bitcoin, nasdaq and spx are in correction phase so gold and silver for the time being will remain still bullish.
Its my idea not trading advise so plan your trade as per your rules, all the best for all traders.
Thanks

Gold 30-Min Chart: Sellers Active Near Resistance!Gold is once again testing its falling resistance trendline, which has already rejected the price several times in recent sessions. Each time the price touches this trendline, selling pressure increases, showing how strong this resistance zone is.
Currently, the price is near $4070–$4080, where short-term traders should stay alert. If the price fails to break above this resistance, a pullback toward the $4000–$3980 support zone looks likely. This area has previously acted as a strong demand zone, where buyers may re-enter.
However, if Gold breaks and sustains above this trendline resistance, we could see a fresh upside momentum building up toward $4115–$4135 levels. For now, the structure looks weak near resistance, and traders should wait for a clear breakout or rejection confirmation before taking any position.
Disclaimer: This analysis is for educational purposes only and should not be taken as financial advice. Please do your own research or consult your financial advisor before investing.
Analysis By @TraderRahulPal | More analysis & educational content on my profile.
If you found this helpful, don’t forget to like and follow for regular updates.

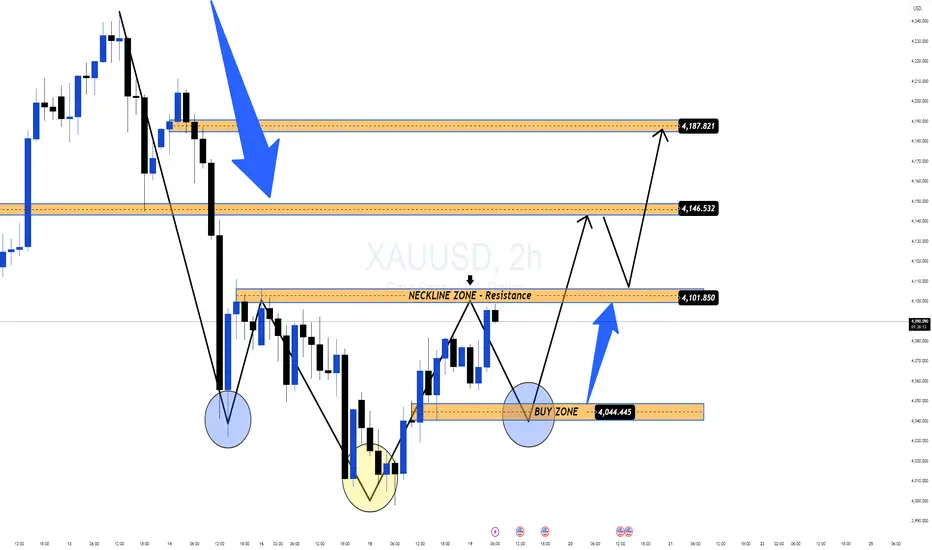
Gold Forms Inverted Head & Shoulders: Reversal Signal!After a short-term corrective decline, the $4,000 level has triggered strong BUY momentum, creating a clear price rebound at the end of yesterday's session. The increase in buying volume indicates that the BUY side is returning to the market after several sessions of being pushed down.
📊 Prominent Technical Structure
On the 2H chart, gold is completing the Inverted Head & Shoulders pattern – one of the strongest bullish reversal patterns.
• Head: liquidity bottom at 4,00x
• Two shoulders: forming symmetrically with good bounce
• Neckline: area 4,101–4,102, currently a key resistance
Price is likely to:
1️⃣ Slightly adjust to the neckline area or BUY ZONE 4,044–4,046
2️⃣ Retest – Accumulate – Confirm breakout
3️⃣ Break out towards 4,146 → 4,187 when the pattern is complete
🎯 Short-term Expectations
Volatility may increase ahead of upcoming economic data, so the reasonable strategy remains:
✅ Prioritize BUY according to the pattern
• Wait for retest of neckline or area 4,044–4,046
• Observe confirmation force (Volume – Momentum – Rejection)
• Target towards 4,146 → 4,187 if the pattern is activated
⚠️ Note
– The reversal trend is only truly confirmed when the price clearly breaks the 4,101–4,102 area.
– Market sentiment currently leans towards recovery, but clear signals are needed before entering large (long-term HOLD) positions.
GOLD H1 – Trump’s Fed Comments Shake Market Sentiment🟡 XAUUSD – Intraday Smart Money Plan | by Ryan_TitanTrader (19/11)
📈 Market Context
Gold is trading in a tight corrective structure as markets react to breaking headlines that Donald Trump is considering removing Fed Chair Jerome Powell.
This news injects uncertainty into Fed policy expectations, causing short-term volatility in USD and positioning gold at a critical decision zone.
• Trump’s comments increase speculation about a potential policy shift, which may temporarily weaken USD sentiment.
• However, gold remains capped below the premium supply zone as institutional flows continue to engineer liquidity sweeps.
• Price is hovering near $4,080 ahead of key Fed-related discussions, keeping both sides of liquidity active.
Institutional order flow suggests controlled accumulation at the discount range while premium regions remain defended by sellers.
🔎 Technical Analysis (1H / SMC Structure)
• Structure: Price is forming a short-term distribution pattern after multiple BOS events from the 4150 breakdown.
• Premium Sell Zone: 4109–4111, aligning with unmitigated supply and internal liquidity pockets.
• Discount Buy Zone: 4009–4007, sitting inside a clean demand block + previous sell-side sweep.
• Liquidity:
→ Buy-side liquidity sits above 4111, where equal-high clusters form.
→ Sell-side liquidity rests between 4007–4000, where earlier long positions were cleared.
🔴 Sell Setup (Premium Reaction Zone)
• Entry: 4109 – 4111
• Stop-Loss: 4119
• Take-Profit:
→ 4055 (minor inefficiency)
→ 4028 (BOS retest)
→ 4009–4007 (discount demand)
📌 Execute only after a liquidity sweep into the zone + bearish CHOCH on M5–M15.
🟢 Buy Setup (Discount Reaction Zone)
• Entry: 4009 – 4007
• Stop-Loss: 4000
• Take-Profit:
→ 4040 (short-term range high)
→ 4075 (inefficiency rebound)
→ 4105/4110 (premium retest)
📌 Valid if price sweeps 4007 and shows bullish displacement.
⚠️ Risk Management Notes
• Expect volatility as traders react to Trump’s comments on Fed leadership.
• Avoid trading in the 4030–4080 chop zone without a clear structural break.
• Reduce position size during impulsive spikes around USD sentiment shifts.
• Trail stops once price clears each liquidity pocket.
📝 Summary
Gold is being influenced heavily by uncertainty around Trump’s remarks about replacing Fed Chair Powell. Liquidity is building at both extremes, offering clean opportunities at the edges of the range.
• Sell Zone: 4109–4111 (premium supply)
• Buy Zone: 4009–4007 (discount accumulation)
Expect a manipulation → reaction → continuation pattern as institutions play both sides of the current structure.
📍 Follow @Ryan_TitanTrader for more Smart Money updates.
🎁 Gifts in BIO for traders who follow daily plans.

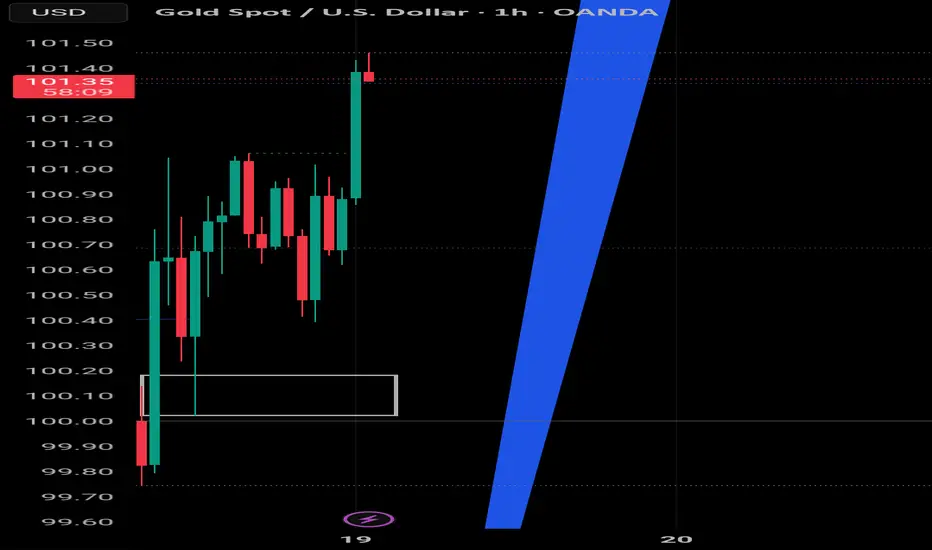
WEEKLY PROFILE ON GOLDGold opened and made a weekly low on Monday and later stop hunt it on Tuesday before it broke structure to make a market structure shift (MSS) now we expect to see a distribution phase FOR THE REST OF THE WEEK to the upside to the level 105.00.

XAUUSD Weekend Analysis Nov 19,2025
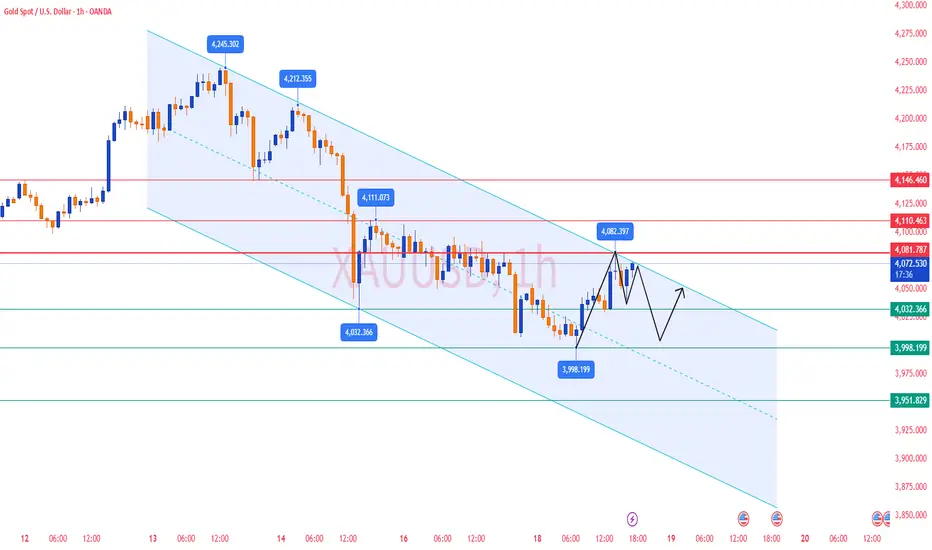
Looking at the chart, the market is still moving inside a broad descending channel, and the price is currently sitting just below a major trendline that has been acting as resistance for some time. Every attempt to break above it has been rejected, which tells us that sellers are still defending that level strongly.
Support
4025–4030: Very strong support. If the market breaks below this zone, momentum could quickly shift to the downside.
4000: Psychological support.
Resistance
4150–4180: Immediate resistance area where price may struggle.
4250–4300: The next major hurdle if the upside continues.
Trendline resistance from the descending channel.
📈 What to Expect Next
Bullish Case
If the price continues to hold above 4025, the market has room to push higher. A clean breakout above the trendline would open the way towards 4170, and eventually 4250–4300. This becomes more likely as long as buyers protect the demand zone.
Bearish Case
If the market closes below 4025, the structure weakens. In that scenario, we could see a deeper correction toward 3950, and possibly even 3850 if selling pressure increases.
🎯 Final Thoughts
The market is currently in a tight consolidation phase, building pressure between support and resistance. The 4025–4030 zone is the line in the sand — hold it, and the market remains bullish; lose it, and sellers take control. The upcoming breakout from the trendline will likely decide the next major move.

Weekly profile on GoldSo gold opened the week and made a monday low that was later stop hunt yesterday on Tuesday during London session to make a weekly low so we expect to see a distribution phase throughout the week in the upperside to price level 105.00
GOLD next move 83000 to 85000 as per technical breakout gold can be going up near 83000 and 85000 trade on your own analysis , trade with stoploss , share and like,

GOLD 1ST TGT DONE 83000 NOW READY FOR 85000gold 1st tgt 83000 was done, ready for next tgt 85000
please check my previous post

XAUUSD – Head & Shoulders Pattern Forming on H4 💛 XAUUSD – Head & Shoulders Pattern Forming on H4 🎯
🌤 Overview
Hello everyone, Lana here again 💬
After a strong drop, Gold is forming a clear Head & Shoulders structure on the H4 timeframe, aligned with the long-term ascending trendline. This pattern suggests the possibility of a bullish move back toward previous highs — but price may still dip lower to complete the structure first.
💹 Technical Analysis (ICT Perspective)
The Left Shoulder – Head – Right Shoulder is gradually shaping around the trendline + supporting FVG.
The upper 50% Fibonacci area is a reasonable zone for the right shoulder to form. If price breaks above the neckline, it may head toward the major liquidity zone around 4200.
In the short term, the 4118–4120 zone serves as resistance + neckline, making it suitable for a technical Sell setup.
The 4040–4042 area aligns with the trendline + Order Block, forming a strong support zone for potential Buy entries if price makes a deeper correction.
🎯 Trading Plan (For Reference Only)
💢 SELL Scenario (scalping at resistance)
Sell: 4118–4120
Stop Loss: 4125
Take Profit: 4105 → 4086 → 4060 → 4040
💖 BUY Scenario (preferred with the main pattern)
Buy: 4042–4040
Stop Loss: 4034
Take Profit: 4075 → 4090 → 4100 → 4140 → 4200
⚠️ Important Notes
Trading based on patterns is always expectation-driven, so combine it with candlestick confirmation on smaller timeframes (M15–M30) before entering.
Upcoming FOMC Meeting and NFP report, especially after the long U.S. government shutdown period, may cause unpredictable volatility.
Reduce position size and avoid holding large trades during major news events.
🌷 Final Thoughts from LanaM2
The H4 Head & Shoulders pattern on Gold is offering attractive opportunities for both short-term Sells and trend-aligned Buys 💛
Stay patient, wait for price to reach the marked zones, follow your stop-loss rules, and avoid FOMO during high-impact news.
If you found this helpful, please 💛 Like – 💬 Comment – 🔔 Follow LanaM2 for daily Gold insights!

XAUUSD | Bulls Hold Control Above 4070 - Eyes on 4090–4100 ZoneGold (XAUUSD) continues to show strong bullish structure, and price action above the 4070 key support reinforces buyers’ dominance.
If price sustains above this level, the next upside liquidity area sits at 4090–4100 , a zone where previous reactions have occurred.
Bullish Scenario:
Holding above 4070 keeps momentum pointed toward 4082 and then the 4090 zone.
The bullish outlook remains valid as long as price stays above 4059, which currently acts as intraday invalidation.
What I’m Watching:
A clean intraday consolidation above 4070
Momentum strength into 4082
Whether buyers can break into the 4090–4100 resistance pocket
This setup highlights how the market could behave, not financial advice—just educational analysis.
📌 Disclaimer:
This analysis is for educational purposes only and is not financial advice. Always manage risk and follow your trading plan.
Your feedback drives our content and keeps everyone trading smarter. Let’s make those pips together! 🚀
Happy Trading,
– The InvestPro Team

Spot goldDetails provided in the chart, gold is forming like triangle flag pattern support 4000 to 4060
Gold is stronger in longer terms short term it will move up and down
Bullish for longer term
Disclaimer:
Only for education purposes not recommendation

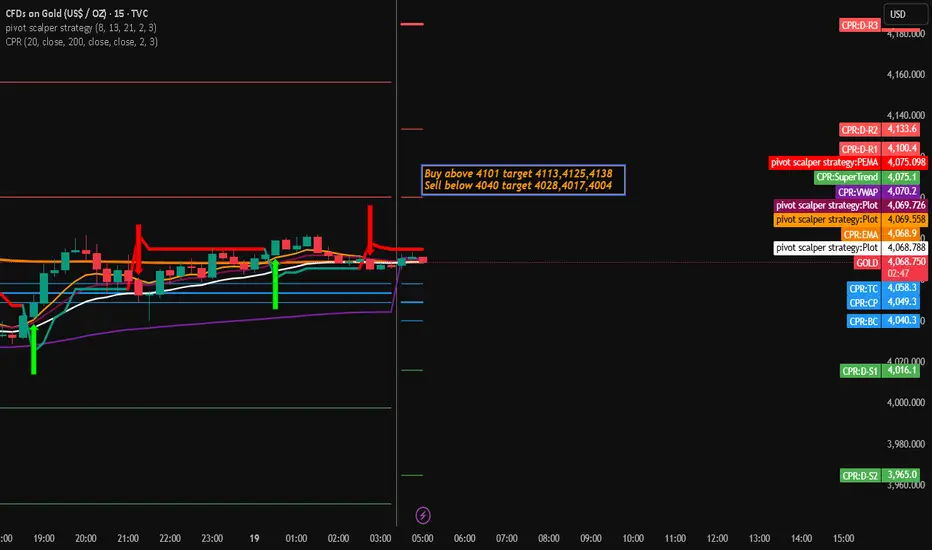
Gold Trading Stategy for 19th November 2025📈 Gold Trading Setup 💰
Buy Setup 🟢
Condition: Enter Buy if Gold (XAU/USD) closes above the high of the 15-minute candle.
Entry Level: Above 4101
Targets:
Target 1: 4113
Target 2: 4125
Target 3: 4138
Sell Setup 🔴
Condition: Enter Sell if Gold (XAU/USD) closes below the low of the 1-hour candle.
Entry Level: Below 4040
Targets:
Target 1: 4028
Target 2: 4017
Target 3: 4004
🛑 Important Disclaimer 📉
This is not financial advice. Trading involves substantial risk and may not be suitable for all investors. Only trade with capital you can afford to lose.
Do your own research (DYOR) before making any trading decisions.
Past performance is not indicative of future results.
Market conditions can change rapidly, and no strategy is foolproof.
Always use appropriate risk management, including stop-loss orders.
Psychology of Indian Traders – Short Real-Life Cases!Hello Traders!
India has one of the fastest-growing trading communities in the world.
But despite access to charts, tools, YouTube, and education, most retail traders still repeat the same emotional mistakes.
Here are a few short real-life cases that show how psychology shapes the journey of Indian traders more than any strategy or indicator.
1. The Salary Trader, “I Just Want to Recover My Losses”
A 28-year-old IT employee from Bengaluru started trading BankNifty options after watching influencers brag about profits.
He made ₹6,000 on his first day, and believed trading was easy income.
Then he lost ₹45,000 in two weeks. Instead of stopping, he kept trading bigger lots to recover.
Within 3 months, he wiped out his entire savings.
His mistake wasn’t strategy.
It was thinking recovery is more important than discipline.
2. The Overconfident Trader, “Market Mere Hisab Se Chalega”
A 33-year-old trader from Gujarat had one big lucky win in 2021 during the bull market.
He made ₹3.5 lakh in one week and believed he was naturally talented.
He increased his position size, stopped using stop loss, and ignored risk.
The next correction wiped out not just his profit, but his entire capital.
His mistake was thinking “luck = skill.”
3. The FOMO Trader, “Sab Log Le Rahe Hain, Main Kyun Chhodo?”
A young trader from Mumbai bought every trending coin, SHIB, PEPE, FLOKI, without checking charts or fundamentals.
He only entered after seeing pumps on Twitter.
He never bought dips, only tops.
Today, he holds a portfolio down 70%, waiting for “next bull run” to save him.
FOMO always makes you late.
4. The Quiet Winner, “Main Kam Karta Hun, Par Sahi Karta Hun”
A disciplined trader from Pune took only 2–3 trades a week.
He risked just 1% per trade, journaled every entry, and treated trading as a skill.
In 18 months, he grew his account slowly but consistently, without blowing up once.
He is not rich yet, but he is stable, confident, and improving every month.
Consistency beats speed, every time.
Rahul’s Tip:
Most Indian traders don’t need more indicators, they need more patience, more control, and more clarity.
Before learning complex setups, learn yourself.
Your psychology decides your wealth more than your strategy ever will.
Conclusion:
These real-life cases show one truth, the Indian market doesn’t destroy traders.
Their habits do.
If you want to be different, think differently.
Trade slow, trade smart, and build discipline before expecting profits.
If this post felt relatable, like it, share your story in comments, and follow for more real-world trading psychology lessons!

Gold Analysis & Trading Strategy | November 18-19✅ From the 4-hour chart, gold remains in an overall bearish correction structure.
MA5 and MA10 have formed a bearish crossover and continue to suppress the candlesticks, indicating that the short-term rebound is limited.
MA20 is located near 4097, acting as significant resistance. As long as the price fails to stabilize above this level, the bearish structure will not change.
The Bollinger Bands show a downward opening, reflecting a weak trend.
Price previously broke below the lower band (around 3980) and although it has since rebounded, it still remains below the middle band.
Gold has repeatedly tested the 3997–4000 support zone and formed brief rebounds, but the strength is weak — this is still technical correction rather than a trend reversal.
✅ On the 1-hour chart, gold shows a clear short-term rebound correction.
Price has broken above MA5 and MA10 and is holding above the short-term moving averages, indicating strengthening rebound momentum.
The upper resistance comes from the Bollinger upper band at 4075–4078, an area where gold has repeatedly been rejected.
MA20 (around 4036–4040) has shifted from resistance to short-term support.
As long as this level holds, the 1-hour structure still has room to extend the rebound.
Long lower wicks and concentrated trading around 4050–4060 suggest that buyers are trying to establish a short-term base.
However, the short-term rebound has not changed the bigger bearish structure.
If gold fails to break through 4075–4080, the rebound may end and the price could return to its bearish rhythm.
🔴 Resistance Levels: 4075–4080 / 4100–4108 / 4150
🟢 Support Levels: 4036–4040 / 4000–3997 / 3953
✅ Trading Strategy Reference
🔰 Strategy 1 — Look for short positions near resistance (trend-following):
If gold rebounds to 4075–4080 and shows rejection:
Consider taking light short positions
Stop Loss: above 4088
Targets: 4050 → 4035 → 4000
👉 This zone combines multiple moving-average resistance and the Bollinger upper band, making it a high-probability area for trend-following shorts.
🔰 Strategy 2 — Short-term long positions from support (countertrend, light positions):
If gold pulls back to 4035–4040 and stabilizes:
Consider a short-term long position
Stop Loss: below 4030
Targets: 4060 → 4075
👉 This is only a corrective rebound trade — not suitable for large positions.
🔰 Strategy 3 — If gold breaks below 4000, downside may accelerate:
A break below 3997–4000 could trigger a stronger sell-off, with targets toward:3953 → 3920
✅ Summary
Gold remains in a bearish, downward-dominated structure, and the current rebound is still a weak correction.
As long as the price remains suppressed below 4080–4100, the bearish trend remains intact.
Elliott Wave Analysis – XAUUSD (18 November 2025)1️⃣ Momentum
D1 Timeframe:
D1 momentum is approaching the oversold zone, signaling that a potential reversal may be forming.
Although this does not confirm a daily reversal yet, it is an early warning that bearish momentum may be weakening soon.
H4 Timeframe:
H4 momentum is also nearing the oversold zone, suggesting that a reversal or recovery bounce could appear shortly.
H1 Timeframe:
H1 momentum is beginning to turn upward, indicating that in the short term we can expect a bullish pullback on the H1 timeframe.
________________________________________
2️⃣ Wave Structure
D1 Wave Structure:
Price is currently still moving inside wave Y.
With D1 momentum entering the oversold zone, we do not have a confirmed reversal yet, but it alerts us to the rising probability of one forming soon.
Wave W previously took 8 days to complete. Since momentum cycles often form in 5–8 daily candles, this time structure can be used as a reference when observing the development of wave Y, as waves W and Y tend to share similar timing characteristics.
________________________________________
H4 Wave Structure:
On H4, a 5-wave sequence (blue) has completed, and price is currently in wave 5.
Combined with D1 momentum nearing oversold, this leads to three possible scenarios:
1️⃣ Scenario 1:
This 5-wave decline is wave (1) of a larger 5-wave structure inside purple wave Y.
If so, once wave (5) finishes, we will see a wave (2) pullback, aligning with the upcoming D1 momentum reversal.
2️⃣ Scenario 2:
Wave Y may end earlier than expected, failing to reach the 3746 target.
If this occurs, a new trend could begin sooner, coinciding with the next D1 momentum reversal.
3️⃣ Scenario 3:
D1 momentum enters the oversold zone but remains compressed there, dragging price lower for a deeper extension before any reversal happens.
These three possibilities help guide our chart observation and prepare for multiple outcomes.
________________________________________
H1 Wave Structure:
On H1, price is also forming a 5-wave decline (blue) and is currently in wave 5.
The projected target for wave 5 is around 3958, which is where we expect a Buy setup.
Additionally, RSI is showing bullish divergence across the lows, reinforcing the probability that price is completing wave 5 and preparing for a short-term bounce.
________________________________________
3️⃣ Trade Plan
• Buy Zone: 3959 – 3957
• Stop Loss: 3938
• TP1: 4000
• TP2: 4096
• TP3: 4145

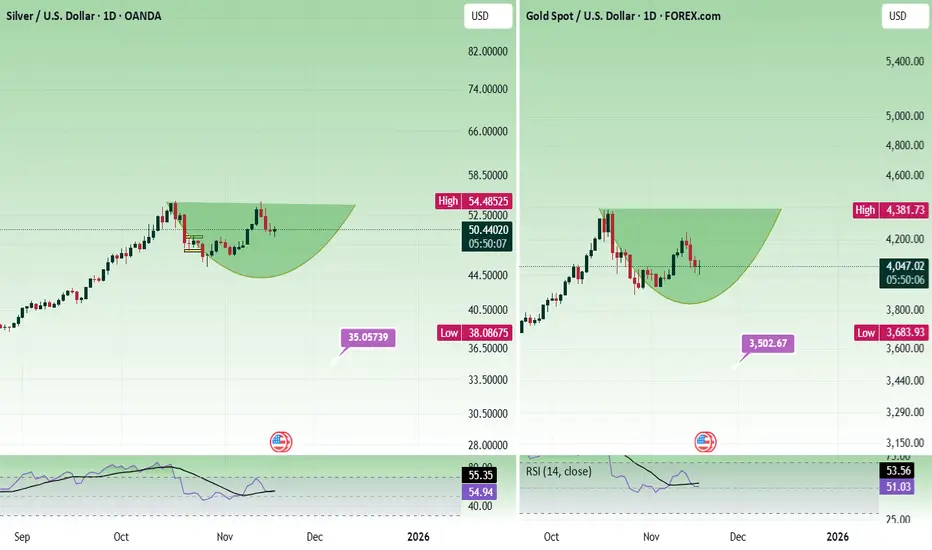
Trader's Queries - Gold & Silver - A reviewI rarely publish ideas about gold, and this is the first time I am writing about silver. This is not about where to buy or sell. Idea is about the structure of the price action.
Both gold and silver is forming a rounding bottom pattern. If it gives a breakout right away, then sustaining above these levels are crucial.
For gold, 4378 - 4382 and for silver, 55.45 - 55.55.
Rounding bottom low is at 3886 for gold, and even if there is a big fall, it should not go below 3876 - 3884 to be bullish.
For silver 44.50 - 45.50 should hold.
Since the price has given a strong trending movement already, give it some time to have a pullback, to find support, before taking any entry for investment.
We can expect silver to test 65 to 66 and gold to test 4700 - 4800 in 2 to 3 years.
Always do your analysis before taking any trade.
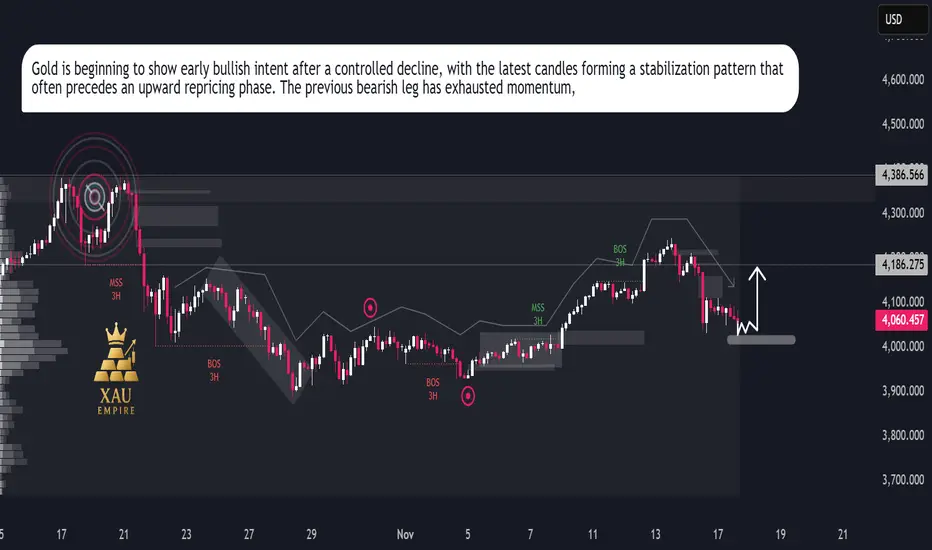
XAUUSD Repricing MoveXAUUSD Repricing Move
Gold continues to trade inside a broader corrective cycle, with price action showing a clear transition from prior strength into a short-term distribution phase. The chart highlights repeated breaks in market structure and shifts in order flow, signalling a controlled decline built on institutional rebalancing.
After the recent downside sweep, price is now hovering around a key reaction zone where liquidity has already been absorbed. Sellers dominated the previous swing, but the latest candles show a slowdown in bearish momentum, indicating that the market may be preparing for a corrective repricing attempt.
The volume footprint on the left side of the chart reflects previous heavy activity from major participants, and the current area sits beneath an inefficiency pocket that remains unmitigated. This opens the door for a short-term bullish rotation if buyers defend this accumulation region. The marked arrow in your chart aligns with a potential internal shift where gold could attempt a short retracement toward the mid-range of the prior move.
Momentum indicators embedded in the structure show reduced volatility, meaning the market may be positioning itself for a liquidity-driven bounce rather than continuing straight lower. The next sessions will reveal whether this zone becomes a launch point for a recovery leg or if the broader trend resumes its downward trajectory.
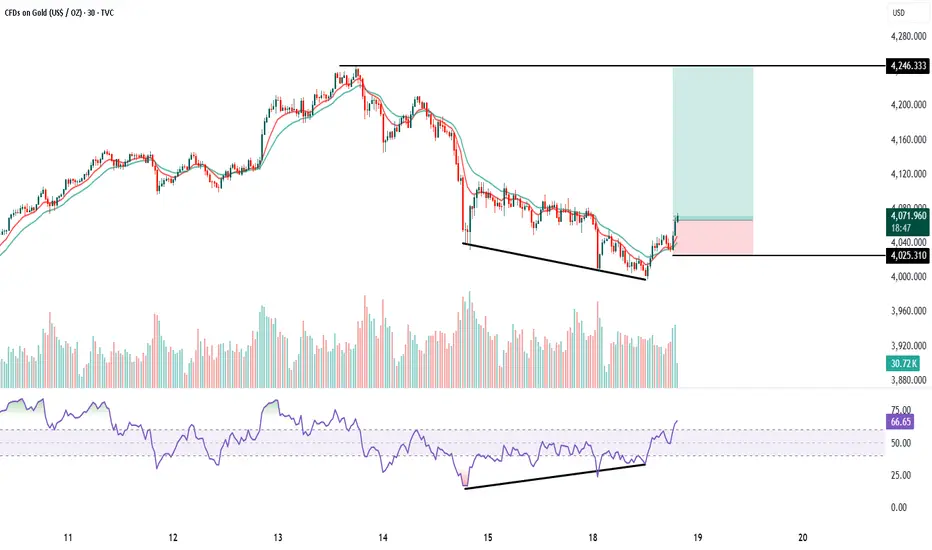
GOLD 30 Min chart analysis1. Trend : Price was in a downtrend with continuous lower highs and lower lows. Now the chart is showing a falling wedge pattern, which is a bullish reversal pattern. Breakout candle is visible with strength, indicating trend reversal from bearish to bullish on the 30-minute timeframe.
2. Volumes: Volumes remained average during the fall.
At the breakout zone, you can see volume expansion, which confirms buyers are stepping in.
This supports a valid bullish breakout.
3. Momentum (Price Action + EMAs): Price is crossing above the 10 EMA and 20 EMA, and both EMAs are starting to turn upward. This shows momentum shift from sellers to buyers. Momentum candles at breakout confirm the start of an upward move.
4. RSI Divergence: Price made lower lows, but RSI made higher lows.
This is a classic bullish divergence, indicating selling pressure is weakening. RSI has now moved above 60, confirming momentum is picking up strongly.
Buy above 4075 after the breakout candle closes above falling wedge.
This ensures confirmation and avoids a false breakout.
Keep SL just below wedge support: SL = 4025
Target : The major horizontal resistance shown on the chart is:
Target = 4246 This is also the measured move of the wedge, matching the resistance zone.
Risk–Reward: RR is approximately 1:3 to 1:3.5, which is ideal for breakout trades. This is a high-probability trend-reversal breakout setup with a clear target and safe stop loss.
XAUUSD MULTI TIMEFRAME ANALYSIS Hello traders , here is the full multi time frame analysis for this pair, let me know in the comment section below if you have any questions , the entry will be taken only if all rules of the strategies will be satisfied. wait for more price action to develop before taking any position. I suggest you keep this pair on your watchlist and see if the rules of your strategy are satisfied.

Current Market Structure & Key Observations Previous Trend: The Current Market Structure & Key Observations
Previous Trend: The chart shows a strong uptrend from late October, peaking around November 14th at approximately $4,400. This peak marked a significant reversal.
Correction/Reversal: Since the peak, the price has undergone a sharp downward correction or potential reversal.
Trendline Interaction: The price has recently fallen to and is currently interacting with a major long-term ascending trendline (the solid black line).
Current Price: The price is hovering right at the trendline, indicated by the dashed pink line at approximately $4,034.
Analysis of the Projected Path (Red Lines)
The red lines drawn on the chart suggest a specific bearish scenario:
Trendline Break and Retest: The price is shown to break below the ascending trendline. This is a critical technical signal, often indicating the end of the uptrend and the start of a downtrend.
Pullback/Retest: The price then executes a pullback back up to the broken trendline (now acting as a resistance level). The projected high for this pullback is around $4,060.
Bearish Continuation: After failing to break back above the trendline, the price is projected to continue its decline, heading towards the area of $3,900 and then possibly $3,850 in the following days.
Potential Scenarios (Alternative View)
While the red lines illustrate a clear bearish path, it's important to consider an alternative:
Scenario 1: Bearish Continuation (As Projected)
Action: If the price confirms a breakout below the trendline (closes below it on multiple candles), the trendline turns into resistance.
Target: The focus shifts to lower support levels, with initial targets around $3,900 - $3,850. This confirms the end of the recent uptrend.
Scenario 2: Trendline Hold/Bounce
Action: If the trendline acts as strong support and the price fails to close significantly below it, it could lead to a bounce.
Target: A bounce would target the previous swing high before the major drop, potentially aiming back toward $4,150. This would maintain the longer-term bullish structure.

GOLD H1 – Hawkish Fed Pressure Ahead of Key NFP Data🟡 XAUUSD – Intraday Smart Money Plan | by Ryan_TitanTrader (18/11)
📈 Market Context
Gold is trading inside a bearish corrective channel as markets react to hawkish Federal Reserve commentary and positioning ahead of this week’s U.S. NFP data.
• Fed officials signaled a stronger stance against premature rate cuts, keeping USD supported and limiting gold’s upside.
• Price continues to hover near $4,080, reflecting uncertainty as traders balance Fed tone with upcoming labour-market reports.
Institutional order flow shows controlled downside pressure, with engineered liquidity sweeps forming around both channel extremes.
🔎 Technical Analysis (1H / SMC Structure)
• Structure: Price remains inside a Bearish Correction Channel, creating consecutive BOS points, confirming distribution.
• Premium Sell Zone: 4107–4105 aligns with a previous mitigation block + internal liquidity.
• Discount Buy Zone: 3983–3985 sits at the lower boundary of the channel + liquidity sweep zone.
• Liquidity:
→ Buy-side liquidity above 4107 (clean equal-high pocket).
→ Sell-side liquidity resting around 3985–3976, where prior long positions were removed.
🔴 Sell Setup (Premium Reaction Zone)
• Entry: 4,107 – 4,105
• Stop-Loss: 4,117
• Take-Profit Targets:
→ 4,060 (minor imbalance fill)
→ 4,030 (BOS retest)
→ 3,985 (discount zone)
📌 Execute only after a liquidity sweep into the zone + bearish BOS on M5–M15.
🟢 Buy Setup (Discount Reaction Zone)
• Entry: 3,983 – 3,985
• Stop-Loss: 3,976
• Take-Profit Targets:
→ 4,030 (short-term structure high)
→ 4,060 (inefficiency midpoint)
→ 4,105 (premium retest)
📌 Valid if price taps channel low + shows bullish displacement.
⚠️ Risk Management Notes
• Expect volatility as markets digest hawkish Fed remarks before NFP.
• Avoid entering trades inside the 4020–4070 chop region without clear BOS.
• Reduce position size during news hours.
• Trail stops once price clears each liquidity pocket.
📝 Summary
Gold remains pressured by Fed rhetoric, but liquidity is building at both extremes.
• Sell Zone: 4107–4105 (premium mitigation area)
• Buy Zone: 3983–3985 (discount liquidity sweep)
Price is likely to form a manipulation → reaction → continuation pattern within the channel.
📍 Follow @Ryan_TitanTrader for more Smart Money updates ⚡
🎁 More insights & gifts on my TradingView profile.
