Master Institutional TradingWhat is Master Institutional Trading?
Master Institutional Trading is the advanced knowledge and skill set focused on understanding how big institutions operate in the market. It includes learning about market structure, order flow, liquidity zones, and smart money concepts. The goal is to understand where and why institutional players are placing their trades so individual traders can follow their footprint rather than trade blindly.
Key Elements of Institutional Trading
Smart Money Concepts (SMC):
This focuses on how "smart money" (institutions) moves in the market, including liquidity grabs, fakeouts, and manipulation of retail traders. Mastering SMC helps traders identify high-probability trade setups.
Order Blocks:
Institutions don’t place orders like retail traders. They use large block orders, which leave visible patterns on charts called “order blocks.” Learning to identify these helps in predicting price movements accurately.
Liquidity Pools:
Institutions hunt liquidity because they need large volumes to execute trades. Stop-loss levels and obvious support/resistance zones are common liquidity areas. Master institutional traders learn to identify where liquidity sits in the market.
Market Structure:
Understanding market structure (higher highs, lower lows, break of structure) is critical. Institutions move the market in phases — accumulation, manipulation, expansion, and distribution.
Volume and Order Flow Analysis:
Mastering institutional trading includes studying how volume flows in the market, using tools like volume profile, footprint charts, and delta analysis to see where institutional money is entering or exiting.
Benefits of Learning Master Institutional Trading
Higher Accuracy: You trade with the market makers, increasing your chance of success.
Better Risk Management: Institutional strategies often involve precise entry points and tighter stop-losses.
Avoiding Retail Traps: Most retail traders lose money because they trade in the wrong direction. Institutional trading helps you avoid these traps.
Consistency: You develop a rule-based approach, avoiding emotional decisions.
Why Institutions Dominate the Market
Institutions control over 70% of daily market volume, especially in forex, stocks, and commodities. They have advanced technologies like high-frequency trading (HFT), deep market data, and insider information that allow them to manipulate short-term price actions. By understanding their strategies, you can ride the momentum they create rather than getting trapped.
Final Thoughts
Mastering Institutional Trading is not about predicting the market but reading it correctly. By learning how institutional players think and operate, you can make more informed, disciplined, and profitable trading decisions. It transforms your trading approach from gambling to a professional strategy. This knowledge is essential for anyone serious about making consistent profits in the financial markets
Market indices

Option Trading✅ What is an Option?
An Option is a financial contract between a buyer and seller based on an underlying asset (stock, index, commodity).
Call Option = You have the right to Buy.
Put Option = You have the right to Sell.
You pay a premium to buy this right. You are not obligated, but you have the option to buy/sell.
✅ Example (Simple):
You buy a Call Option on Reliance at ₹2500 strike price, paying ₹50 premium.
If Reliance goes to ₹2600, you profit (your option value increases).
If Reliance stays below ₹2500, you lose only ₹50 (the premium)
Types of Options
Call Option – Profit when the market goes up.
Put Option – Profit when the market goes down.
ITM (In the Money) – Strike price already profitable.
ATM (At the Money) – Strike price close to current market price.
OTM (Out of the Money) – Strike price away from market price
✅ Advantages of Option Trading
✅ Less Capital Needed
✅ Limited Risk (when buying)
✅ High Profit Potential
✅ Profit in All Market Types (up, down, sideways)
✅ Risks in Option Trading
❗ Premium can expire worthless (buyer loses money)
❗ Selling options carries unlimited risk (if done without strategy)
❗ Time Decay – value of options reduces as expiry nears
✅ Option Trading is Best for:
✅ Traders with small capital
✅ Stock market learners
✅ Part-time traders
✅ People who want to hedge portfolios
✅ Final Summary:
Option Trading is a smart way to participate in the market using strategies, risk control, and leverage. Start with Call and Put basics, then learn strategies like covered calls, spreads, and hedging to master the gam


Long Setup from Demand Zone | Target 25,412 | SL: 24,959The Nifty 50 Index is currently trading near a strong demand zone around 24,959, which has held previously and acted as solid support. Price action indicates potential for a reversal from this zone, making it an attractive long setup.
Price formed a potential double bottom/accumulation structure at the highlighted demand zone.
We saw buying interest emerge previously from this level, suggesting institutional demand.
The price has not yet closed below the 24,959 support, keeping the bullish bias valid.
Entry: Near current level (around 25,100)
Target: 25,412 (prior resistance zone and structure breakdown area)
Stop Loss: Closing below 24,959 (strong invalidation point)
R:R - Favorable, with limited downside and potential upside toward previous swing high.
This setup is based on price action and key horizontal support-resistance levels. A breakout above minor resistance could confirm bullish continuation.


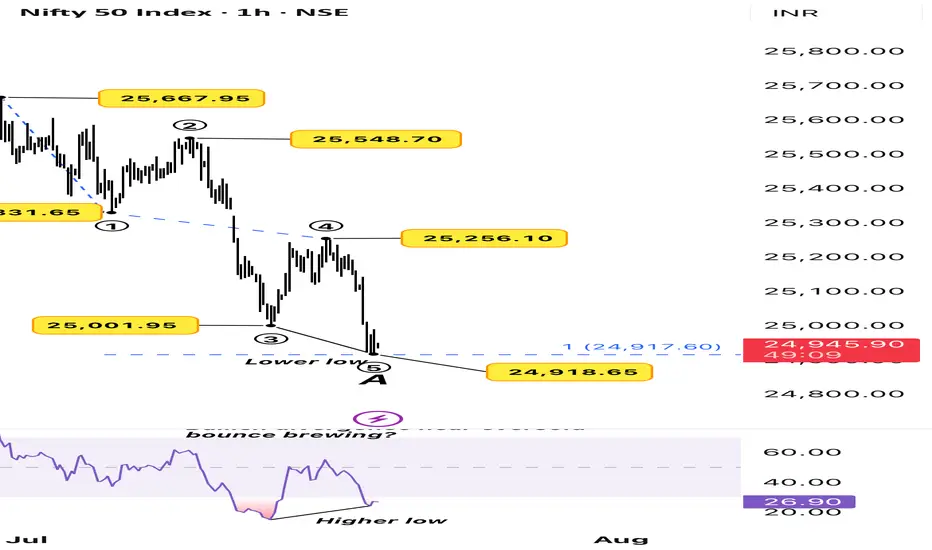
Is Nifty Signaling a Short-Term Bounce?The Nifty 50 has completed a 5-wave impulse on the 1-hour timeframe, with Wave ⑤ tagging a fresh lower low at 24,918, just under the previous swing.
While price made a lower low, RSI made a higher low, forming a bullish divergence just above the oversold zone. This often indicates weakening bearish momentum and a potential for a short-term bounce or a larger correction depending on the context.
We now have:
• ✅ A completed 5-wave(wave A) decline
• ✅ Price at a key support zone
• ✅ RSI divergence adding confluence
If this structure holds, we may have completed wave A and be entering Wave B of correction.
Disclaimer: This analysis is for educational purposes only and does not constitute investment advice. Please do your own research (DYOR) before making any trading decisions.
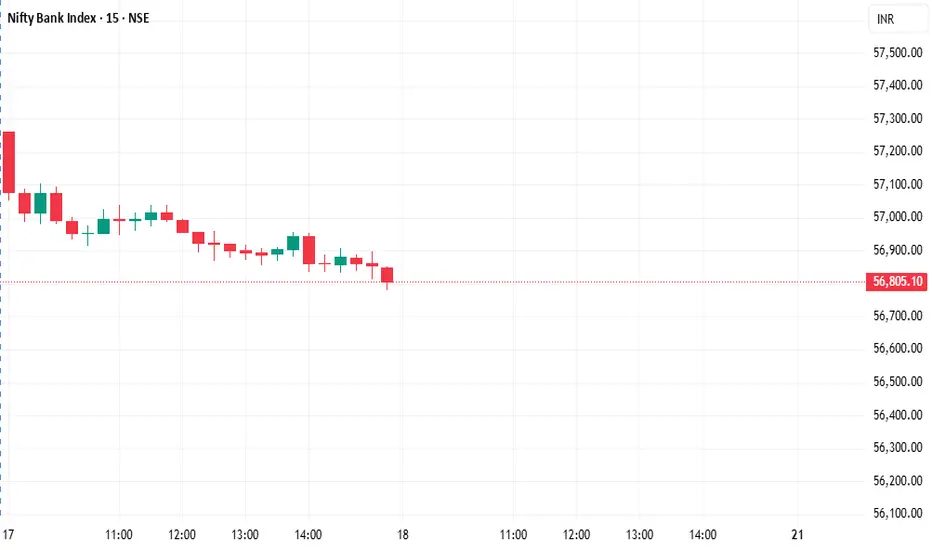
Bank nifty correction start now?Bank Nifty
Current Price: 56,791.95 (Spot)
Bank Nifty has reversed lower from the resistance trendline, confirming selling pressure near higher levels.
A Dark Cloud Cover candlestick pattern combined with an emerging M-top formation indicates potential short-term bearish sentiment.
It can short here or any bounce use as shorting opportunity for target 56,056
Major resistance is 57,400-57,700
The index is forming a rising wedge pattern, a bearish structure suggesting potential for deeper correction if key support levels are breached.
Key Support Levels:
Immediate support is identified at 56,056 (trendline support).
A decisive close below 56,056 may accelerate selling pressure, opening downside targets toward: 55,342 , 53,908

OHLC Monthly Magic🎯 Simple but Powerful Trading Concept – No Indicators, No Patterns Needed!
Dear viewers,
Today, I'm sharing something so simple that most traders completely overlook it. While everyone else is busy complicating trading with fancy indicators, patterns, and strategies — I want to take you back to the basics that actually work.
✅ I’m using a Nifty chart to explain this. I’ve highlighted the previous month’s candle, and using the drawing tool’s magnet mode, I’ve plotted simple horizontal lines at the:
• Open
• High
• Low
• Close
📊 That’s it! No indicators. No patterns. Just price action from the previous month.
Now, switch to the Weekly or Daily timeframe and observe what happens around those levels. You’ll see clear supply and demand zones forming — automatically. These are the real institutional levels where price reacts strongly.
🔒 Who Should Use This?
If you're a retail trader, I do not recommend getting into intraday or index options — they are high-risk and emotionally draining, especially for beginners.
However, if you're an experienced trader and can handle the volatility, here’s how you can use this method powerfully:
📅 After marking the previous month’s OHLC levels:
• Move to the current month
• Watch how price interacts with those levels
• Combine this with RSI for extra confirmation:
📈 RSI + OHLC = High-Probability Zones
• If RSI > 60 and price is nearing the previous high — there's an 80-90% chance of a breakout.
• If RSI < 40 and price is near the previous low — expect further downside.
• We ignore the 40–60 RSI range. It’s noise. We're only focused on strong bullish or bearish momentum.
✅ Try this on stocks, crypto, forex (EUR/USD) — anything.
Once you master this concept, you won’t need any fancy indicators or complicated supply-demand theories. Just price action and momentum will guide your trades.
Thanks for watching, and apply this to see the magic yourself. Check my previous post for deeper understanding of -
Positional Trading Setup
Swing Trading Setup
Stock Options Swing Setup
And - Investment Positional Trading Setup (coming soon)
Focus on which is simple. God Blesses you All!
Faraaz T
Sr. Exec. Research Analyst - Equity
Stockholm Securities - UK

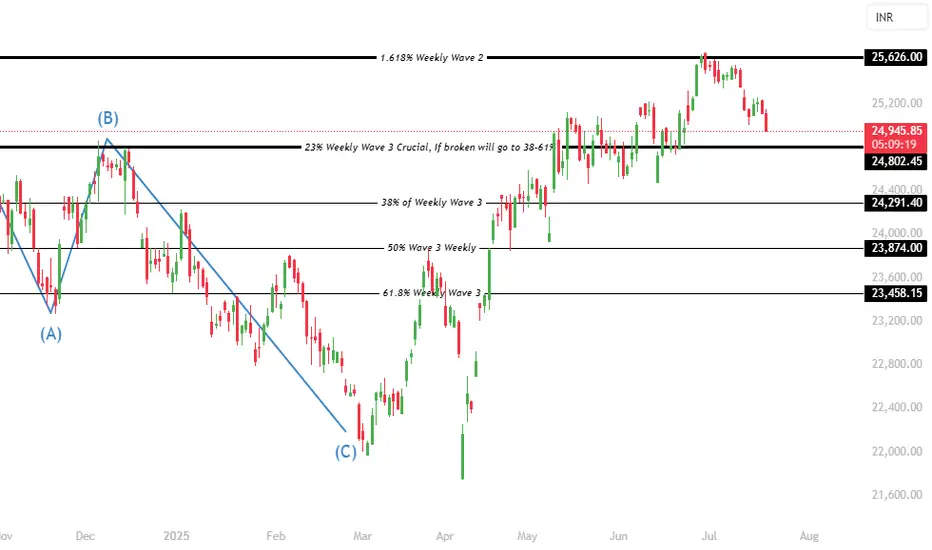
Nifty 50 Trend Analysis A detailed wave analysis in larger times frames indicates that nifty is beginning to trigger a sharp or moderate momentum deep correction. The correction & downtrend can last upto 23874 & 23458 potentially. In a downtrend, institutions will sell on every rise, hence its not the right time to make new investments directly in the stocks. Currently nifty is trading at 25073 and this swing momentum can go upto 24802 without reversals, and 24802 will play a crucial role but since the wave 3 has completed its maximum levels we need to brace for 23874 & 23458.
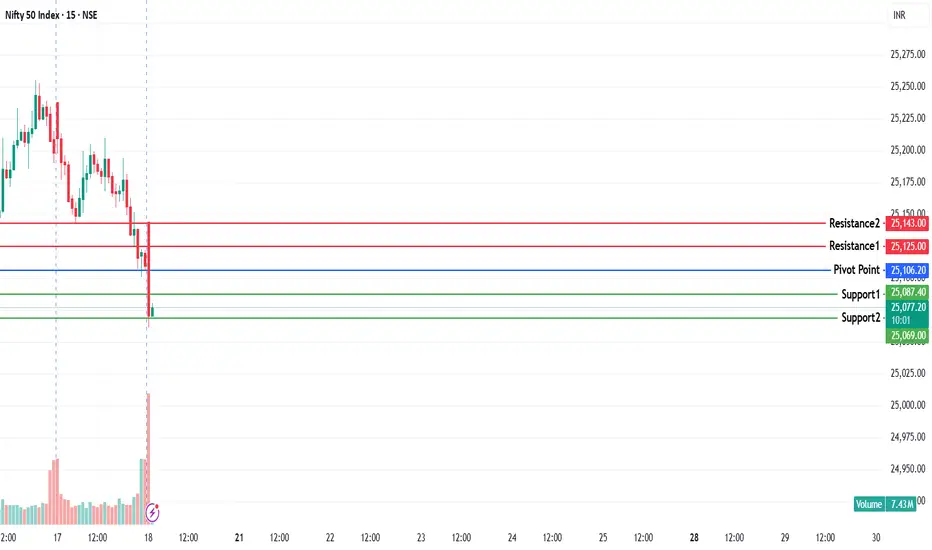
NIFTY KEY LEVELS FOR 18.07.2025NIFTY KEY LEVELS FOR 18.07.2025
If the candle stays above the pivot point, it is considered a bullish bias; if it remains below, it indicates a bearish bias. Price may reverse near Resistance 1 or Support 1. If it moves further, the next potential reversal zone is near Resistance 2 or Support 2. If these levels are also broken, we can expect the trend.
If the range is narrow, the market may become volatile or trend strongly. If the range is wide, the market is more likely to remain sideways
📢 Disclaimer
I am not a SEBI-registered financial adviser.
The information, views, and ideas shared here are purely for educational and informational purposes only. They are not intended as investment advice or a recommendation to buy, sell, or hold any financial instruments.
Please consult with your SEBI-registered financial advisor before making any trading or investment decisions.
Trading and investing in the stock market involves risk, and you should do your own research and analysis. You are solely responsible for any decisions made based on this research.
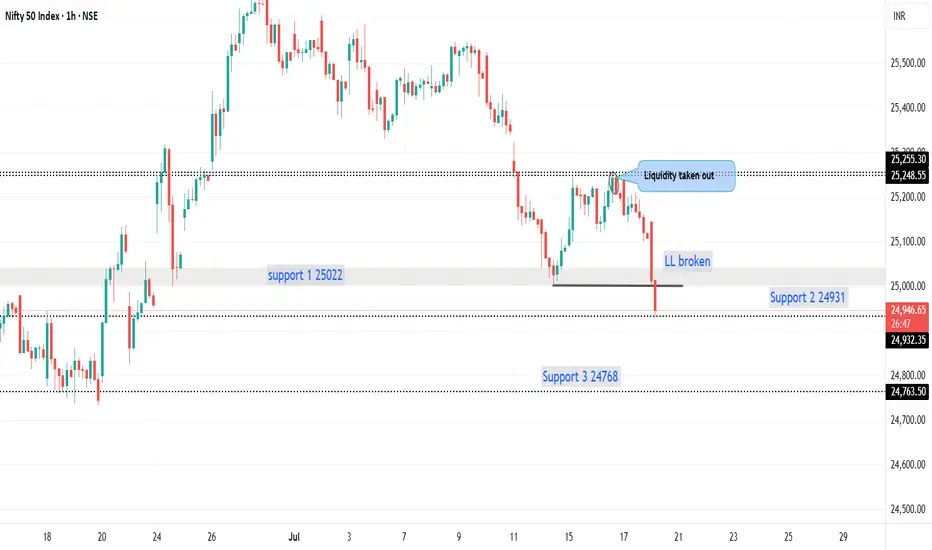
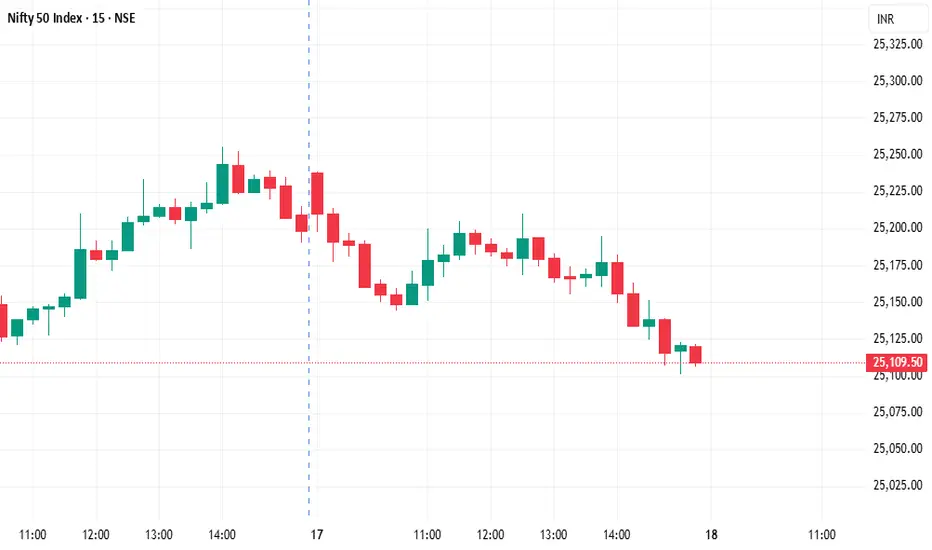
NIFTY Analysis – 18 july 2025 ,morning update at 9 amTechnical Summary
Daily Candle:
Nifty formed a negative candle after a Doji, indicating potential weakness or indecision turning bearish.
which is a sign of weakness.
Expected Opening:
May open flat near 25143 (critical level).
Upside move possible to 25218, but likely to consolidate.
Key Observation:
If Nifty fails to sustain above 25143, downside possible towards:
25023 (1st support)
24931 (2nd support)
Strategy Advice:
Wait for a clear pattern formation.
Use BOD (Buy on Dip) or SOR (Sell on Rise) strategy.
Scalping preferred due to expected sideways move.
oday's market likely to be range-bound to weak unless strong buying comes above 25143.
Avoid aggressive trades early. Watch for confirmation.
Scalping with tight SL or quick exits is preferred.
What is Sideways or Consolidation?
Sideways market = Price moves between a narrow range without clear direction.
Consolidation = Market takes a pause after a trend (up or down) and moves within a range before the next breakout.
Today's Expected Sideways / Consolidation Range in NIFTY (Spot):
Range Type Price Range (Spot)
Sideways Zone 25143 to 25218
Lower Consolidation Range 25023 to 25143
Expanded Range (if breakout) 24932 to 25278

NIFTY Levels for TodayHere are the today's NIFTY Levels for intraday (in the image below). Based on market movement, these levels can act as support, resistance or both.
Please consider these levels only if there is movement in index and 15m candle sustains at the given levels. The SL (Stop loss) for each BUY trade should be the previous RED candle below the given level. Similarly, the SL (Stop loss) for each SELL trade should be the previous GREEN candle above the given level.
Note: This idea and these levels are only for learning and educational purpose.
Your likes /boosts gives us motivation for continued learning and support.
BANKNIFTY Levels for Today
Here are the today's BANKNIFTY Levels for intraday (in the image below). Based on market movement, these levels can act as support, resistance or both.
Please consider these levels only if there is movement in index and 15m candle sustains at the given levels. The SL (Stop loss) for each BUY trade should be the previous RED candle below the given level. Similarly, the SL (Stop loss) for each SELL trade should be the previous GREEN candle above the given level.
Note: This idea and these levels are only for learning and educational purpose.
Your likes and boosts gives us motivation for continued learning and support.
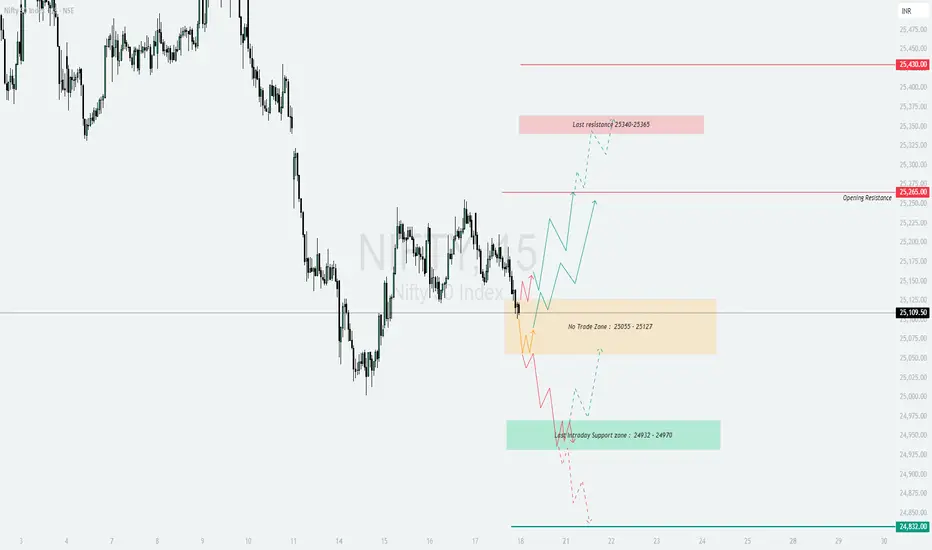
NIFTY - Trading levels and plan for 18-July-2025📊 NIFTY INTRADAY TRADING PLAN – 18-Jul-2025
Gap Opening Consideration: 100+ points from previous close
📍 KEY LEVELS TO MONITOR
🟥 Last Resistance: 25,340 – 25,365
🟥 Major Resistance: 25,430
🟧 Opening Resistance: 25,265
🟨 No Trade Zone: 25,055 – 25,127
🟩 Last Intraday Support Zone: 24,932 – 24,970
🟢 Major Support: 24,832
🚀 SCENARIO 1: GAP-UP OPENING (Above 25,365) 📈
(Gap-up considered as 100+ points above previous close)
If Nifty opens above 25,365 , it indicates bullish strength. Wait for a pullback near 25,340–25,365 for potential long entries.
If price sustains, expect a possible rally toward 25,430+ , which is the next resistance zone.
Avoid chasing entries; use 15–30 min candle confirmation to avoid false breakouts.
Options Strategy: Focus on ATM or slightly OTM Call Options or try a Bull Call Spread for limited risk.
⚖️ SCENARIO 2: FLAT OPENING (Between 25,055 – 25,127) 🟠
(Flat range aligns with the No Trade Zone )
This is a tricky zone with indecision between bulls and bears. Avoid initiating any trade immediately.
If Nifty breaks and sustains above 25,127 , bullish bias may emerge toward 25,265 – 25,340 .
On breakdown below 25,055 , a short trade setup opens targeting 24,932 – 24,970 zone .
Wait for clear hourly close before taking action in either direction.
Options Strategy: Consider Strangle or Iron Fly strategies for range-based volatility exploitation.
📉 SCENARIO 3: GAP-DOWN OPENING (Below 24,932) 🚨
(Gap-down considered below previous close by 100+ points)
If Nifty opens below 24,932 , monitor price action near the 24,832 major support .
If the support fails and prices break down below 24,832 , expect further downside pressure.
However, if price finds buying interest at 24,832 and bounces, you may consider scalping long with tight stop loss.
Options Strategy: Deploy ATM or ITM Put Options or Bear Put Spreads to play downside with defined risk.
💡 RISK MANAGEMENT & OPTIONS TRADING TIPS
🛑 Never risk more than 1–2% of your capital on any single trade.
⏳ Avoid entering trades during the first 15–30 minutes ; let volatility settle.
📉 Use Hourly candle close to determine validity of breakouts/breakdowns.
⚖️ Prefer spread strategies like Bull Call or Bear Put to cap your risk.
🧠 Avoid revenge trading after losses—stick to your trading plan.
📌 SUMMARY & CONCLUSION
Bullish View: Above 25,365, look for long opportunities up to 25,430 with stop-loss below 25,340.
Range-Bound View: Between 25,055–25,127 (No Trade Zone) – wait for breakout/breakdown confirmation.
Bearish View: Below 24,932 – focus on support at 24,832; breach can accelerate fall.
Action Plan: Wait for price behavior near key levels before committing capital.
⚠️ DISCLAIMER: I am not a SEBI-registered analyst. This analysis is for educational and informational purposes only. Please consult your financial advisor before taking any trade or investment decisions.
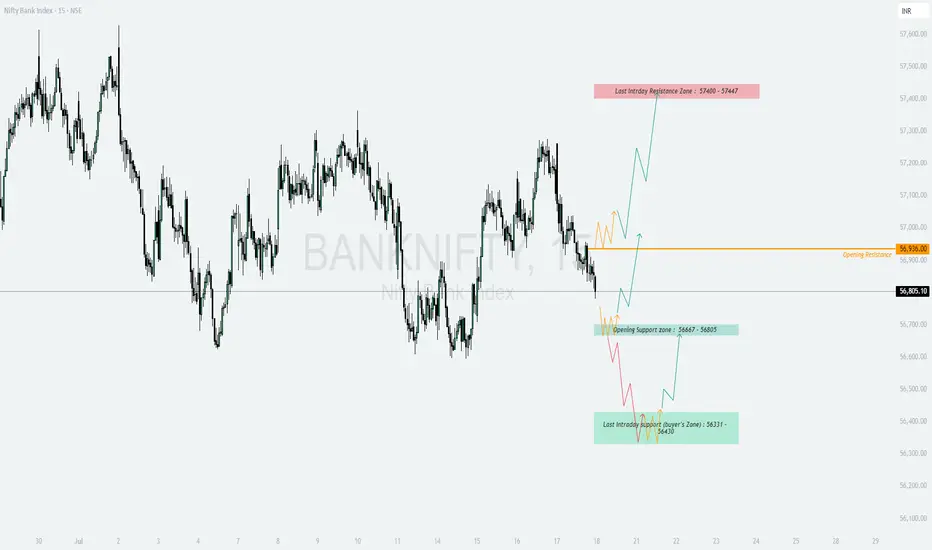
BANKNIFTY - Trading levels and Plan for 18-Jul-2025📊 BANK NIFTY INTRADAY TRADING PLAN – 18-Jul-2025
Gap Opening Reference: 200+ Points Considered Significant
📍 IMPORTANT LEVELS TO MONITOR
🟥 Last Intraday Resistance Zone: 57,400 – 57,447
🟧 Opening Resistance: 56,936
🟩 Opening Support Zone: 56,667 – 56,605
🟢 Last Intraday Support (Buyer’s Zone): 56,331 – 56,430
🚀 SCENARIO 1: GAP-UP OPENING (Above 57,136) 📈
(Gap opening considered above 200+ points from the previous close)
If Bank Nifty opens above 57,136 , strength is expected toward Last Intraday Resistance Zone: 57,400 – 57,447 .
Avoid buying immediately after the opening candle; allow 15–30 minutes for price confirmation and volatility settlement.
If price sustains above 57,400 , upside momentum may continue, but consider trailing your stop-loss as this is an exhaustion zone.
Options Tip: Consider ATM or slightly OTM Call Options or Bull Call Spread setups for controlled risk.
📊 SCENARIO 2: FLAT OPENING (Between 56,667 – 56,936) ⚖️
This range marks the equilibrium between buyers and sellers, as defined by Opening Support Zone and Opening Resistance .
Observe the first 15–30 minute candle for clear direction.
If price sustains above 56,936 , bias turns bullish toward 57,400 – 57,447 .
If price breaks below 56,667 , sellers may push Bank Nifty toward Buyer’s Zone: 56,331 – 56,430 .
Options Tip: Employ Strangle or Iron Fly strategies around flat openings with tight ranges.
📉 SCENARIO 3: GAP-DOWN OPENING (Below 56,467) ⚠️
If Bank Nifty opens below 56,467 , downside momentum may accelerate toward Last Intraday Support: 56,331 – 56,430 .
Avoid instant selling at open. Let first 15–30 minute candle give direction clarity.
If price sustains below 56,331 , weakness could extend further.
Options Tip: Focus on ATM or ITM Put Options , or Bear Put Spreads for safer downside positioning.
💡 OPTIONS TRADING RISK MANAGEMENT TIPS
📏 Risk no more than 1–2% of your capital on any single trade.
⏳ Give at least 15–30 minutes after market open before initiating trades.
🔐 Use Hourly Close-based Stop Losses to avoid getting trapped by wicks.
⚖️ Prefer hedged strategies ( Spreads, Iron Fly, Strangles ) during high IV (Implied Volatility) phases.
🚫 Avoid revenge trading. Accept stop-loss gracefully; focus on next setup.
📌 SUMMARY & CONCLUSION
Bullish Bias: Gap-up above 57,136 → Focus on 57,400–57,447 zone.
Range-bound Bias: Flat between 56,667–56,936 → Watch for breakout confirmation.
Bearish Bias: Gap-down below 56,467 → Eye on 56,331–56,430 support zone.
Prioritize confirmation from 15–30 minute opening range before acting.
Maintain strict risk management discipline using options tools like spreads.
⚠️ DISCLAIMER: I am not a SEBI-registered analyst. This trading plan is shared strictly for educational and informational purposes. Please consult your financial advisor before making any trading or investment decisions.
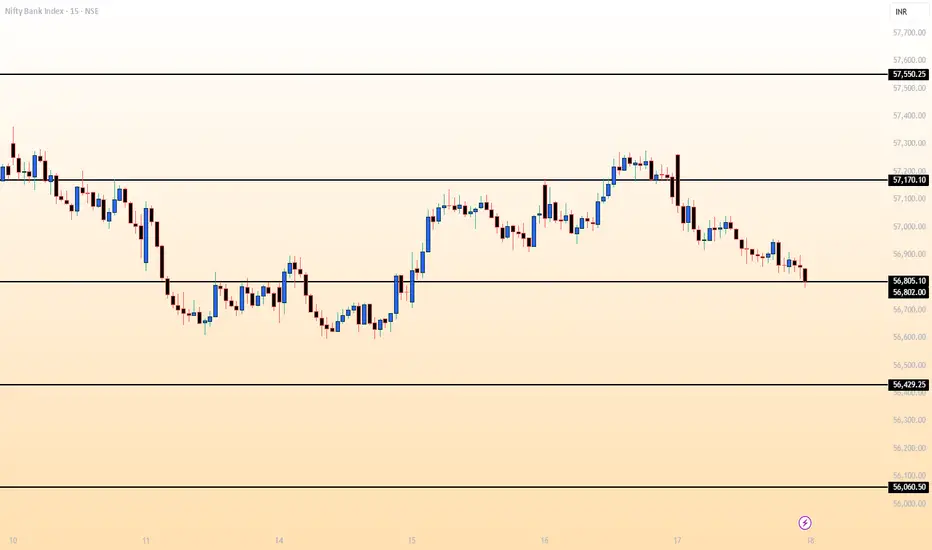
BANKNIFTY MATHEMATICAL LEVELSThese Levels are based on purely mathematical calculations.
How to use these levels :-
* Mark these levels on your chart.
* Safe players Can use 15 min Time Frame
* Risky Traders Can use 5 min. Time Frame
* When Candle give Breakout / Breakdown to any level we have to enter with High/Low of that breaking candle.
* Targets will be another level marked on chart
* Stop Loss will be Low/High of that Breaking Candle.
* Trail your SL with every candle.
* Avoid Big Candles as SL will be high then.
* This is one of the Best Risk Reward Setup.
For Educational purpose only
NIFTY MATHEMATICAL LEVELSThese Levels are based on purely mathematical calculations.
Validity of levels are upto expiry of current week.
How to use these levels :-
* Mark these levels on your chart.
* Safe players Can use 15 min Time Frame
* Risky Traders Can use 5 min. Time Frame
* When Candle give Breakout / Breakdown to any level we have to enter with High/Low of that breaking candle.
* Targets will be another level marked on chart
* Stop Loss will be Low/High of that Breaking Candle.
* Trail your SL with every candle.
* Avoid Big Candles as SL will be high then.
* This is one of the Best Risk Reward Setup.
For Educational purpose only

Nifty call for 18-07-250Nifty may open slightly gap up as per SGX NIFTY. A long red candle was formed in yesterday trading in the nifty. Nifty has fallen in yesterday since opening levels which is indicated weaknes of the buyers. Investors are focusing on individual stocks instead of Index which have announced quartely earnings recently. NUVOCO VISTAS CORP, INDIAN HOTELS are announced good numbers during market hours so investors can add those stocks to their portfolios at support levels.
Support levels : 25100,25059
Resistance levels : 25170,25240
Disclimer : I AM NOT A SEBI RESEARCH ANALYST OR FINANCIAL ADVISOR, these recommendations are only for education purpose, not for trading and investment purpose please take an advise from your financial advisor before investing on my recommendations.
🙏 : If you liked my content please suggest to your friends follow my trading channel. Your likes and comments provide boosting to me to update more financial information.
Thanking you

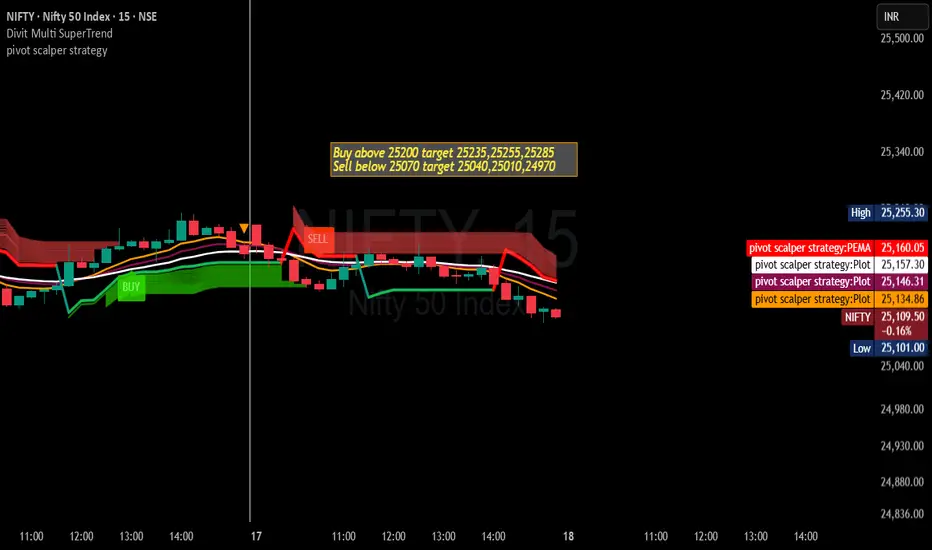
Nifty Trading Strategy for 18th July 2025🔼 BUY Setup
📍 Condition: Buy only if 1-hour candle closes above ₹25,200
🎯 Targets:
➤ Target 1: ₹25,235
➤ Target 2: ₹25,255
➤ Target 3: ₹25,285
🛡️ Stop Loss: Below ₹25,170 or as per your risk tolerance.
🧭 Use confirmation from RSI/MACD/Volume before entry.
🔽 SELL Setup
📍 Condition: Sell only if 15-min candle closes below ₹25,070
🎯 Targets:
➤ Target 1: ₹25,040
➤ Target 2: ₹25,010
➤ Target 3: ₹24,970
🛡️ Stop Loss: Above ₹25,100 or per your system.
✅ Instructions & Tips:
🔹 Wait for candle close confirmation before entering.
🔹 Do not jump in on wicks or fakeouts.
🔹 Follow strict risk management (1–2% of capital).
🔹 Always use SL (Stop Loss) and set alerts.
🔹 Check news/events before market hours.
⚠️ Disclaimer:
🔸 I am not a SEBI-registered analyst.
🔸 This analysis is shared for educational and informational purposes only.
🔸 Please do your own research or consult a registered financial advisor before trading.
🔸 Trading and investing in the stock market involve significant financial risk. Proceed at your own discretion.
Nifty may nosedive from here! So that missing piece - closing above 25200 - we lost again.
Reason - FIIs are taking out cash from Indian market as per data.
Why? Because they sense many big companies might report negative earning - hence index trading is not suitable for them.
During Quarterly Earning Season, promoters shift their money from one to another. Mutual funds rebalance their portfolio from weak to stronger. And Institutional Money like FII don't like surprises on their positions. They go with the plan.
If I would have been the FII, what I would be doing is - wait for the earnings to announced and then see which companies have given great results and which have their sales increased. Then, after the Earning Season is over, I'll re-position myself with clean charts. Avoid any volatality. Any surprises.
So that's why they are doing exactly.
Because of that, maybe your setups won't work like they do in usual condition. So if you feel you're getting stuck or Stoloss hitting more than normal, dont be surprised.
A good practice would be to stay away from trading for while and let the market settle for a bounce back.
However, I'm a professional trader and I need to earn in any market condition. Hence I have strategy for every situation.
Me and my students use Earning Pivot to give ourselves an edge against unpredictable market structure during Earning Seasons.
So this would be wise to stick to this setup only for a time being.
Coming to the market, NSE:NIFTY has given a Supply candle today with sellers outnumbering buyers by 93 million volume.
Now if 25000 is broken we can see a deeper cut in the index. Maybe near 24750.
However, the immediate support is at 24980. Resistance now at 25155.
If we get a bounce to this, we can build a short position. Yeah, from now on market might turn on Sell-on-Rise mode.
NSE:BANKNIFTY short term support formed at 56050. Resistance 56965.
Many IPO stocks are showing good strength with bullish structure. Hence I will be focusing there.
Today I traded just one stock and also given here to all of you and that hit Upper Circuit. Remember it was from IPO sector. Name is GETTEX:NSE :#IXIGO.
Traded NSE:ANANDRATHI as Intraday and got 4% upside in that as well. So overall the day ended in positive note for our community. Cheers on that!
That would be all for today. Take care. Have a profitable day ahead.

NIFTY FOR 18-07-2025Dear Learner,
Today session bearishness has been shown, so sellers are dominating, so overall market can be seen bearish side
Bearish -> After OPEN, may test to 25080, 25000, 25933 then 25855
Thank You, Rest will be after OPENING, Have a profitable day !
Disclaimer: This is not for BUY or SELL recommendation, do your own analysis or consult your financial adviser before entering into the trade, this is only my view for educational purpose.

We are still strong above 25000!!As we can see, NIFTY showed minor correction despite its rejection from important demand zone but we are still strong as long as we are above 25000 psychological level hence we should plan buying on every drip keeping stoploss below 25000 level closing basis so plan your trades accordingly and keep watching everyone.

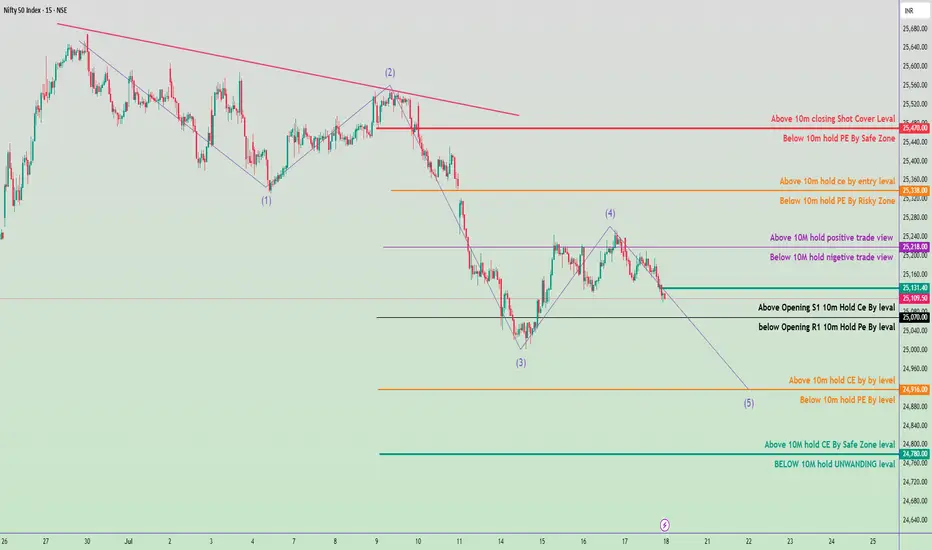
Trade plan for tomorrow (July 18, 2025)📈 Bullish Trade Plan (Alternative Scenario)
✅ S etup 3: Call Option Trade (CE)
Trigger: Price moves above 25,218 with volume
Action: Buy 25,200 CE or 25,300 CE
Target 1: 25,338
Target 2: 25,470
Bearish Trade Plan (Primary Bias)
✅ Setup 1: Directional Put Option Trade (PE)
Trigger: Break below 25,070
Action: Buy 25,000 PE or 24,900 PE
Target 1: 25,000
Target 2: 24,916
Target 3: 24,780
Current Context:
Nifty is forming a classic Elliott Wave pattern, currently likely in Wave (5) down.
Trend: Bearish bias unless 25,218 is reclaimed.
Key Support Zone: 25,070 – 25,000
High Probability Target for Wave (5): Around 24,780–24,760