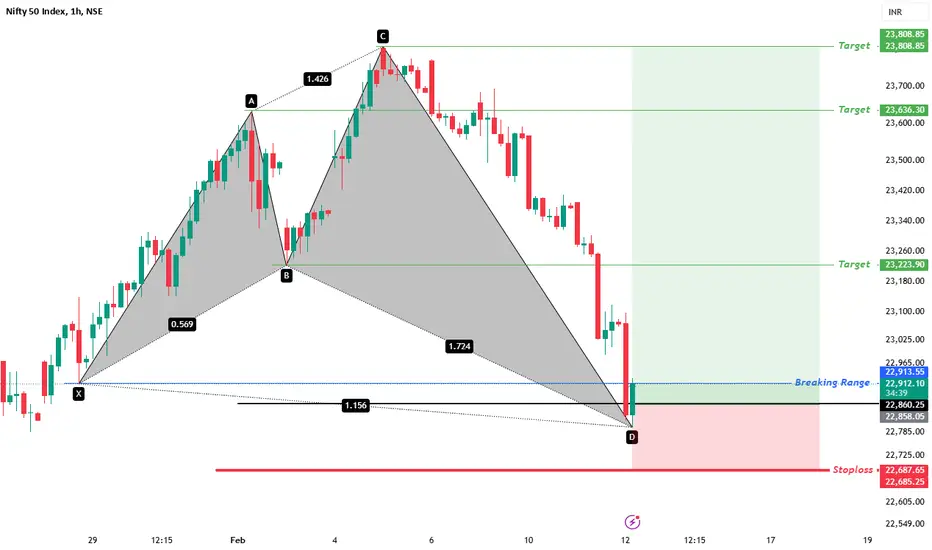
Nifty Next moveSL 1Hr candle close only, Target Trigger Price
All detail for chat. good entry at mark price only. and must stoploss minimum risk and good profit. risk ratio 1:1 to manage modified SL. This is not call, Just my idea. Please understand your risk and take full responsibility of your actions
Market indices

Nifty Intraday Analysis for 12th February 2025NSE:NIFTY
Index closed near 23070 level and Maximum Call and Put Writing near CMP as below in current weekly contract:
Call Writing
23500 Strike – 99.23 Lakh 23400 Strike – 79.45 Lakh
23300 Strike – 71.23 Lakh
Put Writing
22500 Strike – 91.19 Lakh
22700 Strike – 84.36 Lakh
22800 Strike – 61.43 Lakh
Index has resistance near 23250 - 23300 range and if index crosses and sustains above this level then may reach near 23450 - 23500 range.
Index has immediate support near 22850 – 22800 range and if this support is broken then index may tank near 22650 – 22600 range.

Banknifty Intraday Analysis for 12th February 2025NSE:BANKNIFTY
Index closed near 49405 level and Maximum Call and Put Writing near CMP as below in February Month contract:
Call Writing
50000 Strike – 11.68 Lakh
50500 Strike – 10.74 Lakh 49500 Strike – 7.54 Lakh
Put Writing
49000 Strike – 13.43 Lakh
50000 Strike – 10.32 Lakh
49500 Strike – 8.36 Lakh
Index has resistance near 49800 – 49900 range and if index crosses and sustains above this level then may reach near 50400 – 50500 range.
Index has immediate support near 48900 - 48800 range and if this support is broken then index may tank near 48400 - 48300 range.

Finnifty Intraday Analysis for 12th February 2025NSE:CNXFINANCE
Index closed near 23090 level and Maximum Call and Put Writing near CMP as below in February Month contract:
Call Writing
23500 Strike – 1.59 Lakh
23000 Strike – 0.56 Lakh
23200 Strike – 0.22 Lakh
Put Writing
23500 Strike – 1.15 Lakh
23000 Strike – 0.70 Lakh
23400 Strike – 0.64 Lakh
Index has resistance near 23250 - 23300 range and if index crosses and sustains above this level then may reach near 23450 - 23500 range.
Index has immediate support near 22950 – 22900 range and if this support is broken then index may tank near 22750 – 22700 range.

Midnifty Intraday Analysis for 12th February 2025NSE:NIFTY_MID_SELECT
Index closed near 11470 level and Maximum Call and Put Writing near CMP as below in February Month contract:
Call Writing
11700 Strike – 2.38 Lakh
11500 Strike – 2.27 Lakh
11600 Strike – 1.85 Lakh
Put Writing
11500 Strike –6.10 Lakh
11400 Strike – 2.55 Lakh
11300 Strike – 2.09 Lakh
Index has immediate resistance near 11600 – 11650 range and if index crosses and sustains above this level then may reach 11800 – 11850 range.
Index has immediate support near 11350 – 11300 range and if this support is broken then index may tank near 11150– 11100 range.

Nifty - Expiry day analysis Feb 13Price took double bottom support as per daily chart. 23100 zone is the trend deciding zone as of now. Price was unable to sustain above 23100 today. How to take trade tomorrow?
Buy above 23140 with the stop loss of 23100 for the targets 23180, 23220, 23260 and 23320.
Sell below 23060 with the stop loss of 23020, 22980, 22940, 22900 and 22860.
Expected expiry day range is 22900 to 23300.
Do your own analysis before taking any trade.

BankNifty levels - Feb 13, 2025Utilizing the support and resistance levels of BankNifty, along with the 5-minute timeframe candlesticks and VWAP, can enhance the precision of trade entries and exits on or near these levels. It is crucial to recognize that these levels are not static, and they undergo alterations as market dynamics evolve.
The dashed lines on the chart indicate the reaction levels, serving as additional points of significance. Furthermore, take note of the response at the levels of the High, Low, and Close values from the day prior.
We trust that this information proves valuable to you.
* If you found the idea appealing, kindly tap the Boost icon located below the chart. We encourage you to share your thoughts and comments regarding it.
Wishing you successful trading endeavors!

Nifty levels - Feb 13, 2025Nifty support and resistance levels are valuable tools for making informed trading decisions, specifically when combined with the analysis of 5-minute timeframe candlesticks and VWAP. By closely monitoring these levels and observing the price movements within this timeframe, traders can enhance the accuracy of their entry and exit points. It is important to bear in mind that support and resistance levels are not fixed, and they can change over time as market conditions evolve.
The dashed lines on the chart indicate the reaction levels, serving as additional points of significance to consider. Furthermore, take note of the response at the levels of the High, Low, and Close values from the day prior.
We hope you find this information beneficial in your trading endeavors.
* If you found the idea appealing, kindly tap the Boost icon located below the chart. We encourage you to share your thoughts and comments regarding it.
Wishing you success in your trading activities!

NIFTY- Intraday Levels - 13th and 14th February 2025As levels are for next two days adding all the possible and important levels.
If NIFTY sustain above 23087 to 23097 above this bullish around 23135 above this more bullish then 23228 the 23273 to 23283 then around 23350 to 23370 next levels are on chart
If NIFTY sustain below 23022 to 23000 below this bearish then 22989 to 22882 below this more bearish then around 22813 then 23735 then 23704 to 23686 next levels are on chart
My view (for your study and analysis only, also conside my analysis could be wrong and to safegaurd the trade risk management is must) Probably sell on rise.
Consider some buffer points in above levels.
Please do your due diligence before trading or investment.
**Disclaimer -
I am not a SEBI registered analyst or advisor. I does not represent or endorse the accuracy or reliability of any information, conversation, or content. Stock trading is inherently risky and the users agree to assume complete and full responsibility for the outcomes of all trading decisions that they make, including but not limited to loss of capital. None of these communications should be construed as an offer to buy or sell securities, nor advice to do so. The users understands and acknowledges that there is a very high risk involved in trading securities. By using this information, the user agrees that use of this information is entirely at their own risk.
Thank you.

NIFTY SET UP - Down move ContinuationAfter prev day downmove Market rejected from 0.23 fib got rejected from prev day zone (retest) & trendline breakdwon, downmove continued

Nifty - Weekly Review Feb 10 to Feb 14Price is moving in a slow downtrend and also it is forming channel. Double bottom support zone is seen at 23450. Price have to sustain above this level to be bullish. Bearish below the zone 23450.
Buy above 23460 with the stop loss of 23420 for the targets 23500, 23560, 23600, 23660, 23720 and 23760.
Sell below 23380 with the stop loss of 23420 for the targets 23340, 23300, 23240 and 23180.
Do your own analysis before taking any entry. Analysis is for entertainment purpose only.

BankNifty Spot Actionable Idea 12 feb 25BankNifty Spot Actionable Idea
#Current Price- 49450
#Resistance- 49465
#Support- 49200
#Target 49690 And 49900 we can expect after a break of Resistance
#Target 50150 And 50600 we can expect after a break of Support
#Execution only after break and close above or below from resistance or support 15-minute candle.
#Stop Loss above or below from resistance or support 15-minute candle.
NOTE- Only for Education Purpose.

Inverted Head & Shoulder in NIfty at 15 min timeframeAfter a good fall market may rebound look at H&S-Inverted pattern---Bullish

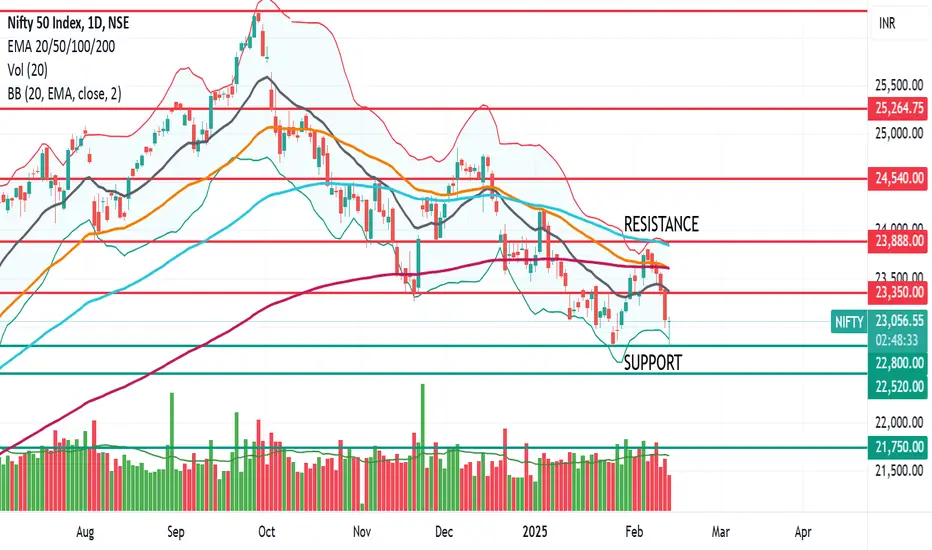
Recovery in NIFTY 50??Nifty 50 has recovered from today's low of 22,788 levels to 23, 097.
Thus, 22,800 can be considered as the strong support level.
Any fall below 22,800 could be devastating for the sentiments of retail and short to medium-term investors.
Long-term investors need not worry, as the monthly chart shows bullish mode only with 20 EMA comfortably trading above 50 EMA and 200 EMA
However, the weekly chart shows that the 20 EMA line is trending downwards and just above the 50 EMA.
Thus, the overall sentiment seems bearish, and a strong closing above 23,350 is needed to enhance investor confidence.
Resistance: 23350, 23888, 24540
Support: 22800, 22520, 21750
CNX 500Hello & welcome to this analysis
The index in daily time frame is retesting a Bullish Harmonic Gartley pattern made in end January which coincides with the formation of a wedge pattern and a double bullish divergence.
A bounce back could be possible if it manages to start sustaining above 20850 for 21500-22500 however, if it breaches the lower trendline of the wedge then a lot more downside would become inevitable.
Harmonic Trading Patterns are formed in a combination of structures and Fibonacci ratios. When they align and give a reversal candle follow through a strong bounce/reversal probability is relatively high.
Wait for confirmation and enter only then, in case of breach of falling trendline avoid the signal.
Regards

Nifty Market UpdateNifty is testing a key support level, the same zone from which it bounced back on January 27. While a short-term upward movement is possible, this should not be mistaken for a bullish reversal.
🔹 The overall structure remains weak as Nifty has been forming lower lows since September 2024. Given this uncertainty, fresh long positions should be avoided until a clear trend emerges.
🔹 Patience is key—it's better to wait a few weeks or months rather than enter trades in an unpredictable market.
🔹 Last week, many traders speculated that Nifty had broken out of a falling wedge, anticipating a strong uptrend. However, my primary concern is that it has broken below the green trendline, which may now act as strong resistance in the near term.
📌 Trading Advice: Wait for a decisive breakout or confirmation before taking new positions. Let the market provide clarity before making moves.

NIFTY TOTAL MARKET @ 11660 BULL or BEAR?NIFTY TOTAL MARKET @ 11660 BULL or BEAR?
RESISTANCES: 11977/12355
SUPPORTS: 11677
Downside minimum target done at 11621.
Extension can be 11230.
But as of now, I expect good reversal from this zone.
Seasonality down move completed?
If so, we will see steady growth till July-Aug 2025.
Let us wait and watch.

Nifty Next Move SL 1Hr candle close only, Target Trigger Price
All detail for chat. good entry at mark price only. and must stoploss minimum risk and good profit. risk ratio 1:1 to manage modified SL. This is not call, Just my idea. Please understand your risk and take full responsibility of your actions
NIFTY Ready to Hit 18600 ??If you observer Weekly candle of Nifty 50 Bearish candle for Mation formed & also Nifty break long uptrend Channel today Close below Previous Low That Is 22786 Confirm Free Fall till 18600 ?????
NIFTY 18600 Free Fall ?


Nifty 50: Market Structure Break on 60-Hour TimeframeMarket Structure Break: The 60-minute timeframe shows a clear structural break, pushing prices into a premium zone.
Premium to Discount Retracement: Given the overextended nature of the premium zone, a retracement to a discount zone is expected.
Potential Reversal: The retracement could lead to a reversal, where market momentum shifts, creating a more balanced trading environment.
Consolidation Point: The market is likely to consolidate around the 23400 level, a critical juncture that corresponds with the FVG and discount zone, serving as a potential springboard for future upward movement.
Traders should monitor the price action closely in the discount zone for signs of reversal confirmation.

NIFTY - 12-02-2025Yesterday, Nifty 50 saw a sharp decline of 300 points, driven by heavy selling in overvalued small-cap stocks with weak earnings. The index formed a long bearish candle, indicating a shift in support levels down to 22,700.
For today, the market is expected to remain range-bound, with premiums declining on both sides, particularly on call options.

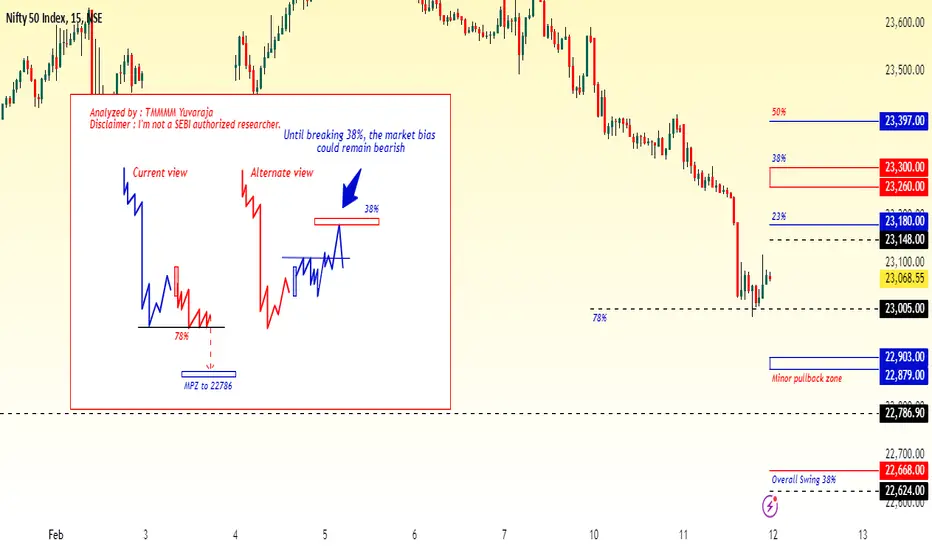
#Nifty directions and levels for February 12th:Good morning, Friends! 🌞
Here are the market directions and levels for February 12th:
Market Overview
There have been no significant changes in the global or local markets. The global market continues to maintain a bullish sentiment (as indicated by the Dow Jones), while the local market is showing a moderately bearish sentiment. Today, the market may open with a neutral to slight gap-up, as the GiftNifty indicates a positive sign of 60 points.
In the previous session, both Nifty and Bank Nifty fell drastically, but by the end of the session, they could take a minor pullback. What about today? The structure seems to have a bearish bias. If the gap-up doesn't sustain, we can expect a continuation of the correction when it breaks the previous day's low. On the other hand, if the gap-up sustains, it could consolidate between the previous day's low and the 38% mark. This is the basic structure; let's look at the charts.
We are following the same sentiment we observed in the previous session. Today as well, both Nifty and Bank Nifty have similar structures.
Nifty Current View:
The current view suggests that based on the structure, the gap-up may not sustain. If the market starts to decline, it could reach a minimum of 22,903 once it breaks the previous day's low. After that, if it consolidates or breaks this level, we can expect a continuation of the correction. On the other hand, if it finds support there, it could take a maximum pullback of 23% to 38% in the minor swing. Structurally, this pullback has a lower probability.
Alternate View:
The alternate view suggests that if the market sustains the gap-up, it could reach a minimum of the 23% to 38% mark. However, the 38% level is a major resistance level. If the market rejects this level, it may consolidate between the 38% and the previous day's low with a bearish bias. However, if the market breaks the 38% level with a strong candle or after some minor consolidation, it could reach the 50% level.