Nifty - Acting like a stubborn lad!Nifty is not accepting the upside move. Wha's holding it - No brownie points for the correct guess. But what to expect next - Watch the video to know.
Market indices

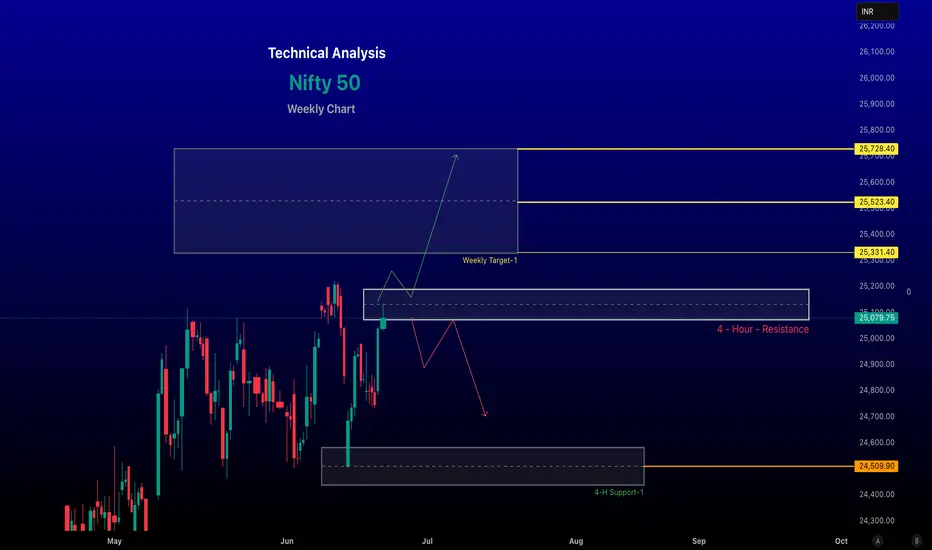
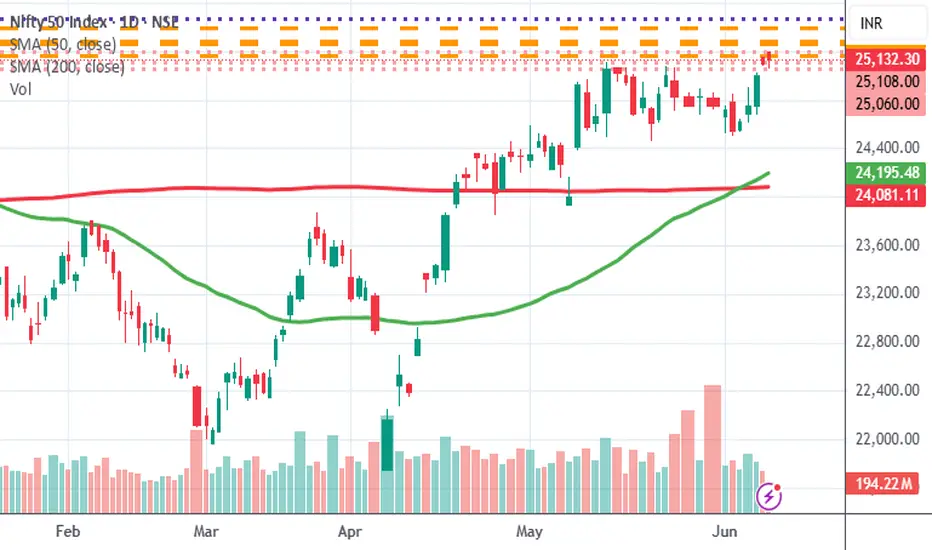
Nifty 50 Weekly Technical Analysis for June 23 – June 27 , 2025# Here's a concise technical analysis of the NIFTY 50 Index based on the latest available data as of June 20, 2025:
-- Current Market Snapshot --
Closing Price: The NIFTY 50 closed at approximately 25,100, with a significant daily gain of over 1,046 points for the Sensex, indicating strong bullish momentum.
Recent Trend: The index has been trading within a tight consolidation range (24,350–25,250) since mid-May 2025, forming a rectangular pattern. A breakout above 25,100 could signal further upside.
Daily Movement: On June 18, the NIFTY rebounded strongly from an intraday low below 24,800, reclaiming 24,900, supported by broad-based buying across sectors like auto, financial services, FMCG, pharma, and realty.
Key Technical Levels
Resistance:
Immediate: 25,114–25,215 (crucial for bullish momentum). A sustained break above 25,215 could target 25,340–25,700.
Major: 25,484–25,600, where profit booking may occur.
Support:
Immediate: 24,400–24,600 (key to maintaining bullish bias).
Stronger: 24,600 (break below could attract short sellers) and 24,374 (major demand zone).
Historical Context: The index reached its all-time high of 26,277.35 on September 27, 2024, and is currently ~4.5% below that level
-- Disclaimer --
This analysis is based on recent technical data and market sentiment from web sources. It is for informational purposes only and not financial advice. Trading involves high risks, and past performance does not guarantee future results. Always conduct your own research or consult a SEBI-registered advisor before trading.
#Boost and comment will be highly appreciated
NIFTY 50 Bullish Continuation Above 25,000 Support – Short-Term Nifty 50 is showing strong bullish structure on the 15-minute timeframe, holding firm above the key support zone around 24,999. After a clean breakout and retest of this level, a higher low has formed, indicating a continuation of the uptrend.
I’m anticipating further upside movement with the following setup:
Entry: Near 25,000–25,050
Target: 25,400
Stop Loss: Below 24,920
Bias: Bullish
Timeframe: 15 min intraday setup
The recent higher high and higher low structure supports bullish momentum. Price action above 25,000 will be crucial to maintain this bullish view.

Nifty 1 hour- Waiting to start momentumKey Observations:
🔹 Support Zone:
Around 24,400 - 24,450
Price has bounced from this area multiple times, indicating strong buying interest here.
🔹 Resistance Zone:
Around 25,200 - 25,250
Price has been rejected from this area several times, showing selling pressure.
🔹 Price Action:
Currently, price is trading near 24,958, close to the midpoint of the range. It attempted to move towards resistance but faced some selling pressure.
What Traders Should Watch:
✅ Range Trading Opportunity:
As long as price remains within this range, one can look for buying near support and selling near resistance with strict stop-loss.
✅ Breakout/Breakdown Levels:
Above 25,250: If price gives a strong breakout with volume, we may see bullish momentum.
Below 24,400: Breakdown can lead to further downside.
✅ Volume:
Noticeable spikes in volume around certain candles — a breakout with high volume will be more reliable.
Summary:
This is a classic sideways market. Until we get a clear breakout or breakdown, avoid aggressive trades. Range-bound strategies like buying at support and selling at resistance are ideal here.

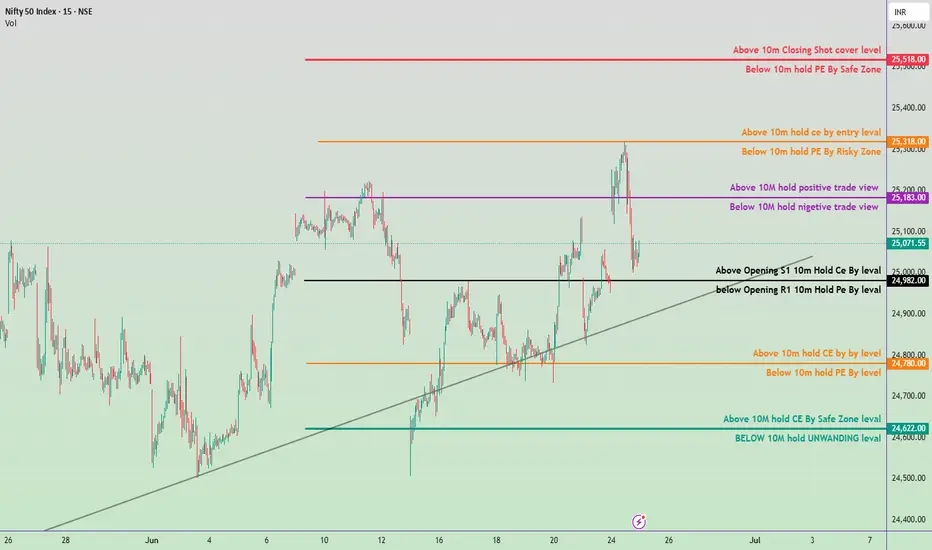
June 25, Nifty 50 intraday trade plan for tomorrow✅ Bullish Zones (Call Buyer Favorable):
🔺 Above 25,518
→ Closing short-covering level
Strong breakout / upside momentum
🟧 Above 25,318
→ 10M hold CE by entry level
Safe CE entry zone
🟪 Above 25,183
→ Positive trade view zone
⚫ Above 24,982
→ Opening S1 CE hold level
🟩 Above 24,622
→ Safe zone for CE buying
❌ Bearish Zones (Put Buyer Favorable):
🔻 Below 25,518
→ Safe zone for PE buyers
🟧 Below 25,318
→ Risk zone for PE buyers
🟪 Below 25,183
→ Negative trade view zone
⚫ Below 24,982
→ Opening R1 PE hold level
🟧 Below 24,780
→ 10M PE hold level
🟦 Below 24,622
→ Unwinding zone – Weak market signal
📊 Tomorrow’s Trading Strategy
Opening Above 25,183
Look for CE Buying Opportunities.
Target 25,318 → 25,518.
Opening Between 25,071–24,982
Neutral to cautious zone.
Wait for price action confirmation near key levels.
Opening Below 24,780
Look for PE Buying or CE Selling.
Possible test of 24,622 → 24,500 zone.
Trendline Support Near 24,850
If broken, expect downside acceleration.
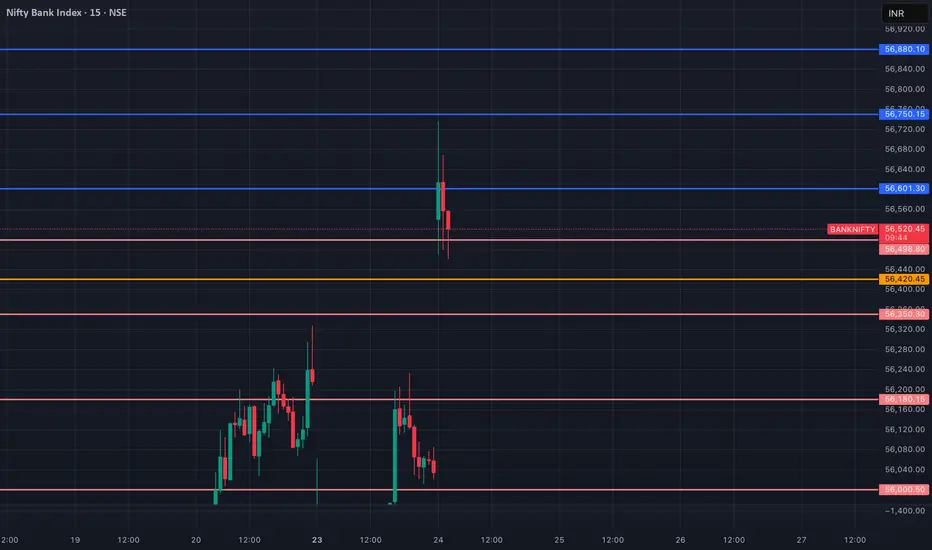
BANKNIFTY Intraday Live Session 24 JUN Breakout/Breakdown Levels NSE:BANKNIFTY – Key Levels Setup | Breakout or Breakdown Scenario
According to the price action observed at session start , NSE:BANKNIFTY is currently consolidating between the resistance at 56,673 and the support at 56,589 . The structure suggests price is coiling, and a decisive move beyond either level could trigger a directional breakout.
• Key Levels:
Resistance: 56,673
Support: 56,589
• Breakout Scenario:
If price breaks and sustains above 56,673 :
TP1 (1:1): 56,757
TP2 (1:2): 56,841
TP3 (1:3): 56,925
• Breakdown Scenario:
If price breaks and sustains below 56,589 :
TP1 (1:1): 56,505
TP2 (1:2): 56,421
TP3 (1:3): 56,337
"Stay neutral, stay ready. Let the chart pick the direction."
Information and analysis provided is for educational purposes only.

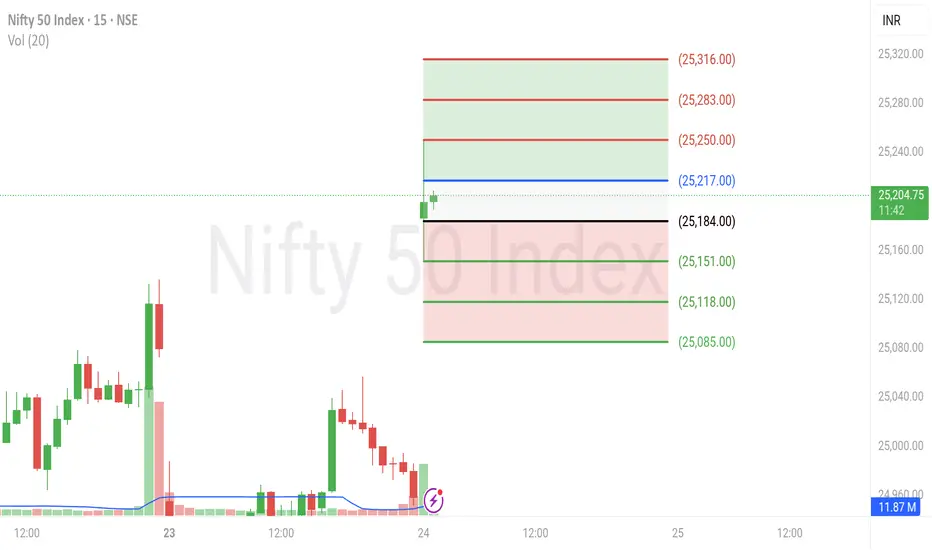
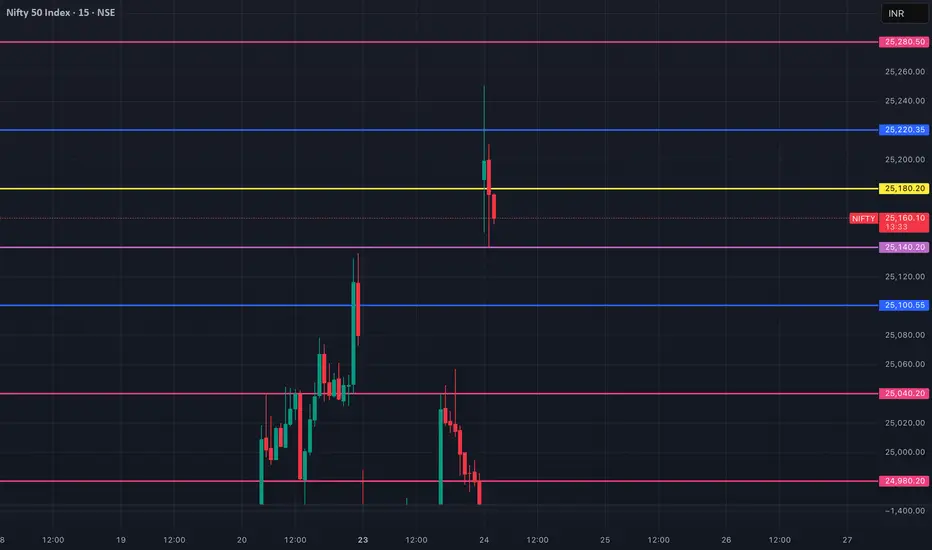
NIFTY 50 Intraday Live Session| 24 JUN Breakout/Breakdown Levels NSE:NIFTY – Key Levels Setup | Breakout or Breakdown Scenario
According to the price action observed at session start , NSE:NIFTY is currently consolidating between the resistance at 25,217 and the support at 25,184 . The structure suggests price is coiling, and a decisive move beyond either level could trigger a directional breakout.
• Key Levels:
Resistance: 25,217
Support: 25,184
• Breakout Scenario:
If price breaks and sustains above 25,217 :
TP1 (1:1): 25,250
TP2 (1:2): 25,283
TP3 (1:3): 25,316
• Breakdown Scenario:
If price breaks and sustains below 25,184 :
TP1 (1:1): 25,151
TP2 (1:2): 25,118
TP3 (1:3): 25,085
"Stay neutral, stay ready. Let the chart pick the direction."
Information and analysis provided is for educational purposes only.
Nifty Intraday Analysis for 24th June 2025NSE:NIFTY
Index has resistance near 25150 – 25200 range and if index crosses and sustains above this level then may reach near 25350 – 25400 range.
Nifty has immediate support near 24825 – 24775 range and if this support is broken then index may tank near 24550 – 24500 range.
Banknifty Intraday Analysis for 24th June 2025NSE:BANKNIFTY
Index has resistance near 56500 – 56600 range and if index crosses and sustains above this level then may reach near 57000 – 57100 range.
Banknifty has immediate support near 55500 - 55400 range and if this support is broken then index may tank near 55000 - 54900 range.

Finnifty Intraday Analysis for 24th June 2025NSE:CNXFINANCE
Index has resistance near 26750 - 26800 range and if index crosses and sustains above this level then may reach near 27000 - 27050 range.
Finnifty has immediate support near 26350 – 26300 range and if this support is broken then index may tank near 26100 – 26050 range.

Midnifty Intraday Analysis for 24th June 2025NSE:NIFTY_MID_SELECT
Index has immediate resistance near 13175 – 13200 range and if index crosses and sustains above this level then may reach 13350 – 13375 range.
Midnifty has immediate support near 12900 – 12875 range and if this support is broken then index may tank near 12750 – 12725 range.
Moving Average Combo for Daily Stock ChartsMoving averages are one of the most fundamental tools in technical analysis, and combining them can give you a clearer picture of trend direction, support/resistance, and momentum.
On daily stock charts, the right moving average combo can help traders identify both short-term and long-term opportunities with more confidence.
Why Use Moving Averages?
Moving averages smooth out price data and help highlight the underlying trend. They can also act as dynamic support or resistance levels and signal potential entry or exit points through crossovers.
Popular Moving Average Combinations
20 EMA + 50 EMA
Use Case: Ideal for identifying medium-term trends.
Signal: A bullish crossover (20 EMA crossing above 50 EMA) may indicate a buying opportunity, while a bearish crossover can signal a potential exit or short.
50 EMA + 200 EMA (Golden Cross/Death Cross)
Use Case: Best for long-term trend analysis.
Signal: A Golden Cross occurs when the 50 EMA crosses above the 200 EMA—often seen as a strong bullish signal. A Death Cross (opposite) is a bearish sign.
9 EMA + 21 EMA
Use Case: Useful for active traders or swing traders.
Signal: Offers quicker signals for fast-moving stocks.
Tips for Using on TradingView
Add multiple EMA indicators with different periods (e.g., 9, 21, 50, 200).
Use color coding to avoid confusion.
Look for price interactions with moving averages for entry or exit points.
Conclusion
No single moving average works in all conditions. The key is to combine them based on your trading timeframe and style. On daily charts, these combos help filter the noise and reveal the true direction of the stock.
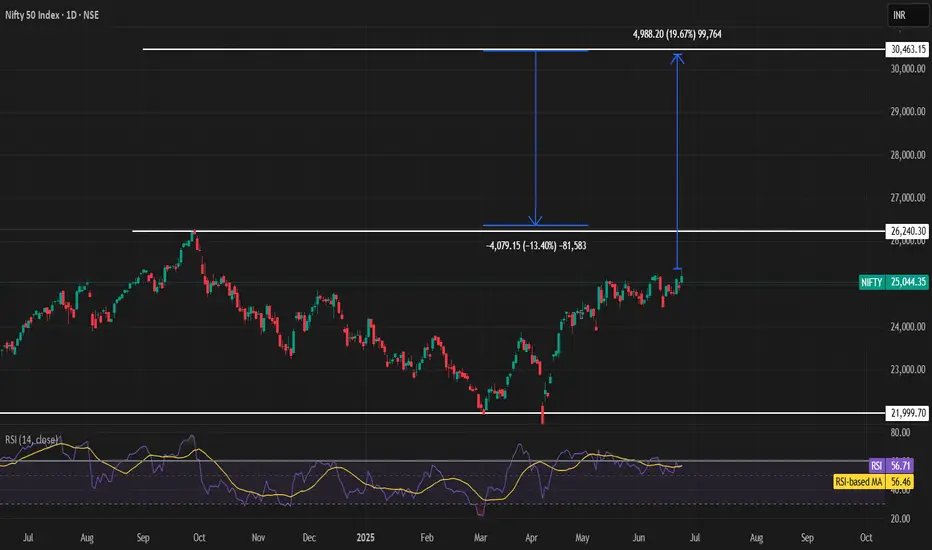
Nifty spot in next 6 month july - Dec 2025 Nifty can move in range 27000 on upside 22000 on downside .If nifty this month manages to close above 25000 levels then nifty in next 4-5 weeks can attempt to move towards 26000 level and above . major support at 24500 of this momentum if weekly start closing below this levels bullish moment view might fail .


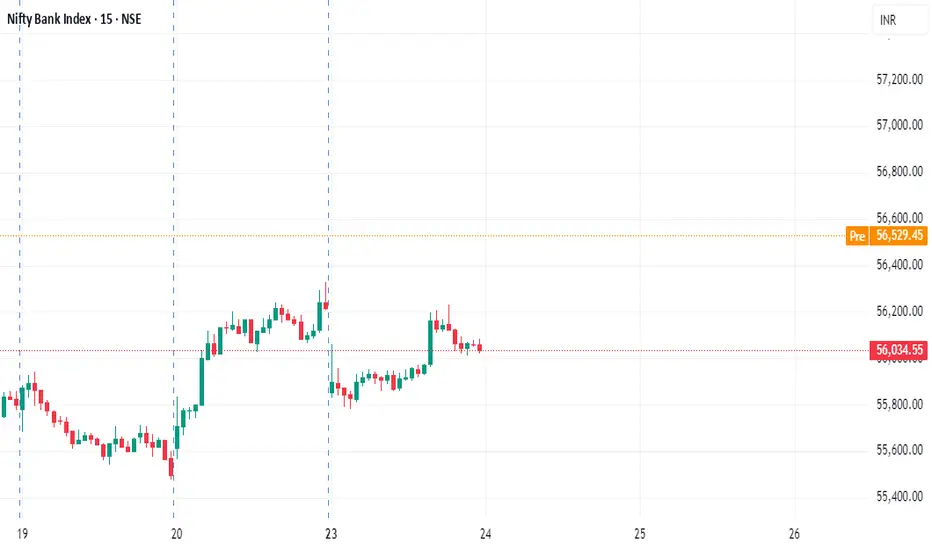
Banknifty Levels for Intraday ( Educational Purpose) 24/06/2025📈 BANKNIFTY Intraday Levels
🟢 Opening: 56,529.45
📊 Trend Bias: Bullish momentum, watch for resistance near swing highs
🔼 Buy Above: 56,600
🎯 Targets: 56,750 / 56,880
🛑 SL: 56,420
🔽 Sell Below: 56,350
🎯 Targets: 56,180 / 56,000
🛑 SL: 56,500
nifty trend 24/06/2024Nifty is in a bullish bias, sustaining above a breakout level from earlier sessions.
Global news (Iran-Israel ceasefire) is creating a positive sentiment.
Possible gap-up opening around 25135.
Technical constraint: Upper Bollinger Band may act as short-term resistance, restricting upside.
📊 Technical Strategy Analysis:
✅ Bullish Confirmation Levels:
Sustaining above 24927 (61.8% Fib level from recent high) = Bullish bias continues.
Breakout level already sustained yesterday = positive technical sentiment.
Watch for bottleneck pattern formation near 25135:
If confirmed, upside targets:
🎯 25210
🎯 25250
⚠️ Bearish Warning Levels (If reversal happens):
If Nifty fails to hold 24927, activate SOR (Sell on Rise) strategy.
Possible downside:
🔻 24840
🔻 24760
📌 NIFTY LEVELS TODAY:
🔹 Support:
24917 – Immediate support
24840 – Key fib support if weakness sets in
24760 – Deeper pullback support
🔹 Resistance:
25065 – First hurdle (pre-gap)
25135 – Gap-up open level, crucial pivot
25210 / 25250 / 25300 – Gradual upside targets if breakout follows
📘 Suggested Trade Plan Based on Chart Pattern:
📈 If Market Opens Near 25135 (gap-up):
Check for sideways / bottleneck pattern
✅ If sustained & volume picks up → Go long for 25210/25250 targets
❌ If weak & fails to move above 25135 → Wait, consider reversal below 24927
📉 If Price Falls Below 24927:
Use SOR strategy: Sell on Rise with targets:
🔻 24840
🔻 24760

BANKNIFTY Levels for June 24, 2025BANKNIFTY Levels for Today
Here are the today's BANKNIFTY Levels for intraday. Based on market movement, these levels can act as support, resistance or both.
Please consider these levels only if there is movement in index and 15m candle sustains at the given levels.
The SL (Stop loss) for each BUY trade should be the previous RED candle below the given level. Similarly, the SL (Stop loss) for each SELL trade should be the previous GREEN candle above the given level.
Note: This idea and these levels are only for learning and educational purpose.
Your likes /boosts gives us motivation for continued leaning and support.
Call on niftyNifty may open gap up as per SGX nifty based on israel and iran may committed to ceasefire in coming days. Nifty came back from lower levels by taking support around 24850. This level may acting as support for nifty in short term period. A doji candle formed in yesterday trading with lower and higher wicks it indicated undecisiveness trend occurred in the market, so investors trade with strict stop losses.
Support levels : 25040,24950
Resistance levels : 25150,25286
Disclimer : I AM NOT A SEBI RESEARCH ANALYST OR FINANCIAL ADVISOR, these recommendations are only to education purpose, not for trading and investment purpose please take an advise from your financial advisor before investing on my recommendations.
🙏 : If you liked my content please suggested to your friends follow my trading channel. Your likes and support provide boosting to me to more updates.

NIFTY Levels for June 24, 2025NIFTY Levels for Today
Here are the today's NIFTY Levels for intraday. Based on market movement, these levels can act as support, resistance or both.
Please consider these levels only if there is movement in index and 15m candle sustains at the given levels.
The SL (Stop loss) for each BUY trade should be the previous RED candle below the given level. Similarly, the SL (Stop loss) for each SELL trade should be the previous GREEN candle above the given level.
Note: This idea and these levels are only for learning and educational purpose.
Your likes /boosts gives us motivation for continued learning and support.

23/06/2025 nifty lavel Susheel kumar Agrawal: NIFTY Spot Observation today
Nifty has closed above breakout level from the 11th June hourly range.
A 3 day range has been broken , indicates start of short covering.
nifty May open near 25075
Susheel kumar Agrawal: Bullish Scenario
If Nifty holds above 25075, expect short covering rally
First upside target will be 25171
Further upside: 25220 , 25300
Susheel kumar Agrawal: Bearish Scenario
If Nifty slips below 25000, then
Downside target will be 24927
Further 24840 (strong support)
Susheel kumar Agrawal: NIFTY Support 25024, 24927, 24839
Resistance 25172, 25221, 25300
