SWING (KEEP WATCH) - TATA INVESTScript showing high intraday momentum cleared trendline resistance now trading around 0.38 fib levels can head to next major swings resistance zone around 6500

AJANTA PHARMA: Risky Bet for 30% upside potential.Price is showing strength.
Expecting the Breakout of the channel.
Price is bouncing from the Ema and also from the demand

Support zone for MRFMRF going to be long from here , and the new target will open till 170,000. obviously it will take time but investor loves time consumption...

CAN TATA MOTORS CHANGE ITS MOMENTUMThe stock has recently experienced a correction of over 60% and is currently testing support near its 200 EMA, a key support level. Historically, the stock has shown a tendency to rebound whenever it approached the 200 EMA. A weekly close above this support zone could signal a potential trend reversal.

TATA MOTORS Tata Motors Technical Analysis Summary:
Breakout Level: ₹693 (on a 75-minute chart)
Pattern: Triple Bottom at key support levels
Outlook: Bullish breakout expected
Target: ₹720+ potential upside
This setup indicates strong buying interest, suggesting further upward momentum if the breakout sustains.

Genus Power -Bottomed downGenus power has broken the trend line and showing a positive divergence on a daily basis,T1/T2-309/345

PCBL - opportunity for quick 4% gainsNSE:PCBL
cmp 388
there is an opportunity for getting quick 4% gains in this stock.
on hourly timeframe there is trendline breakout plus positive diversion on the RSI
I will be looking for entry at cmp 388 with target of 405-410
SL will be 366
The objective of this analysis is knowledge sharing and education. There isn't any buy or sell advise in this article.
It is expected of each person to carry out own research and evaluation to ascertain whether my perspective is matchingwith your studies.

Deepak Fertilizers - Bullish Setup with EMA 200 Crossover📈 Stock: Deepak Fertilisers (NSE:DEEPAKFERT)
🔍 Closing Price: ₹1034.25
📊 Pattern: Bullish Engulfing
📉 Technical Signal: EMA 200 Crossover
Key Observations:
✅ Bullish Engulfing pattern on the daily chart suggests buying interest.
✅ EMA 200 Crossover, indicating potential trend reversal or continuation.
✅ Strong volumes supporting the breakout.
Key Levels to Watch:
🔹 Support Zones: ₹981 – ₹928 – ₹897
🔹 Resistance Zones: ₹1065 – ₹1096 – ₹1148
Trading Plan:
📌 Above ₹1065, potential momentum towards ₹1096 and ₹1148.
📌 Below ₹981, caution is advised, as weakness may extend toward ₹928.

Bullish Engulfing & EMA 200 Crossover📈 Stock: Eicher Motors (NSE:EICHERMOT)
🔍 Closing Price: 4810.60
📊 Pattern: Bullish Engulfing
📉 Technical Signal: EMA 200 Crossover
Key Observations:
✅ Bullish Engulfing pattern signals strong buying momentum.
✅ EMA 200 Crossover indicates a potential trend shift.
✅ Increasing volumes add conviction to the setup.
Key Levels to Watch:
🔹 Support Zones: 4718 – 4625 – 4574
🔹 Resistance Zones: 4862 – 4913 – 5006
Trading Plan:
📌 Above 4862, price may see bullish momentum toward 4913 and 5006.
📌 Below 4718, cautious approach needed, as downside risk increases.

APL Apollo - Bullish Momentum with RSI Breakout📈 Stock: APL Apollo (NSE: APLAPOLLO)
🔍 Closing Price: 1380.65
📊 Pattern: Bullish Engulfing, Strong Bullish Candle
📈 Momentum Indicator: RSI Breakout
Key Observations:
✅ Bullish Engulfing confirms buying pressure.
✅ Strong Bullish Candle, signaling momentum shift.
✅ RSI Breakout, indicating strength and potential upside.
✅ Attempting to move out of the weak zone.
Key Levels to Watch:
🔹 Support: 1332 – 1285 – 1258
🔹 Resistance: 1406 – 1432 – 1480
Trading Plan:
📌 Above 1406, potential upside towards 1432 and 1480.
📌 Below 1332, weakness may extend to 1285.

Strong Bullish Momentum with RSI Breakout📈 Stock: KEI Industries (NSE: KEI)
🔍 Closing Price: 3568.60
📊 Patterns: Bullish Engulfing, Bullish Marubozu, Strong Bullish Candle
📈 Momentum Signal: RSI Breakout
Key Observations:
✅ Bullish Engulfing + Marubozu indicate strong buying pressure.
✅ RSI Breakout, signaling increasing momentum.
✅ Trying to move out of the weak zone, showing strength.
Key Levels to Watch:
🔹 Support Zones: 3435 – 3302 – 3226
🔹 Resistance Zones: 3644 – 3720 – 3853
Trading Plan:
📌 Above 3644, price may extend toward 3720 and 3853.
📌 Below 3435, a pullback toward 3302 cannot be ruled out.

Strong Bullish Momentum with RSI Breakout📈 Stock: BSE Ltd (NSE:BSE)
🔍 Closing Price: 5631
📊 Patterns: Bullish Engulfing, Bullish Marubozu, Strong Bullish Candle
📉 Technical Signal: RSI Breakout
Key Observations:
✅ Bullish Engulfing & Marubozu indicate strong buying pressure.
✅ RSI Breakout, signaling increased bullish momentum.
✅ Strong price action with a decisive close near the high.
Key Levels to Watch:
🔹 Support Zones: 5295 – 6009 – 6345
🔹 Resistance Zones: 5295 – 4960 – 4770
Trading Plan:
📌 Sustaining above 5675, potential upside towards 6009 and 6345.
📌 Below 5295, a pullback towards 4960 could be possible.

DECCANCE - Breakout Stock DECCANCE is showing strong momentum and is currently near a breakout level based on technical analysis. Investors may track its price movement for potential opportunities.
Disclaimer: This is for informational and educational purposes only and should not be considered as a recommendation to buy or sell. Stock markets are subject to risks and volatility. Investors should conduct their own research and consult a SEBI-registered financial advisor before making any investment decisions.

ZEN TECHNOLOGIES - AT OLD SUPPORT - DAILY CHARTZen Technology has taken support at an old support, you may clearly see that in the chart.
Stock is trading under 50ema - almost 22% under 50ema and about 35% down from the ATH.
It is taking support at the same level for the 6th time, so this gives us an edge to decide it is a strong support.
This market is a time to invest for long term and sit back, so plan accordingly, one should definitely invest at least 30% capital for long term. It will give a really good reward.
This stock gave sharp recovery in the past . If you want I can share that analysis with you, please leave a comment if you want me to do that.
If you like my analysis, please follow me as a token of appreciation :)
in.tradingview.com/u/SatpalS/
For learning and educational purposes only, not trading advice. Please consult your financial advisor before investing.

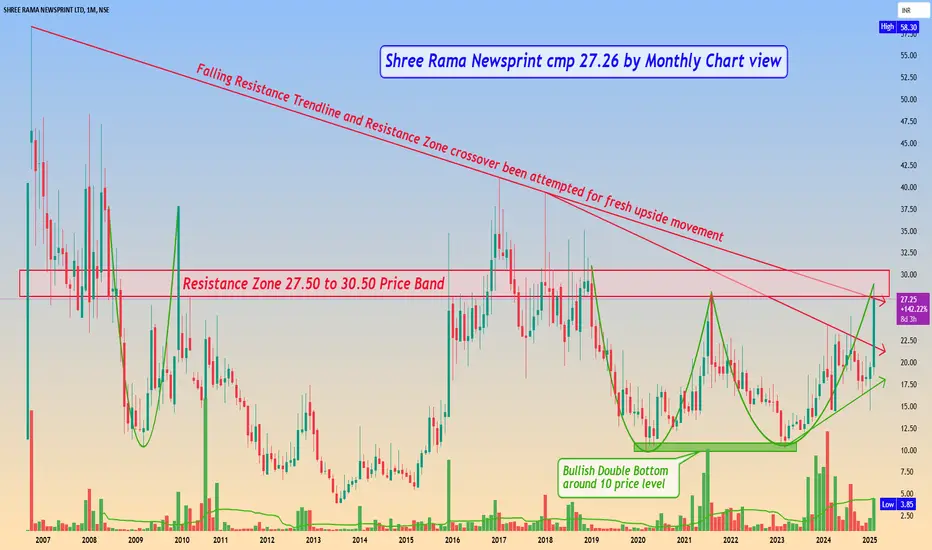
Shree Rama Newsprint cmp 27.26 by Monthly Chart viewAdd stock to the watchlist basis Resistance Zone Breakout attempts for fresh upside Price movement
Shree Rama Newsprint cmp 27.26 by Monthly Chart view
- Bullish Double Bottom around 10 price level
- Resistance Zone at 27.50 to 30.50 Price Band
- Volumes have increased exponentially over the past few months
- Bullish Rounding Bottoms completed with neckline at the Resistance Zone
- Falling Resistance Trendline and Resistance Zone crossover been attempted for fresh upside movement
CAMS ready to fly?CAMS is in base formation and currently near 3400. We need a HL closing. It can take a month or so to settle for a move upside. Currently it is giving a 5% risk downside and sky is the limit.
NOTE: I'm not a SEBI Reg. Study before investing into stocks.

TAJGVK: POLE & FLAGTAJGVK in weekly time frame is showing a POLE and FLAG pattern. Expecting some good move in this stock. Targets are marked on the trendlines. Follow as per your risk/greed.
NOTE: I'm not a SEBI REG. Study before investing.

SANATHAN TEXTILES - DAILY CHARTReversal from the bottom, probability of going up. Must use SL keeping in mind current market situation.
If you like my analysis, please follow me as a token of appreciation :)
in.tradingview.com/u/SatpalS/
For learning and educational purposes only, not a trading advice. Pls consult your financial advisor before investing.

Ashapura Minechem LtdDate : 20.02.2025
Ashapura Minechem Ltd
NSE: ASHAPURMIN
Timeframe : Day Chart
Technical Remarks :
1 Can enter once/after crosses 100% of Wave C
2 Got support from 200 ema
3 Breakout of neckline of Ascending broadening wedge will initiate new impulsive wave will review as well whether making 5-3-5-3-5 wave or 3-3-5 wave
Fundamental Remarks :
Strengths
The company has shown a good profit growth of 44.10% for the Past 3 years.
Company has been maintaining healthy ROE of 31.72% over the past 3 years.
Company has been maintaining healthy ROCE of 43.01% over the past 3 years.
Company has a healthy Interest coverage ratio of 11.33.
Company’s PEG ratio is 0.01.
The company has an efficient Cash Conversion Cycle of 1.65 days.
The company has a strong degree of Operating leverage, Average Operating leverage stands at 5.12.
Limitations
The company has shown a poor revenue growth of -7.54% for the Past 3 years.
Company has contingent liabilities of 249.62 Cr.
Company has negative cash flow from operations of -12.88.
Tax rate is low at -10.20.
The company is trading at a high EV/EBITDA of 47.70.
Regards,
Ankur

INDIGO chart pattern analysisNSE:INDIGO
best entry zone 430 - 450
and stop loss 4280- 4200
target - open
Disclaimer: This analysis is for educational purposes only.
Please assess your own risk tolerance and conslut with a financial advisor before trading.

Stock Analysis: Avantel LimitedIntroduction:
Avantel Limited is engaged in the business of designing, developing and maintaining wireless and satellite communication products, defence electronics, radar systems and development of network management software applications for its customers majorly from the aerospace and defence sectors.
Fundamentals:
Market Cap: ₹ 2,907 Cr.;
Stock P/E: 44.3 (Ind. P/E: 42.3 ) 👎;
ROCE: 47.5% 👍;
ROE: 39.2% 👍;
3 Years Sales Growth: 42% 👍;
3 Years Profit Growth: 54% 👍;
3 Years Stock Price CAGR: 110.% 👍
Pros: The company has delivered good profit growth of 42.1% CAGR over last 5 years.
The stock has a good return on equity (ROE) track record: 3 Years ROE 33.3%.
Company is almost debt free.
Technicals:
The stock price of Avantel Limited has been in a downtrend since attaining a peak level of 224 in July 2024.
It is trading in a strong consolidation range between 95 and 105 levels.
Currently the stock is trading below all MA indicators are 20 EMA (Black line), 50 EMA (Orange line), and 100 EMA (Blue line), indicating the weakness in the trend.
Yesterday, it gave a good breakout with volume.
Resistance levels: 158, 176, 211
Support levels: 108, 100
Note: As per technical analysis, downside risk is minimum, and upside potential is huge.

Rvnl ltdLet's conduct a **technical analysis** of **Rail Vikas Nigam Ltd. (RVNL)**, which is involved in the development of railway infrastructure projects in India.
---
### **Technical Analysis of Rail Vikas Nigam Ltd. (RVNL)**
#### **1. Support and Resistance Levels**
- **Support Levels:**
- Support is where the stock tends to find buying interest and reverse from a downtrend.
- **Example Support Levels:** If RVNL has previously bounced near ₹45, ₹48, or ₹50, these could be important support levels to monitor.
- A breach of these support levels could indicate a possible further downtrend.
- **Resistance Levels:**
- Resistance is where the stock faces selling pressure and struggles to move higher.
- **Example Resistance Levels:** Levels such as ₹55, ₹58, or ₹60 could be areas of resistance for the stock.
- A breakout above these resistance levels could signal bullish momentum and the potential for further upside.
#### **2. Moving Averages (MA)**
- **50-day Moving Average (MA):**
- The 50-day MA is an important short-term trend indicator. If RVNL is trading above this moving average, it indicates a bullish short-term trend.
- **Example:** If RVNL is trading at ₹53 and the 50-day MA is ₹51, it indicates a bullish short-term outlook.
- **200-day Moving Average (MA):**
- The 200-day MA provides insights into the long-term trend. A price above the 200-day MA suggests long-term bullishness.
- **Example:** If RVNL is at ₹53 and the 200-day MA is ₹48, it signifies that the long-term trend is bullish.
#### **3. RSI (Relative Strength Index)**
- **RSI Levels:**
- **Above 70:** The stock may be overbought, indicating potential for a pullback or consolidation.
- **Below 30:** The stock may be oversold, suggesting that it could be due for a rebound or upward reversal.
- **Current Example:**
- If the RSI is **above 70**, it suggests RVNL could be overbought, and a price pullback might occur.
- If the RSI is **below 30**, it could signal that RVNL is oversold and may reverse to the upside.
#### **4. MACD (Moving Average Convergence Divergence)**
- **Bullish Signal:** When the MACD line crosses above the signal line, it is a bullish signal, suggesting that upward momentum may continue.
- **Bearish Signal:** When the MACD line crosses below the signal line, it is a bearish signal, suggesting downward pressure or consolidation.
- **Current Example:**
- If the MACD line is above the signal line, it’s a bullish signal for RVNL, indicating the possibility of further upside.
- If the MACD line is below the signal line, it may indicate a bearish trend or a period of consolidation.
#### **5. Volume Analysis**
- **Increasing Volume:** Rising prices accompanied by increasing volume confirm that the trend is supported by strong buying interest.
- **Decreasing Volume:** If the price rises or falls with decreasing volume, it may indicate a weakening trend or lack of conviction.
- **Current Example:**
- If RVNL is rising with increasing volume, it confirms that the uptrend is strong.
- If RVNL is rising with declining volume, it could signal a potential reversal or that the momentum is fading.
#### **6. Candlestick Patterns**
- **Bullish Patterns:**
- Patterns such as **Bullish Engulfing**, **Morning Star**, or **Hammer** near support levels suggest a potential reversal to the upside.
- **Bearish Patterns:**
- Patterns like **Shooting Star**, **Bearish Engulfing**, or **Evening Star** near resistance levels suggest that the price might reverse to the downside.
- **Current Example:**
- A **Bullish Engulfing** pattern near ₹50 could signal a potential upward reversal.
- A **Shooting Star** near ₹55 could indicate potential resistance and a reversal downward.
#### **7. Fibonacci Retracement Levels**
- **Fibonacci Levels** are useful for identifying potential retracement levels during a correction. The key Fibonacci levels are **23.6%, 38.2%, 50%, and 61.8%**.
- **Current Example:**
- If RVNL has moved from ₹45 to ₹55, the key Fibonacci retracement levels to watch for support during a pullback would be:
- **23.6% retracement** around ₹53
- **38.2% retracement** around ₹51.5
- **50% retracement** around ₹50
- **61.8% retracement** around ₹48.5
These levels can serve as potential support if the stock faces a price correction.
---
**Disclaimer:**
- I am not a SEBI-registered professional or licensed financial advisor.
- This analysis is based on historical price data, technical indicators, and general market trends.
- Any decisions you make based on this information are entirely at your own risk. Please consult with a licensed financial advisor before making any investment decisions.
- Technical analysis cannot guarantee future results, and stock prices can be influenced by numerous factors, including news, economic data, and other market developments.

devyani international ltd.Let's conduct a **technical analysis** of **Devyani International Ltd.** (Devyani), which is one of the largest franchisees of Yum! Brands in India, operating popular brands like Pizza Hut, KFC, and Taco Bell.
---
### **Technical Analysis of Devyani International Ltd.**
#### **1. Support and Resistance Levels**
- **Support Levels:**
- Support levels are where the stock has previously found a floor or a reversal point.
- **Example Support Levels:** If Devyani has bounced at ₹175, ₹180, or ₹185 in recent times, these levels are key areas to monitor.
- A drop below these levels could signal a bearish trend or a deeper correction.
- **Resistance Levels:**
- Resistance is where the stock faces selling pressure and struggles to move higher.
- **Example Resistance Levels:** Levels such as ₹210, ₹220, or ₹230 could be strong resistance levels for the stock.
- A breakout above these levels could indicate further bullish momentum.
#### **2. Moving Averages (MA)**
- **50-day Moving Average (MA):**
- The 50-day MA is a short-term trend indicator. If the stock is trading above the 50-day MA, it indicates short-term bullishness.
- **Example:** If Devyani is trading at ₹200 and the 50-day MA is ₹190, it suggests short-term upward momentum.
- **200-day Moving Average (MA):**
- The 200-day MA represents the long-term trend. If the stock is above the 200-day MA, it suggests a long-term bullish trend.
- **Example:** If the stock is at ₹200 and the 200-day MA is ₹180, it signals the stock is in a long-term bullish phase.
#### **3. RSI (Relative Strength Index)**
- **RSI Levels:**
- **Above 70:** This suggests the stock may be overbought, indicating that a pullback or consolidation might occur.
- **Below 30:** This suggests the stock may be oversold, potentially indicating a buying opportunity.
- **Current Example:**
- If the RSI is **above 70**, it suggests that Devyani may be overbought, which could result in a pullback or correction.
- If the RSI is **below 30**, it may indicate that the stock is oversold, and it could reverse or bounce back.
#### **4. MACD (Moving Average Convergence Divergence)**
- **Bullish Signal:** A bullish signal occurs when the MACD line crosses above the signal line, suggesting potential upward momentum.
- **Bearish Signal:** A bearish signal occurs when the MACD line crosses below the signal line, indicating a potential downward movement.
- **Current Example:**
- If the MACD line is **above the signal line**, it suggests bullish momentum for Devyani.
- If the MACD line is **below the signal line**, it suggests bearish pressure and potential downward movement.
#### **5. Volume Analysis**
- **Increasing Volume:** If the stock is moving upwards with increasing volume, this confirms strong buying interest and a healthy trend.
- **Decreasing Volume:** If the price is moving up or down with decreasing volume, it indicates a lack of conviction behind the move.
- **Current Example:**
- If Devyani is rising with increasing volume, it indicates that the buying interest is strong and supports the bullish trend.
- If the stock rises with decreasing volume, it might indicate weakening momentum or a possible reversal.
#### **6. Candlestick Patterns**
- **Bullish Patterns:**
- Patterns like **Bullish Engulfing**, **Morning Star**, or **Hammer** near support levels signal a potential upward reversal.
- **Bearish Patterns:**
- Patterns like **Shooting Star**, **Bearish Engulfing**, or **Evening Star** near resistance levels signal a potential downward reversal.
- **Current Example:**
- A **Bullish Engulfing** pattern near ₹190 could indicate a potential reversal to the upside.
- A **Shooting Star** pattern near ₹220 could indicate a potential reversal to the downside.
#### **7. Fibonacci Retracement Levels**
- **Fibonacci Levels** help identify potential support and resistance during a pullback. The key levels are **23.6%, 38.2%, 50%, 61.8%**.
- **Current Example:**
- If Devyani has moved from ₹180 to ₹220, you can check the Fibonacci retracement levels for support during a pullback:
- **23.6% retracement** around ₹210
- **38.2% retracement** around ₹200
- **50% retracement** around ₹190
- **61.8% retracement** around ₹180
These Fibonacci levels can serve as potential support levels if the stock faces a price correction.
---
**Disclaimer:**
- I am not a SEBI-registered professional or licensed financial advisor.
- This analysis is based on historical price data, technical indicators, and general market trends.
- Any decisions you make based on this information are entirely at your own risk. Please consult a licensed financial advisor before making any investment decisions.
- Technical analysis cannot guarantee future results, and stock prices can be influenced by numerous factors, including news, economic data, and other market developments.
