TDPOWERSYS: Anticipated 20% upsideThe chart of TDPOWERSYS provides delineates critical price thresholds that signify breakout points, along with specific support levels that serve as indicators of where buying interest may manifest.
Additionally, the chart highlights regions likely to act as ceiling points for future price ascensions, allowing for informed decisions on entry and exit strategies.
Disclaimer: The information contained in this technical analysis report is intended solely for informational and educational purposes. It should not be interpreted as financial advice or a recommendation to buy or sell any security. Investors are strongly encouraged to conduct their own research and consult with a qualified financial advisor before making any investment decisions.

VMM Breakout and Retest Possible Entry For Long confirmation, wait for :
1. Reversal candle
2. Volume uptick
3. SL would be 103
Classic Breakout And retest

IFBAGRO-EQ headed towards a new all time high
after a strong consolidation, IFBAGRO-EQ, is on the entering its long term resistance channel and will most likely break it.
first & immediate target is the upper end of the resistance channel which is ~800 - 850 & targets are open till ~1500 - 1520.
as always people are advised to trade as per their risk capacity.

BAJAJ FINANCE - Ascending Triangle Breakout Analysis### **Ascending Triangle Breakout Analysis – Bajaj Finance Ltd (Weekly Chart)**
#### **1️⃣ Pattern Overview**
- The stock has formed an **Ascending Triangle** with a horizontal resistance around **₹8,168 - ₹8,200** and rising support.
- A **strong breakout above resistance** has occurred with high momentum.
#### **2️⃣ Breakout Confirmation**
✅ **Bullish Scenario:**
- Price has **closed above the key resistance zone** of **₹8,168 - ₹8,200**, confirming a breakout.
- The breakout **target is ₹9,500 - ₹10,000**, calculated by adding the height of the triangle to the breakout level.
- Strong bullish momentum and volume confirm buying interest.
❌ **Bearish Scenario:**
- A **pullback to ₹8,168** is possible; if it holds as support, the breakout remains valid.
- If the price **falls below ₹7,800**, the breakout fails, and the stock could enter consolidation.
#### **3️⃣ Key Indicators to Watch**
📊 **Volume:** Increasing volume validates a strong breakout.
📉 **Retest of ₹8,168:** A successful retest strengthens the bullish case.
📈 **Momentum Indicators:** If RSI stays above 60, it supports continued upside.
#### **4️⃣ Trade Plan**
📌 **Entry:** Buy on dips near ₹8,168 (previous resistance, now support).
📌 **Stop Loss:** Below ₹7,800 to avoid fake breakouts.
📌 **Target:** ₹9,500 - ₹10,000 for a bullish move.
🚀 **Final View:** **Bajaj Finance has broken out of a multi-year resistance, signaling strong upside potential. A retest of ₹8,168 can provide a good buying opportunity for positional traders.**

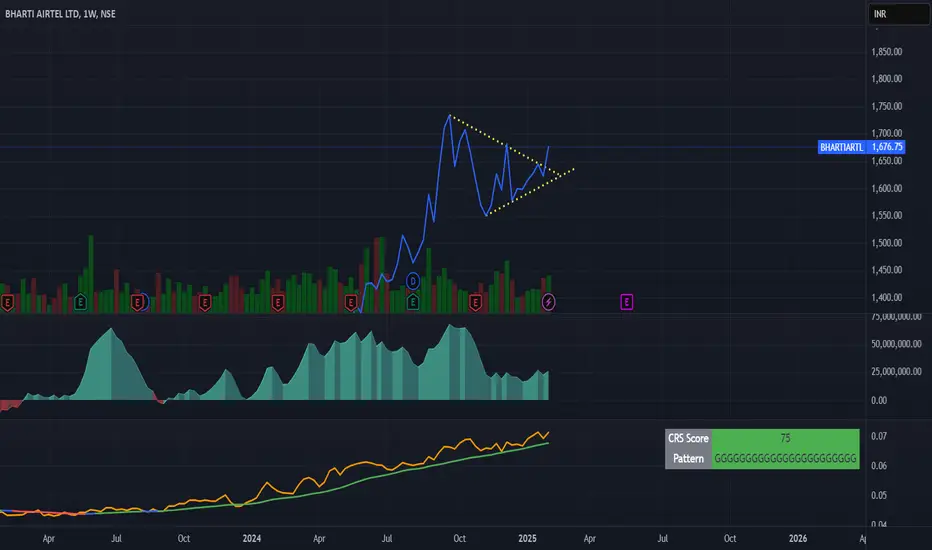
BHARTI AIRTEL - SYMMETRICAL TRINGLE BREAKOUT### **Symmetrical Triangle Breakout Analysis – Bharti Airtel Ltd (Weekly Chart)**
#### **1️⃣ Pattern Overview**
- A **Symmetrical Triangle** has formed after a strong **uptrend**, indicating a potential continuation.
- The price is **compressing within converging trendlines**, suggesting a breakout is near.
#### **2️⃣ Breakout Confirmation**
✅ **Bullish Scenario:**
- A **break and close above ₹1,700** with strong volume confirms an upside breakout.
- The breakout target is the **height of the triangle added to the breakout level** (estimated around **₹1,850 - ₹1,900**).
- RSI and **CRS Score of 75** indicate relative strength in the stock.
❌ **Bearish Scenario:**
- A **break below ₹1,600** with volume suggests a downside move.
- The price may test **₹1,450 - ₹1,400** if the breakdown is confirmed.
#### **3️⃣ Key Indicators to Watch**
📊 **Volume:** A spike in volume will confirm a strong breakout.
📉 **RSI & Momentum:** If RSI stays above 50, the bullish momentum remains intact.
🟢 **CRS Score (75):** Indicates stock is outperforming the market.
#### **4️⃣ Trade Plan**
📌 **Entry:** Buy above ₹1,700 after breakout confirmation.
📌 **Stop Loss:** Below ₹1,600 (previous support).
📌 **Target:** ₹1,850 - ₹1,900 for a bullish breakout.
🚀 **Final View:** **Stock is in a strong uptrend, and a breakout above ₹1,700 could trigger a big move. Keep an eye on volume and confirmation candle!**
This stock will lead the metal packVEDL CMP 455.80
Fibs- the correction halted at 38.2%, that it has come from a higher swing is tremendous strength. Once the highs are broken one should see 594 on this.

BSE Bombay Stock Exchange Technical👉🇮🇳As per recent data on chart of #BSE #BombayStockExchange has shown significant trading volumes, especially in derivatives like options and futures, indicating active technical trading. The Sensex has been noted for setting new records, suggesting bullish trends that technical analysts would interpret through various indicators. but in my view top has been made please find the 📉chart for your reference.
#bseltd ❣️ #renderwithme #stockmarketsindia #ShareMarket #Nifty #Nifty50 #MarketNews

Breakout in CHAMBAL FERTILIZERSSymmetrical Triangle Breakout
RSI above 65 and rising
Trading above EMA50
Volume spurt
Testing ATH
7+ months of consolidation
Disc: for study, not a recommendation

Motherson Sumi Wiring cmp 55.50 Weekly Chart view since listedMotherson Sumi Wiring cmp 55.50 by Weekly Chart view since listed
- Support Zone at 51.25 to 54.75 Price Band
- Resistance Zone at 64.50 to 66.50 Price Band
- Weekly Support at 51.25 > 46.50 > ATL 40 with Resistance at 60.25 > 66.50 > 72.50 > ATH 80
- Stock thou seems to be on downtrend currently it is seen like been testing retesting the Support Zone

Bharti Airtel cmp 1676.75 by Daily Chart viewBharti Airtel cmp 1676.75 by Daily Chart view
- Support Zone at 1610 to 1625 Price Band
- Resistance Zone at 1685 to 1700 Price Band
- Price shouldering on Rising Support Trendline and well above Falling Resistance Trendline
- Daily basis Support seen at 1625 > 1574 > 1521 with the Resistance seen at 1717 > ATH 1779
- Bullish Rounding Bottoms made with Support Zone incorporated within them indicative of good breakout probability

TATASTEEL Breakout on Daily Time Frame.Tata steel showing a breakout with good volume on daily time frame.
Can see good rally in coming days/weeks.
RSI - Near to 60 (Daily Time Frame)
This is for educational purpose only.

Lici a breakdown or a consolidation ?Life Insurance Corporation of India is another weak and bearish chart with following
1. RSI on daily and weekly time frame below 40
2. Price breakdown of last 12 months long consolidation
3. Price closed below 20 SMA (Monthly) last month and is sustaining below the
same.
Lets See How it Evolves.
Disclaimer: NOT A BUY / SELL RECOMMENDATION I am not an expert I just share interesting charts here for educational purpose and not to be taken as buy/sell recommendation. Please seek expert opinion before investing and trading as trading/ investing in market is subject to market risks. I do not hold any position in the stock as on date but I may look to take some position with my own Risk Reward matrix.

Abbott India a breakout under formation Abbott India Ltd. is an interesting stock with following
1. RSI on daily and monthly time frames above 60
2. Narrowing Bollinger Bands on weekly chart
3. Strong Bullish Anchor Candle engulfing previous almost 20 candles with strong volume
4. Price trading above all major moving averages
5. Stock consolidating in range of 25360 to 30300 since Jan-2024
Lets See How it Evolves.
Disclaimer: NOT A BUY / SELL RECOMMENDATION. I am not an expert I just share interesting charts here for educational purpose and not to be taken as buy/sell recommendation. Please seek expert opinion before investing and trading as trading/ investing in market is subject to market risks. I do hold some position in the stock as on date and I may look to take some more with my own Risk Reward matrix.

Chambal fertiliser a Breakout or a trap ?Chambal Fertilisers and Chemicals Ltd. is an interesting chart with following
1. RSI on all time frames (DWM) above 60
2. Narrowing Bollinger Bands on weekly chart and price walking on upper band
3. Break out of 8 month long consolidation in range of 440-540 zone
4. Strong weekly Engulfing candle and on daily chart strong Anchor candle with huge volume
5. On monthly charts stock made breakout of 2 year long consolidation (247 to 440 zone) in June 2024 and since then stock was consolidating and last week made a huge engulfing candle covering all previous candles
6. Major supports at 495 to 500 zone being 20 day, 50 day and 200 day SMA
Will it sustain and make a new high or will it fizzle out
Lets See How it evolves from here further
Disclaimer: NOT A BUY / SELL RECOMMENDATION I am not an expert I just share interesting charts here for educational purpose and not to be taken as buy/sell recommendation. Please seek expert opinion before investing and trading as trading/ investing in market is subject to market risks. I do hold small position in the stock as on date and I may look to take some position with my own Risk Reward matrix.

COLPAL will it breakdown or sustain ?Colgate-Palmolive (India) Ltd. is an interesting bearish chart with following
1. Price Consolidation Breakdown of 12 weeks consolidation
2. Price trading below major moving averages
3. Strong anchor red candle engulfing previous 12 candles
4. Narrowing Bollinger Bands with price walking on lower band on daily charts
Lets See How it Evolves
Disclaimer: NOT A BUY / SELL RECOMMENDATION I am not an expert I just share interesting charts here for educational purpose and not to be taken as buy/sell recommendation. Please seek expert opinion before investing and trading as trading/ investing in market is subject to market risks. I do not hold any position in the stock as on date but I may look to take some position with my own Risk Reward matrix.

view on grasimGrasim
current price: 2487
resistance zone: 2550-2500
failing to break this resistance zone the stock might see 2400-2360-2300 but if it manages to cross above this resistance zone, we may see upside target of 2600-2700

NUVOCOAs Prakashplutus sir said,
"Cement
Cement
Cement
Cement
Cement"
Extrapolating further, this scrip has been steadfast even during the recent fall and holding this for sometime now.
#triangle pattern

Parallel channel breakout with retest in Laurus LabsNSE:LAURUSLABS
A bullish parallel channel breakout has happened with a retest at 550 levels.
Currently on a weekly level stock can go past 600 with a buying price at 570-580 levels & subsequently increase beyond 600.
A SL of 450 with a higher target of 700, 900 & 1100 can be achievable in 1 1-year time frame.

view on apollo hospitalsapollo hospitals
current price: 6790
resistance levels: 6940-6960
if it break above these resistance levels we may get to see upside target 7150-7300
if it fails to break it stock may trade in range 6900-6700.

view on eicher motorsEicher motors
current price: 5372
support at 5340 level, if it breaks it, we can see downside target of 5200-5100 levels. but if it respects it current support, we may see reversal up to 5480-5500

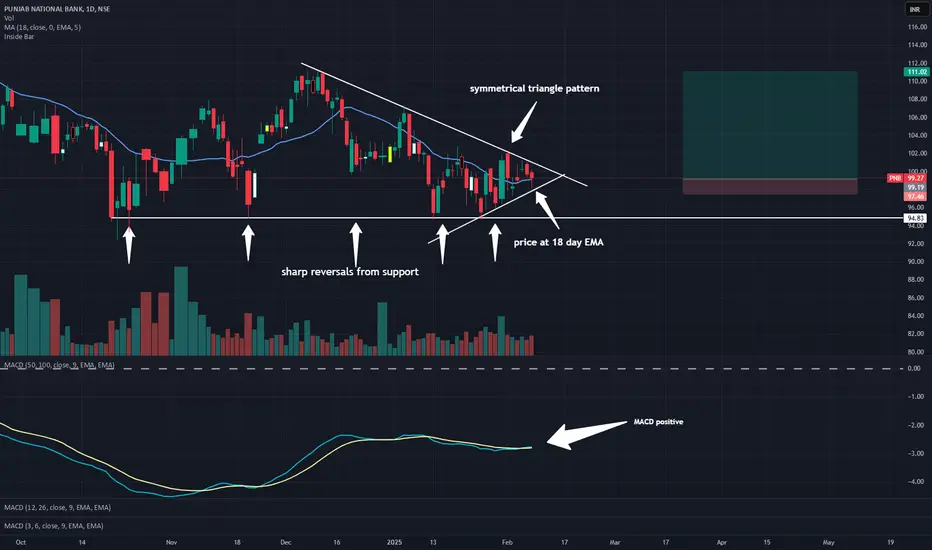
PNB-long for 10 %good valuation
price has a strong support at 95
priCe at 18 day EMA
Price forming a symmetrical triangle pattern
100-50 MACD positive crssover
target and SL marked
Hyundai Stock Analysis: Is This the Start of a Powerful Bullish
The Hyundai stock chart is showcasing a textbook Elliott Wave structure, with the corrective (5) wave phase completed and a new impulsive wave emerging. The recent breakout above critical levels hints at a potential rally, but a final confirmation is needed. Let’s dive deeper into the technicals and uncover trading opportunities!
Key Support and Resistance Levels
🔑 Support Zones:
• ₹1,736.25: The key rebound zone where the rally started.
• ₹1,829.80: The breakout level, now acting as support.
🔑 Resistance Zones:
• ₹1,933.85: A strong hurdle where the price faces selling pressure.
• ₹2,050: The next psychological barrier for bulls.
Next Breakout Target 🎯
If the price successfully breaks and sustains above ₹1,933.85 with strong volume, the next target lies at ₹2,050. Traders should keep an eye on consolidation patterns around these levels.
Price Action Analysis 📊
• The stock formed a bullish Engulfing Candlestick at ₹1,829.80, signaling strong buying interest.
• A minor rejection near ₹1,933.85 highlights hesitation but not a reversal.
Indicator Insights 🔍
📈 Moving Averages (MAs):
• Price above the 50-day and 200-day MAs = Bullish Momentum.
📈 Relative Strength Index (RSI):
• RSI at 70 = Slightly overbought; expect minor consolidation or pullbacks.
📈 MACD:
• Positive crossover above zero = Momentum supports the bulls.
📈 Bollinger Bands:
• Price near the upper band = Potential for short-term cooling before further upside.
Volume Analysis 🔦
Volume spikes during the breakout above ₹1,829.80 confirmed strong buying pressure. However, reduced volume near ₹1,933.85 suggests cautious optimism.
Trend & Momentum 📐
The stock is in a clear uptrend, forming higher highs and higher lows. Momentum indicators support further bullish movement.
Trading Opportunities
🎯 Long Opportunity:
• Entry: ₹1,850 on a pullback.
• Stop-Loss: ₹1,800.
• Target 1: ₹1,933.85.
• Target 2: ₹2,050.
🎯 Short Opportunity:
• Entry: ₹1,920 if resistance holds.
• Stop-Loss: ₹1,950.
• Target: ₹1,829.80.
Risk Management Strategy
• Position Sizing: Keep risk under 2% of total capital.
• Risk-Reward Ratio: Maintain a 1:2 ratio for all trades.
Future Projections 🚀
🔹 Bullish Scenario: Breakout above ₹1,933.85 leads to ₹2,050 and beyond.
🔹 Bearish Scenario: A drop below ₹1,829.80 signals a retracement to ₹1,736.25.
Upcoming News & Events 📰
• Earnings Report: Watch for any surprise earnings that could fuel a rally.
• Macro Factors: Monitor sector trends and broader market sentiment.
Disclaimer
This analysis is for educational and informational purposes only. It is not financial advice. Do your research or consult a financial advisor before making any investment decisions. Trading in the stock market involves significant risk.
By Hiren Soni
Trader 📈 | Finance & Global Markets Enthusiast 🌍 | Fund Advisor 💼
Turning insights into growth 🚀

KALYAN JEWELLERS how much it can go up?Wave (c) of Elongated Flat Correction finished near 420 price level in KALYAN JEWELLERS.
It is observed that whenever there is Elongated Flat Correction (wave (c) will go beyond 161.8% extension), the price further tends to go in Double Correction.
Now, after every Flat Correction, price will go 61.8% retracement of entire move most of the times.
So we can assume here that KALYAN JEWELLERS will continue in uptrend upto 61.8% (near 652 level) and here it may form wave (X) of Double Correction. Price may then reverse again to form wave (Y).
This analysis is based on Elliott Wave theory and Fibonacci.
This not any buying or selling recommendations.
This analysis is for educational purposes only.
