TSLA - Hold levelsfrom here we may see a pullback towards the weekly trendline(Solid White) this daily trend line(yellow solid) test may be rejected... most probably...


Visa Inc. Nearing Support Level in.tradingview.com
You can expect a bounce back from Visa Inc. once it reaches its support range of 184.03- 179.08

Sell-off Exhausted | TeslaUS markets ( S&P 500 Index +0.3%) ended Wednesday in the green after a choppy session, perhaps exhausting the extreme sell-off sentiment from the previous day. The unexpected result from the US inflation report released on Tuesday had prompted speculation that stocks could start to head back to their June lows in reaction to a more aggressive Federal Reserve .
Tesla (+3.4%) was one of NASDAQ’s best performers on Wednesday.
TSLA’s rise places it back above $300 per share, a territory the stock fell below after Tuesday’s broad-market rout.
Helping TSLA fend off broad investor pessimism is the company’s improving supply chains.
On Monday, Tesla’s vice president of investor relations Martin Viecha spoke at the invite-only Goldman Sachs tech conference. Viecha noted that the company’s battery supply chains are the best they have ever been, and Tesla can now buy all the cells it needs, for both its vehicles and energy-storage products.


Uber technologies intraday Uber technologies, the American Mobility Company, is moving up from the recent bottom. It looks in the making of impulse 1st wave and then the possibility of 2nd wave down before going further up.


Zoom Communications Weekly AnalysisZoom Communications has been engaged in video communication platform powering chat, workspaces etc and serving finance, education etc. It was at the top of the value during 2020 oct and since then has been going down with the value. We see an alternate analysis and the current downtrend seems changing after some time.

SNOW#SNOW is looking good, It has bounced nicely from the supply turned demand zone. Buy with a swing low as the SL.

Chewy Inc daily analysis 4-9-22Chewy Inc, the American animal product dealer, is poised to move up for some time. From the low 20.62 , it has made a wave structure which could move it to above 50 if the invalidations are taken care of.

Wave Patterns by Shreekrishna One of the Most Interesting Fact of wave Patterns is that the reliability of patterns maturity is more than 94 %, We have Experienced almost 100 % sucess rate in our trading
Profession,
This one is about to complete its Last Move from the inceptions, if you are not in it then, try to be in it
Patience is key for sucess
Good luck

SPLK daily update 2-9-22SPLK analyzing from the recent swing top to downwards. A WXY already completed, and from there a complex form is being made. Looks like expanding triangle or a flat where b is being in process.

SPLK cloud business Monthly ElliotSPLK is a cloud software business has seen top recently and a correction from 225 High to current 88ish value. If the structure and counting goes as planned, it can see further down to 60ish value.

Wait for follow-thorugh bar.Stock movement has seen extremally bearish previous day.
In order to ensure its bearish nature we need follow-through in downward direction because single bar can't tell the story.
Be patient..!!

Disney Potential Long for short term - Target 128, 144 and 158Disney trying to form Cup and Handle pattern. If it breaks out and closes above 128 then target of 144
SL - 112

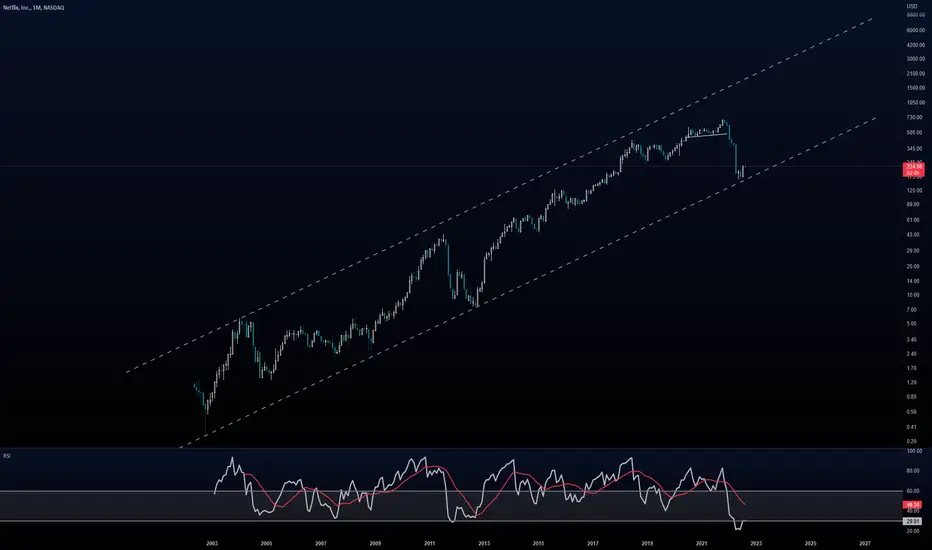
NETFLIX A very low list and high reward setup, next target 271At the downward channel, following the ascending channel with a small SL one can go long positionally for good returns in my opinion.

#AMC !!Get your X investment on mentioned level
Let’s you have 700$
X+2x+4x =7x
X will be 100$
Invest wisely, I would prefer price around 8


Tesla NeutralTesla trading in horizontal trend line with 940 resistance and 840 support no higher high seen however stock is overbought. If stock break and open below 840 we can see lower lows with strong support at 700 weekly trades: sell 940CE at 8 CMP tg to 0, sell 840 PE at 6.6 cmp tg 0, 2nd sep buy 900 PE at 40+ tg 55 Currently i don’t see any uptrend so 1 way trade direction triggered for me.
NOTE: Trade with techniques these are just a prediction make your own analysis and decide its upto you. Don’t loose hard earned money.
