PROTECTED SOURCE SCRIPT
Updated Daily, Weekly, Monthly Pivot Points Standard
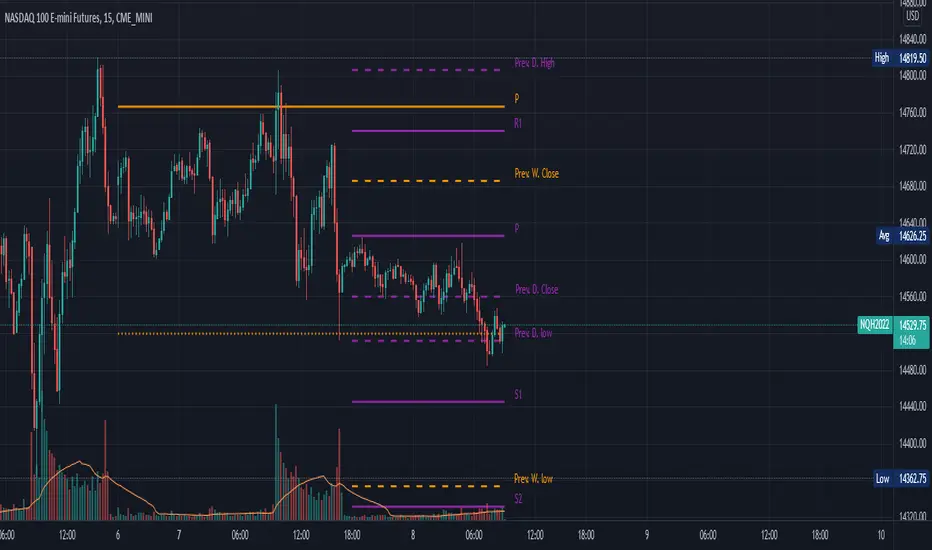
Show Higher timeframe Pivot Point along with 3 support/Resistance and mid line between them
Option to show the Monthly lines, with or without mid line, and can select the color
Option to show the Weekly lines, with or without mid line, and can select the color
Option to show the Daily lines, with or without mid line, and can select the color
Option to show a tables with the previous Open, High, Low, Close for these higher timeframe
Release Notes
Added Option to relocate the OHLC tableRelease Notes
Added the OHLC lines instead of tableFixed the monthly line start for different exchange timezone
Price for lines are now shown on the right (where it's more useful to see it)
Release Notes
Update chartRelease Notes
Added tooltipAdded HLC for all timeframe
Release Notes
Added option to show or not the price on linesRelease Notes
Fixed a bug with the monthly lines not always working on different timeframeAdded Mid line for the Previous value (daily, weekly, monthly)
Added labels for the mid lines
Added tooltips
Protected script
This script is published as closed-source. However, you can use it freely and without any limitations – learn more here.
Disclaimer
The information and publications are not meant to be, and do not constitute, financial, investment, trading, or other types of advice or recommendations supplied or endorsed by TradingView. Read more in the Terms of Use.