OPEN-SOURCE SCRIPT
Updated Cash Cycle Band

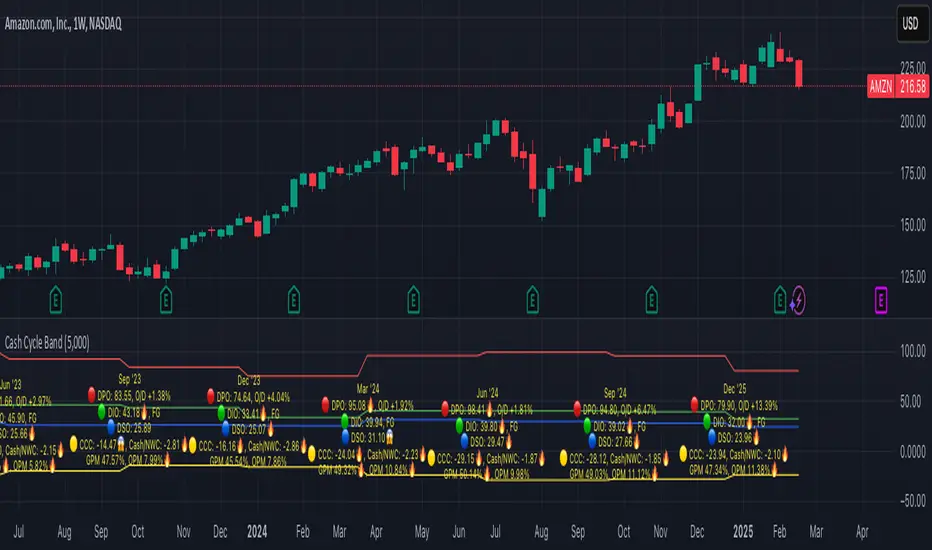
Cash cycle band shows the number of days and the profit margin compared to the previous period (it does not indicate how profitable the company is, but how well it is managed).
Cash cycle band consists of 6 sections:
1. DPO is the days payables outstanding in the "red" followed by O/D which is overdraft or short-term debt (if any) .
2. DIO is the days inventory outstanding in the "green" followed by classified inventory (if any) consists of finished goods. work in process and raw materials.
3. DSO is days sales outstanding in "blue".
4. DWC is days converting working capital to revenue in "orange".
5. CCC is days converting inventory and resources to cash flow in "yellow".
6. GPM is gross profit margin and OPM is operating profit margin.
The "😱" emoji indicates a value if it increases by more than or decreases by less than 20%, e.g.
- DPO, finished goods, work in process, raw materials, GPM, OPM is decreasing.
- O/D, DIO, DSO, DWC, CCC is increasing.
The "🔥" emoji indicates a value if it increases by more than or decreases, e.g.
- DPO, finished goods, work in process, raw materials, GPM, OPM is increasing.
- O/D, DIO, DSO, DWC, CCC is decreasing.
The order of the list depends on the day of each item, the more days more high.
Release Notes
Edit DWC formula from 30 days to 90 days, as same as DPO, DIO, DSO formulas.Release Notes
- Edit DPO using last Revenue instead of previous revenue.- Edit wording to short forms such as Finished to FG, Working to WIP, Raw Mat. to RM.
Open-source script
In true TradingView spirit, the creator of this script has made it open-source, so that traders can review and verify its functionality. Kudos to the author! While you can use it for free, remember that republishing the code is subject to our House Rules.
Disclaimer
The information and publications are not meant to be, and do not constitute, financial, investment, trading, or other types of advice or recommendations supplied or endorsed by TradingView. Read more in the Terms of Use.