PROTECTED SOURCE SCRIPT
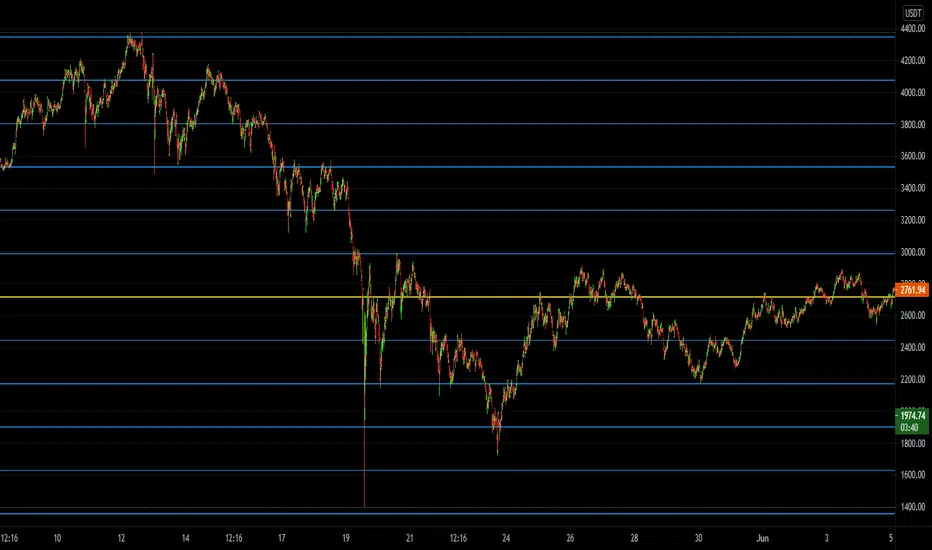
Eliza's S&R Frame

The frame has been put together to show greatly enhanced accuracy of support and resistance. Forget using open, high, low, close data for your S&R. This frame is built off e = 2.71828 and its multiples. The particularly important levels are yellow instead of blue and are to be given more attention when price is between a blue and yellow. Look for institutional candles which will open above and close below the level and vice versa. Look for trends which turn away just before the level on the retrace as this will get you laser accurate entries. Once a level breaks even by the tiniest bit assume it is no longer valid and price will now be caught in the range between the higher and lower levels it hasn't broken yet. Use with 1 minute chart as I do for greatest chance of success.
Protected script
This script is published as closed-source. However, you can use it freely and without any limitations – learn more here.
Disclaimer
The information and publications are not meant to be, and do not constitute, financial, investment, trading, or other types of advice or recommendations supplied or endorsed by TradingView. Read more in the Terms of Use.