OPEN-SOURCE SCRIPT
Custom Candle Body Color and EMA Crossover Indicator
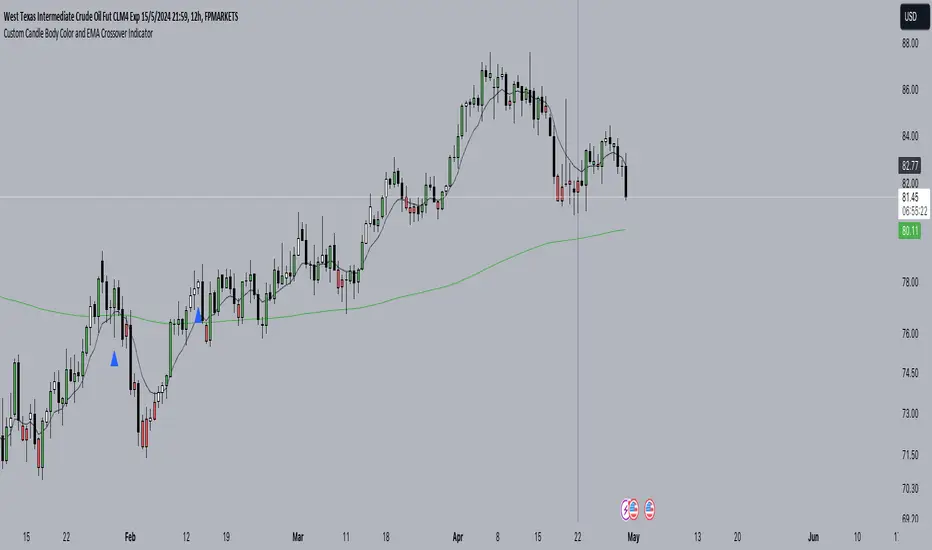
We determine if the price is below EMA 9 by comparing the close price with EMA 9.
We determine if the current candle body is huge compared to the previous candle's body.
We plot EMA 9 in black color and EMA 200 in green color.
We plot blue triangles below the bars for EMA crossover above and red triangles above the bars for EMA crossover below.
We set the color of the candle body to red if the price is below EMA 9 and to green if the price is above EMA 9, only when the current candle body is huge compared to the previous candle's body.
Open-source script
In true TradingView spirit, the creator of this script has made it open-source, so that traders can review and verify its functionality. Kudos to the author! While you can use it for free, remember that republishing the code is subject to our House Rules.
Disclaimer
The information and publications are not meant to be, and do not constitute, financial, investment, trading, or other types of advice or recommendations supplied or endorsed by TradingView. Read more in the Terms of Use.