OPEN-SOURCE SCRIPT
Updated US 20Y Treasury Yield
What This Indicator Does
This Pine Script creates a custom indicator for TradingView that displays the US 20-Year Treasury Yield (US20Y) on your chart. Here's what it does step by step:
1. What Is the US 20-Year Treasury Yield?
The US 20-Year Treasury Yield is a financial metric that shows the interest rate (or yield) investors earn when they buy US government bonds that mature in 20 years. It’s an important indicator of the economy and can influence other markets like stocks, bonds, and currencies.
2. How Does the Indicator Work?
The indicator fetches the latest data for the US 20-Year Treasury Yield from TradingView's database.
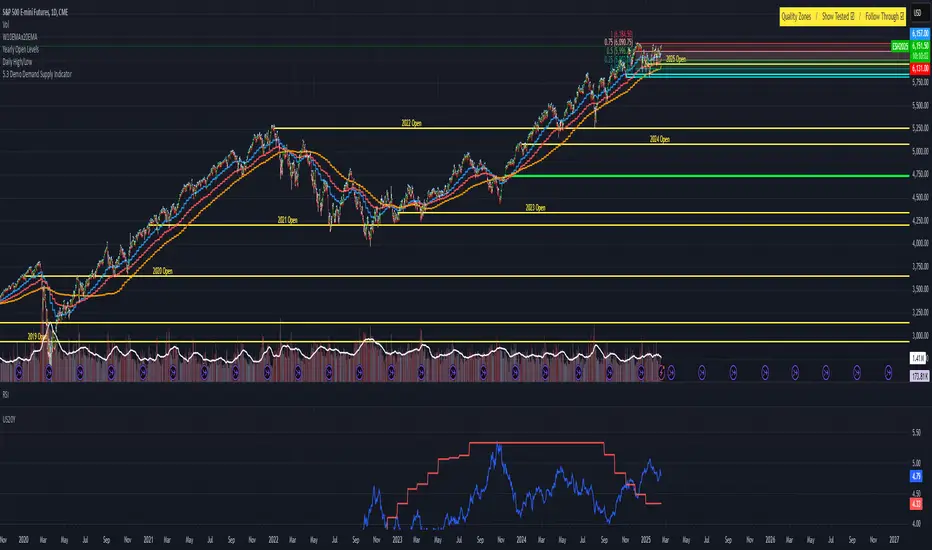
It then plots this data in a separate pane below your main chart, so you can easily monitor the yield without cluttering your price chart.
3. What Does the Indicator Show?
A blue line is drawn in the separate pane, showing the movement of the US 20-Year Treasury Yield over time.
A gray dashed line is added at the 4.0% level as a reference point. You can use this line to quickly see when the yield is above or below 4.0%.
5. Why Use This Indicator?
Monitor Economic Trends : The US 20-Year Treasury Yield is a key economic indicator. By plotting it on your chart, you can stay informed about changes in interest rates and their potential impact on other markets.
This Pine Script creates a custom indicator for TradingView that displays the US 20-Year Treasury Yield (US20Y) on your chart. Here's what it does step by step:
1. What Is the US 20-Year Treasury Yield?
The US 20-Year Treasury Yield is a financial metric that shows the interest rate (or yield) investors earn when they buy US government bonds that mature in 20 years. It’s an important indicator of the economy and can influence other markets like stocks, bonds, and currencies.
2. How Does the Indicator Work?
The indicator fetches the latest data for the US 20-Year Treasury Yield from TradingView's database.
It then plots this data in a separate pane below your main chart, so you can easily monitor the yield without cluttering your price chart.
3. What Does the Indicator Show?
A blue line is drawn in the separate pane, showing the movement of the US 20-Year Treasury Yield over time.
A gray dashed line is added at the 4.0% level as a reference point. You can use this line to quickly see when the yield is above or below 4.0%.
5. Why Use This Indicator?
Monitor Economic Trends : The US 20-Year Treasury Yield is a key economic indicator. By plotting it on your chart, you can stay informed about changes in interest rates and their potential impact on other markets.
Release Notes
1. What Is the US 20-Year Treasury Yield?The US 20-Year Treasury Yield is a financial metric that shows the interest rate (or yield) investors earn when they buy US government bonds that mature in 20 years. It’s an important indicator of the economy and can influence other markets like stocks, bonds, and currencies.
2. How Does the Indicator Work?
The indicator fetches the latest data for the US 20-Year Treasury Yield from TradingView's database.
It then plots this data in a separate pane below your main chart, so you can easily monitor the yield without cluttering your price chart.
3. What Does the Indicator Show?
A blue line is drawn in the separate pane, showing the movement of the US 20-Year Treasury Yield over time.
A gray dashed line is added at the 4.0% level as a reference point. You can use this line to quickly see when the yield is above or below 4.0%.
Open-source script
In true TradingView spirit, the creator of this script has made it open-source, so that traders can review and verify its functionality. Kudos to the author! While you can use it for free, remember that republishing the code is subject to our House Rules.
Disclaimer
The information and publications are not meant to be, and do not constitute, financial, investment, trading, or other types of advice or recommendations supplied or endorsed by TradingView. Read more in the Terms of Use.