OPEN-SOURCE SCRIPT
Updated Volume With Color

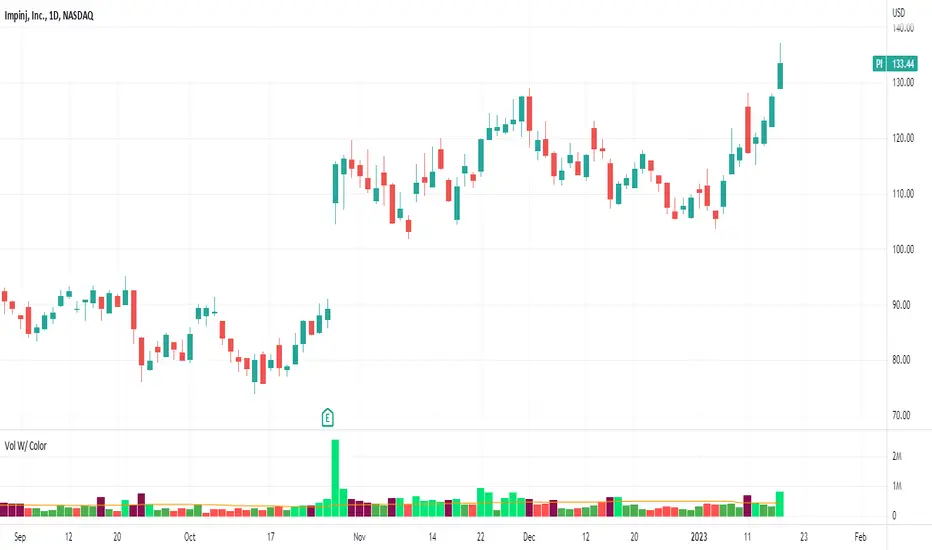
Volume with color helps to quickly identify accumulation or distribution.
An accumulation day is an up day with volume greater than a user selected average.
A distribution day is a down day with volume greater than a user selected average.
This indicator will highlight those days by changing the volume bar colors for an easy visual.
An accumulation day is an up day with volume greater than a user selected average.
A distribution day is a down day with volume greater than a user selected average.
This indicator will highlight those days by changing the volume bar colors for an easy visual.
Release Notes
Added functionality to plot volume as a histogram or line. Code clean up.
Release Notes
Now has the ability to show Pocket Pivots.A pocket pivot is an up day with volume greater than any of the down days volume in the past 10 days.
Release Notes
Clean upRelease Notes
Ability to change text color for dark mode usersRelease Notes
- Added Pocket Pivot alerts
Release Notes
Per user requests multiple new features added- Additional volume info in table (Avg. Volume, Avg. Dollar Volume, Up Down Volume Ratio)
- Color volume dry up bars
Release Notes
5 Day Pocket Pivots- Added the ability to see 5 day pocket pivots
Release Notes
Now able to change the size of the volume information table and skyscraper labels. Release Notes
User request to show volume percentage change on skyscraper volumes. Release Notes
Added option to automatically switch the volume moving average length when switching to a weekly chart. The weekly MA length can be set in the indicators settings and this option can be turned on or off to keep the MA consistent across all time frames. Release Notes
Option to color the MA based on the up down volume ratio. Up down ratio > 1 - moving average is blue
Up down ration < 1 - moving average is orange
Added ability to see the volume percentage change for previous bars by hover over the volume.
Release Notes
Update to work with the new Pine Screener. Can screen for pocket pivots, up on volume and down on volume. Release Notes
average dollar volume added for screening functionRelease Notes
Volume dry up percentage is now customizable Open-source script
In true TradingView spirit, the creator of this script has made it open-source, so that traders can review and verify its functionality. Kudos to the author! While you can use it for free, remember that republishing the code is subject to our House Rules.
Trusted Pine programmer. Send me a message for script development.
Disclaimer
The information and publications are not meant to be, and do not constitute, financial, investment, trading, or other types of advice or recommendations supplied or endorsed by TradingView. Read more in the Terms of Use.
Open-source script
In true TradingView spirit, the creator of this script has made it open-source, so that traders can review and verify its functionality. Kudos to the author! While you can use it for free, remember that republishing the code is subject to our House Rules.
Trusted Pine programmer. Send me a message for script development.
Disclaimer
The information and publications are not meant to be, and do not constitute, financial, investment, trading, or other types of advice or recommendations supplied or endorsed by TradingView. Read more in the Terms of Use.