OPEN-SOURCE SCRIPT
Shark Price & Bar Prediction

### Description for TradingView
**Shark Price & Bar Prediction Indicator**
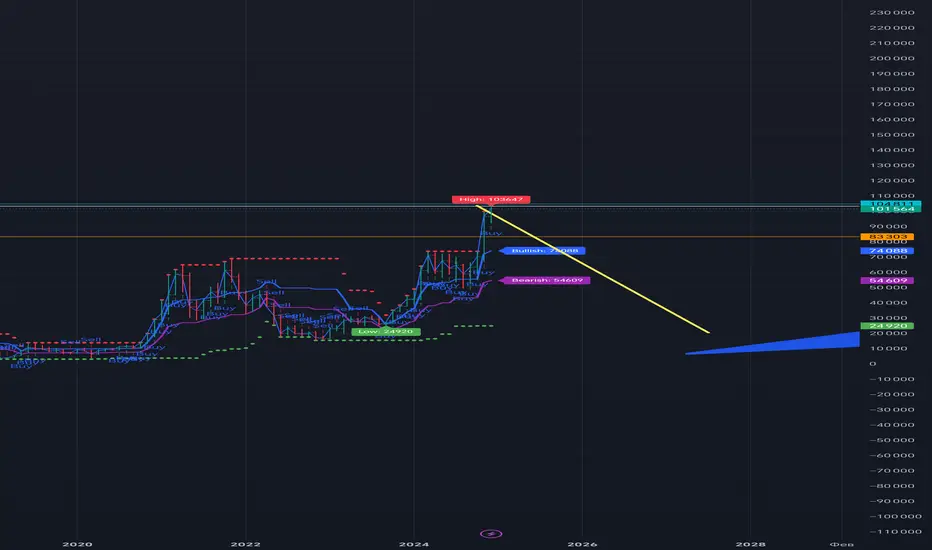
The "Shark Price & Bar Prediction" indicator is designed to provide traders with insights into potential price movements based on local extremes in price action. Utilizing Volume Spread Analysis (VSA), this script identifies key price levels and generates predictive targets for bullish and bearish trends.
#### Features:
- **Local Extremes Detection**: Automatically finds the highest and lowest points within a specified prediction period.
- **Price Prediction**: Calculates potential bullish and bearish targets using Fibonacci levels.
- **Visual Signals**: Displays buy and sell signals directly on the chart, making it easy to identify entry points.
- **Customizable Settings**: Users can adjust the prediction period and confidence threshold to suit their trading style.
### How to Use:
1. **Settings**: Adjust the following inputs according to your preferences:
- **Prediction Period**: Set the number of bars to look back for local extremes.
- **Confidence Threshold**: Define the confidence level for predicting price targets.
- **Show Additional Labels**: Toggle additional labels for more detailed information on the chart.
2. **Interpreting Signals**:
- **Buy Signal**: When the closing price exceeds the bullish target, an upward arrow will appear below the bar, indicating a potential buying opportunity.
- **Sell Signal**: When the closing price falls below the bearish target, a downward arrow will appear above the bar, suggesting a potential selling opportunity.
3. **Visual Indicators**:
- The highest point is marked with a 🔴 **red circle**, while the lowest point is marked with a 🟢 **green circle**.
- Bullish targets are represented by a 🔵 **blue line**, and bearish targets are represented by a 🟣 **purple line**.
### Объяснение на русском
**Индикатор Прогнозирования Цены и Баров Shark**
Индикатор "Shark Price & Bar Prediction" предназначен для предоставления трейдерам информации о потенциальных ценовых движениях на основе локальных экстремумов в ценовом действии. Используя анализ объема и спреда (VSA), этот скрипт определяет ключевые уровни цен и генерирует прогнозные цели для бычьих и медвежьих трендов.
#### Особенности:
- **Обнаружение Локальных Экстремумов**: Автоматически находит максимальные и минимальные точки в заданный период прогнозирования.
- **Прогнозирование Цены**: Вычисляет потенциальные бычьи и медвежьи цели с использованием уровней Фибоначчи.
- **Визуальные Сигналы**: Отображает сигналы покупки и продажи непосредственно на графике, что облегчает определение точек входа.
- **Настраиваемые Параметры**: Пользователи могут регулировать период прогнозирования и уровень уверенности в соответствии со своим стилем торговли.
### Как использовать:
1. **Настройки**: Отрегулируйте следующие параметры в соответствии с вашими предпочтениями:
- **Период Прогнозирования**: Установите количество баров для поиска локальных экстремумов.
- **Порог Уверенности**: Определите уровень уверенности для прогнозирования ценовых целей.
- **Показать Дополнительные Метки**: Включите дополнительные метки для более детальной информации на графике.
2. **Интерпретация Сигналов**:
- **Сигнал Покупки**: Когда цена закрытия превышает бычью цель, под баром появится стрелка вверх, указывающая на потенциальную возможность покупки.
- **Сигнал Продажи**: Когда цена закрытия падает ниже медвежьей цели, над баром появится стрелка вниз, предлагающая потенциальную возможность продажи.
3. **Визуальные Индикаторы**:
- Максимальная точка обозначена 🔴 **красным кругом**, а минимальная точка — 🟢 **зеленым кругом**.
- Бычьи цели представлены 🔵 **синей линией**, а медвежьи цели — 🟣 **пурпурной линией**.
Open-source script
In true TradingView spirit, the creator of this script has made it open-source, so that traders can review and verify its functionality. Kudos to the author! While you can use it for free, remember that republishing the code is subject to our House Rules.
Disclaimer
The information and publications are not meant to be, and do not constitute, financial, investment, trading, or other types of advice or recommendations supplied or endorsed by TradingView. Read more in the Terms of Use.