OPEN-SOURCE SCRIPT
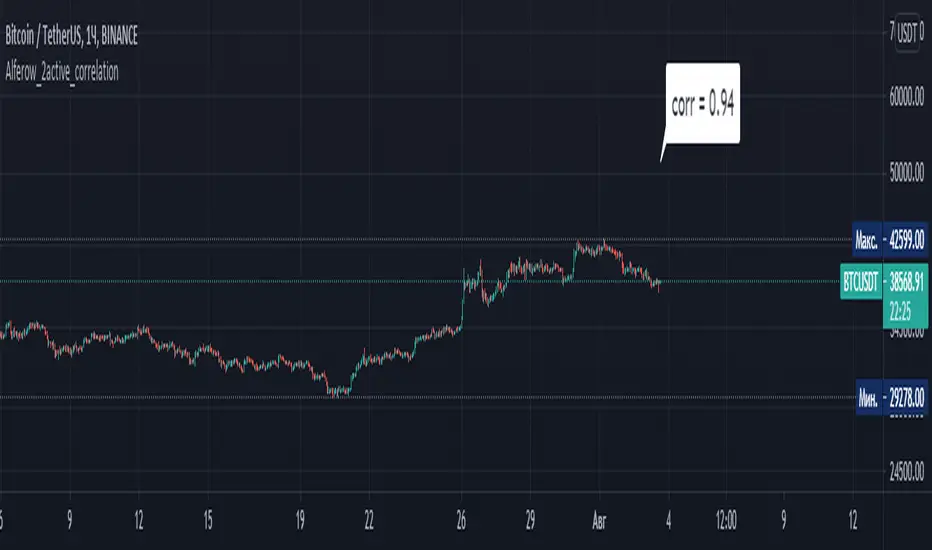
Alferow_2active_correlation

An indicator showing the coefficient of linear correlation between two assets for the selected period. As the initial data, the following are set: the indicator of the candle, according to which the calculation is made (maximum, minimum, closing or opening); the period for analysis; two assets between which the correlation is considered. The output is a label with the value of the correlation coefficient.
Open-source script
In true TradingView spirit, the creator of this script has made it open-source, so that traders can review and verify its functionality. Kudos to the author! While you can use it for free, remember that republishing the code is subject to our House Rules.
Disclaimer
The information and publications are not meant to be, and do not constitute, financial, investment, trading, or other types of advice or recommendations supplied or endorsed by TradingView. Read more in the Terms of Use.