OPEN-SOURCE SCRIPT
Updated Daily Weekly Monthly Yearly Opens

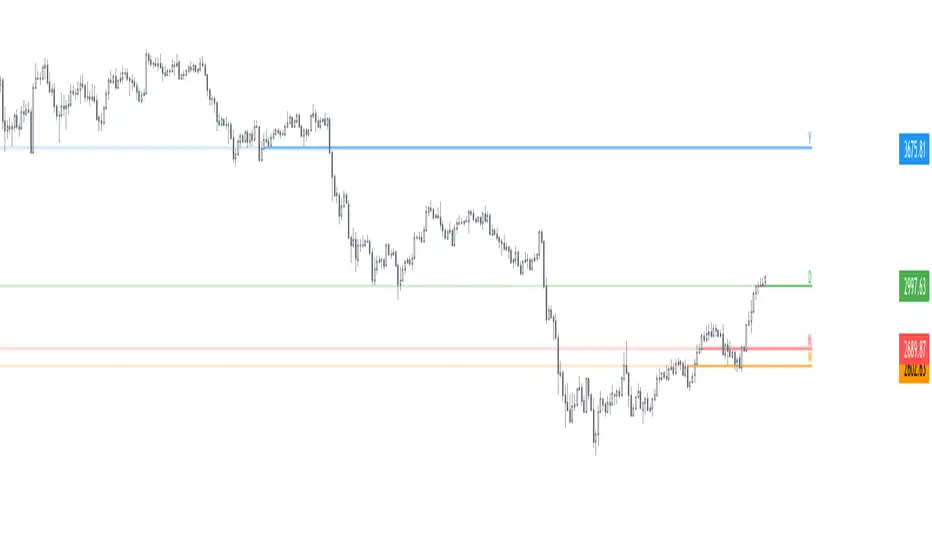
This script plots the current daily, weekly and monthly opens (all enabled by default).
Here are some additional info about the drawing behavior:
Here are some additional info about the drawing behavior:
- Daily open is shown only on intraday timeframes
- Weekly open is shown only on timeframes < weekly
- Monthly open is shown only on timeframes < monthly
Release Notes
Add an option to show tails on opens (disabled by default). Tails can help to better visualize how price previously traded at these levels.In addition, for low timeframes, it provides a work around for PineScript not drawing a line if the open isn't yet visible on the screen.
Release Notes
Allow changing colorsRelease Notes
Minor fix on updating issue.Release Notes
- Add yearly open
- Allow individual coloring
- Minor fixes and improvements
Release Notes
- Enable showing previous opens with an option to project lines on the right side
- Display values on the price scale, status line, and data window
- Upgrade labels with tooltips showing opening prices
- Add alerts
- Expose new setting for discovering opening prices from the intraday instead of high time frames
- Expose new setting for plotting opening prices from extended hours instead of regular hours
- General improvements
Release Notes
v7- Implemented configurable timeframes
- Added the quarter open
- Updated Pine to v6
- Added minor improvements
Open-source script
In true TradingView spirit, the creator of this script has made it open-source, so that traders can review and verify its functionality. Kudos to the author! While you can use it for free, remember that republishing the code is subject to our House Rules.
🌟 Listed as "Trusted Pine Programmer"
👨💻 Coding services: sbtnc.dev/hire-pine-script-developer
🔒 Premium indicators: sbtnc.gumroad.com
☕️ Tip: buymeacoffee.com/sbtnc
👨💻 Coding services: sbtnc.dev/hire-pine-script-developer
🔒 Premium indicators: sbtnc.gumroad.com
☕️ Tip: buymeacoffee.com/sbtnc
Disclaimer
The information and publications are not meant to be, and do not constitute, financial, investment, trading, or other types of advice or recommendations supplied or endorsed by TradingView. Read more in the Terms of Use.