OPEN-SOURCE SCRIPT
Trend Follower Index
Description
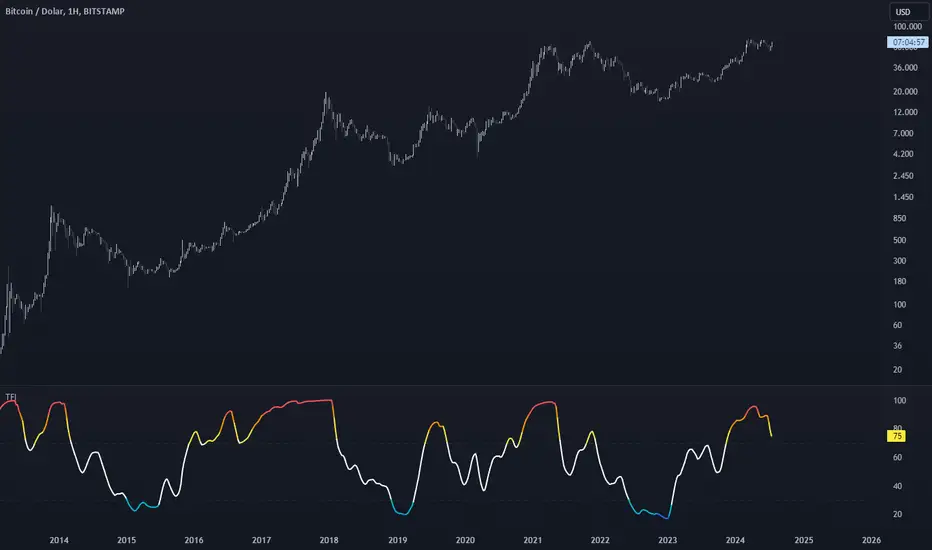
The purpose of this index is to give an idea about the possible direction of the trend. The index is overbought between 70 and 100, and oversold between 30 and 0. Unlike a typical RSI calculation, the 6-bar simple moving average of the price is calculated first. Then, the 21-bar RSI value of this moving average is calculated.
Why
The 6-bar average is often one of the best averages to show the direction of prices. Closes below this average give strong indications of a trend reversal. To display this average on the horizontal plane, I used the RSI function and took 21 bar as the reference length. Because in my research, I realized that 21 bar length is the most ideal upper and lower points. That's why I coded an indicator that shows where a trend is going and how far that trend needs to go.
Use
It becomes oversold when the Moving Average falls below 30. Here we encounter 3 types of colors;
As the level decreases, purchases should increase.
Again, when the average value exceeds 70, it becomes overbought. Here we encounter three types of colors;
As the level increases, sales should increase.
Originality
First of all, this moving average is not an RSI. RSI is only used to establish the average on a flat basis. The RSI is merely a helpful tool in determining how much the moving average will rise or fall.
The 6-bar average of the value obtained by calculating Bar (Opening + Closing + High + Low) / 4 gives information about the main trend. In my research and usage, I have observed that as long as the price remains above this average, the price continues to move upwards, and when it remains below it, it is willing to move downwards.
Disclaimer
This indicator is for informational purposes only and should be used for educational purposes only. You may lose money if you rely on this to trade without additional information. Use at your own risk.
Version
v1.0
The purpose of this index is to give an idea about the possible direction of the trend. The index is overbought between 70 and 100, and oversold between 30 and 0. Unlike a typical RSI calculation, the 6-bar simple moving average of the price is calculated first. Then, the 21-bar RSI value of this moving average is calculated.
Why
The 6-bar average is often one of the best averages to show the direction of prices. Closes below this average give strong indications of a trend reversal. To display this average on the horizontal plane, I used the RSI function and took 21 bar as the reference length. Because in my research, I realized that 21 bar length is the most ideal upper and lower points. That's why I coded an indicator that shows where a trend is going and how far that trend needs to go.
Use
It becomes oversold when the Moving Average falls below 30. Here we encounter 3 types of colors;
- Light Blue: Indicates that the average is between 30 and 20. It indicates the stage when small purchases begin and the decline rate of the trend begins to decrease.
- Blue: Indicates that the average is between 20 and 10. It indicates the stage when purchases begin to become more frequent and the rate of trend decline begins to decrease slightly.
- Green: Indicates that the average has fallen below 10. It is the ideal level for purchasing. This indicates the stage when buying pressure has increased significantly and the trend is ready to reverse upward.
As the level decreases, purchases should increase.
Again, when the average value exceeds 70, it becomes overbought. Here we encounter three types of colors;
- Yellow: Indicates that the average is between 70 and 80. It indicates the stage when small sales begin and the rate of increase in the trend begins to decrease.
- Orange: Indicates that the average is between 80 and 90. It indicates the stage when sales begin to become more frequent and the upward trend begins to decrease somewhat.
- Red: Indicates the average is above 90. It is an ideal level for sales. It now marks the stage where selling pressure has increased significantly and the trend is ready to turn downwards.
As the level increases, sales should increase.
Originality
First of all, this moving average is not an RSI. RSI is only used to establish the average on a flat basis. The RSI is merely a helpful tool in determining how much the moving average will rise or fall.
The 6-bar average of the value obtained by calculating Bar (Opening + Closing + High + Low) / 4 gives information about the main trend. In my research and usage, I have observed that as long as the price remains above this average, the price continues to move upwards, and when it remains below it, it is willing to move downwards.
Disclaimer
This indicator is for informational purposes only and should be used for educational purposes only. You may lose money if you rely on this to trade without additional information. Use at your own risk.
Version
v1.0
Open-source script
In true TradingView spirit, the creator of this script has made it open-source, so that traders can review and verify its functionality. Kudos to the author! While you can use it for free, remember that republishing the code is subject to our House Rules.
Disclaimer
The information and publications are not meant to be, and do not constitute, financial, investment, trading, or other types of advice or recommendations supplied or endorsed by TradingView. Read more in the Terms of Use.