OPEN-SOURCE SCRIPT
M.Kiriti RSI with SMA & WMA
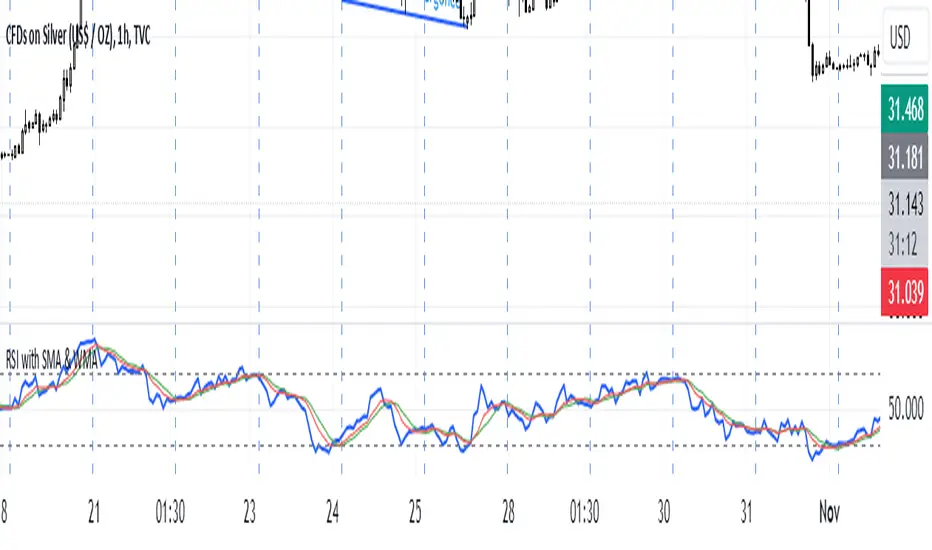
This script is a custom RSI indicator with added SMA and WMA moving averages to smooth RSI trends and improve analysis of momentum shifts.
1. RSI Calculation: Measures 14-period RSI of the closing price, default threshold levels at 70 (overbought) and 30 (oversold).
2. Moving Averages (SMA and WMA):
- SMA and WMA are applied to RSI for trend smoothing.
- SMA gives equal weight; WMA gives more weight to recent values, making it more responsive.
3.Overbought/Oversold Lines and Labels:
- Horizontal lines and scale labels at 70 (overbought) and 30 (oversold) make these levels easy to reference.
This indicator is useful for identifying potential reversal points and momentum trends when RSI crosses its moving averages.
Open-source script
In true TradingView spirit, the creator of this script has made it open-source, so that traders can review and verify its functionality. Kudos to the author! While you can use it for free, remember that republishing the code is subject to our House Rules.
Disclaimer
The information and publications are not meant to be, and do not constitute, financial, investment, trading, or other types of advice or recommendations supplied or endorsed by TradingView. Read more in the Terms of Use.