OPEN-SOURCE SCRIPT
Updated Ribbon — multi-MA trend bands
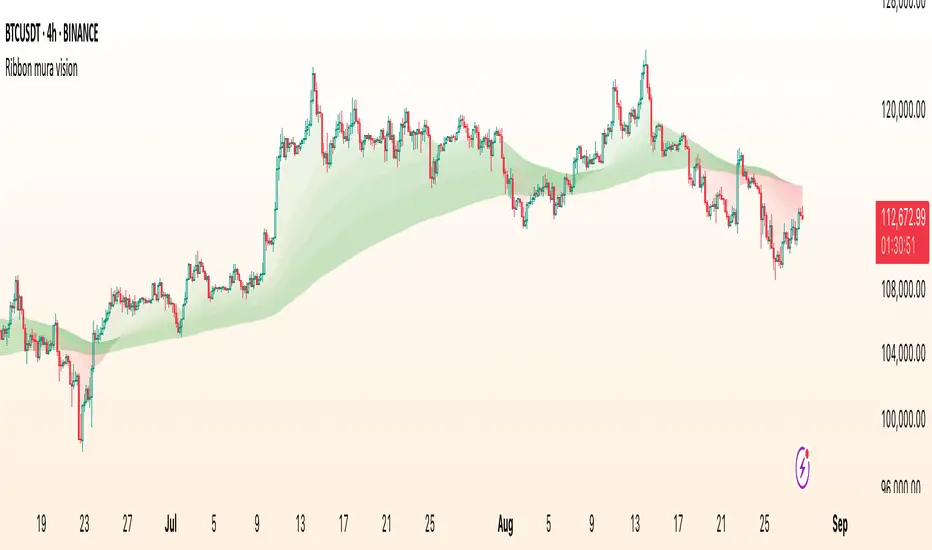
Ribbon paints five translucent bands between six moving averages to visualize trend structure and regime at a glance. You can choose the MA type (EMA/SMA/WMA), customize lengths, and switch the coloring logic between an anchor-based mode and strict alignment.
What it shows
Coloring modes
1. By EMA233 (Anchor mode)
Each band is colored Up or Down by comparing its upper MA to the anchor (the 6th MA in inputs, default length 233).
2. By Alignment
Inputs (key)
How to read it
Implementation notes
Disclaimer
This script is for educational and informational purposes only and does not constitute financial advice. Always test on historical data and manage risk appropriately.
What it shows
- Six MAs on the current timeframe (defaults: 5 / 34 / 55 / 89 / 144 / 233).
- Five bands filled between consecutive MAs:
- 5–34, 34–55, 55–89, 89–144, 144–233.
- Optional plotting of MA lines (hidden by default to keep the chart clean).
Coloring modes
1. By EMA233 (Anchor mode)
Each band is colored Up or Down by comparing its upper MA to the anchor (the 6th MA in inputs, default length 233).
- If MA > anchor → Up color (supportive regime).
- If MA < anchor → Down color (resistive regime).
2. By Alignment
- All bands share one color depending on strict ordering:
- Up if MA1 > MA2 > MA3 > MA4 > MA5 > MA6
- Down if MA1 < MA2 < MA3 < MA4 < MA5 < MA6
- Gray otherwise (no clean alignment).
Inputs (key)
- MA Type: EMA / SMA / WMA (applies to all six MAs).
- MA 1…MA 6 (anchor): lengths for each average (defaults form a classic ribbon up to 233).
- Up/Down colors: band palette.
- Base transparency / step: controls band opacity gradient (top band uses Base, each next band adds Step).
- Show MA lines + Lines transparency: optionally draw the six MA curves.
How to read it
- Directional bias: when most bands are green (anchor mode) or the whole ribbon is green (alignment mode), momentum favors the upside; red implies downside pressure.
- Quality of trend: a persistent alignment (all ordered) signals a cleaner trend. Mixed/gray suggests chop or transition.
- Pullback zones: price returning toward inner bands can mark areas to watch for continuation vs. failure.
Implementation notes
- No higher-timeframe data, no lookahead — this is a non-repainting, current-TF visualization.
- Bands still render even when MA lines are hidden (the script uses hidden plot anchors under the hood).
- This is an indicator, not a strategy — it does not open/close trades or calculate P&L.
Disclaimer
This script is for educational and informational purposes only and does not constitute financial advice. Always test on historical data and manage risk appropriately.
Release Notes
Minor updateOpen-source script
In true TradingView spirit, the creator of this script has made it open-source, so that traders can review and verify its functionality. Kudos to the author! While you can use it for free, remember that republishing the code is subject to our House Rules.
✅My Telegram
t.me/charyyevn
t.me/charyyevn
Disclaimer
The information and publications are not meant to be, and do not constitute, financial, investment, trading, or other types of advice or recommendations supplied or endorsed by TradingView. Read more in the Terms of Use.
Open-source script
In true TradingView spirit, the creator of this script has made it open-source, so that traders can review and verify its functionality. Kudos to the author! While you can use it for free, remember that republishing the code is subject to our House Rules.
✅My Telegram
t.me/charyyevn
t.me/charyyevn
Disclaimer
The information and publications are not meant to be, and do not constitute, financial, investment, trading, or other types of advice or recommendations supplied or endorsed by TradingView. Read more in the Terms of Use.