PROTECTED SOURCE SCRIPT
Updated MTF RSI by Emiliano Mesa
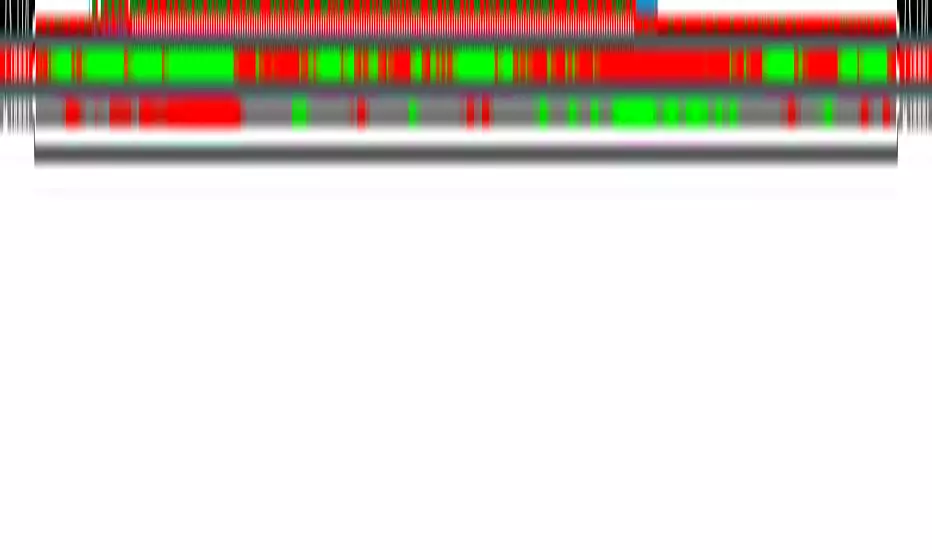
A MTF RSI . It shows you either the RSI is oversold or overbought in up to 4 different timeframes which are all fully customizable by the user. Furthermore it allows you to set the oversold and overbought levels.
Green : Overbought
Red : Oversold
Gray : Neither overbought or oversold
Green : Overbought
Red : Oversold
Gray : Neither overbought or oversold
Release Notes
Simple updateRelease Notes
Minor fix...Protected script
This script is published as closed-source. However, you can use it freely and without any limitations – learn more here.
Disclaimer
The information and publications are not meant to be, and do not constitute, financial, investment, trading, or other types of advice or recommendations supplied or endorsed by TradingView. Read more in the Terms of Use.
Protected script
This script is published as closed-source. However, you can use it freely and without any limitations – learn more here.
Disclaimer
The information and publications are not meant to be, and do not constitute, financial, investment, trading, or other types of advice or recommendations supplied or endorsed by TradingView. Read more in the Terms of Use.