OPEN-SOURCE SCRIPT
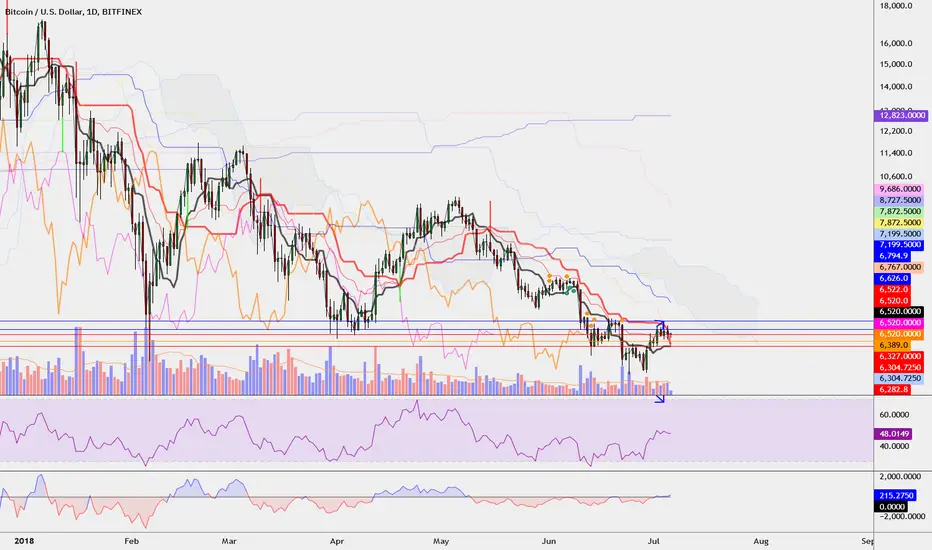
Updated Covengers Ichimoku Cloud Easy 0.1

This is Covengers Ichimoku Cloud's EASY VERSION.
This is for you who don't know about Ichimoku,
to describe "Time tiktok & Price tiktok Trading".
☆Time tiktok & Price tiktok Trading☆
IF 1. DON'T CARE ABOUT LOWEST PRICE.
IF 2. DON'T CARD ABOUT HIGHER PRICE.
BUY IF 1. IS "CLOSE" BROKE THROUGH BASE LINE?
BUY IF 2. IS "CLOSE " SUPPORTED BY BASE LINE?
-> THEN BUY !
At this time, Base line should be STOP LOSS line.
SELL IF 1. IS "CLOSE" BROKE THROUGH BASE LINE?
SELL IF 2. IS "CLOSE" RESISTED BY BASE LINE?
SELL IF 3. IS "CLOSE" BROKE THROUGH ICHIMOKU CLOUD?
-> THEN SELL !
Buy conservatively, Sell aggressively.
"less LOSS" better than "much PROFIT"
-
Covengers Ichimoku Cloud의 EASY 버전입니다.
차트를 하나도 모르는 당신에게
임운자재를 설명하기 위해 만들었습니다.
☆임운자재 매매법☆
절대 조건 1. 바닥에는 관심을 두지 않는다.
절대 조건 2. 천장에는 관심을 두지 않는다.
매수 조건 1. 종가가 기준선을 돌파하였는가?
매수 조건 2. 종가가 기준선의 지지를 받는가?
-> 매수
이 때, 손절라인은 기준선이 된다.
매도 조건 1. 종가가 기준선을 돌파하였는가?
-> 매도
매도 조건 2. 종가가 기준선의 저항을 받는가?
-> 매도
매도 조건 3. 종가가 구름대를 돌파하였는가?
-> 매도
매수는 보수적으로, 매도는 공격적으로.
많이 따는 것보다, 잃지 않는 것이 중요하다.
Release Notes
when close upcross or downcross base linethen arrow will show out.
-
종가가 기준선을 돌파하면
화살표가 등장합니다.
Release Notes
ver 0.1 -> ver 0.2 Release !Ver 0.2 updated.... like below...
+ Yumdung Momentum
Yumdung Momentum is based on Ichimoku Base Number Line
42 , 65 , 76, 129, 172 , 226
These Lines mean Resist / Support.
If There are many lines at one price, there could be STRONG Resist or Supprot Line.
-
코치모쿠 0.1 -> 0.2 버전 공개!
버전 0.2에는 다음과 같은 내용이 추가되었씁니다.
+ 윰멘텀 (윰둥이 모맨텀)
윰멘텀은 일목균형표에서 말하는 기본 수치에 대한 내용을 담고 있습니다.
기본 수치는 42, 65, 76, 129, 172, 226 입니다.
이 라인이 뭉쳐진 곳은 지지/저항의 역할을 할 가능성이 큽니다.
한 가격에 이 라인들이 뭉쳐있다면, 그곳은 강력한 지지 혹은 저항이 됩니다.
Open-source script
In true TradingView spirit, the creator of this script has made it open-source, so that traders can review and verify its functionality. Kudos to the author! While you can use it for free, remember that republishing the code is subject to our House Rules.
Disclaimer
The information and publications are not meant to be, and do not constitute, financial, investment, trading, or other types of advice or recommendations supplied or endorsed by TradingView. Read more in the Terms of Use.