OPEN-SOURCE SCRIPT
Updated ORB + Premarket High/Low
indicator that show opening range break plus premarket highs and lows
Release Notes
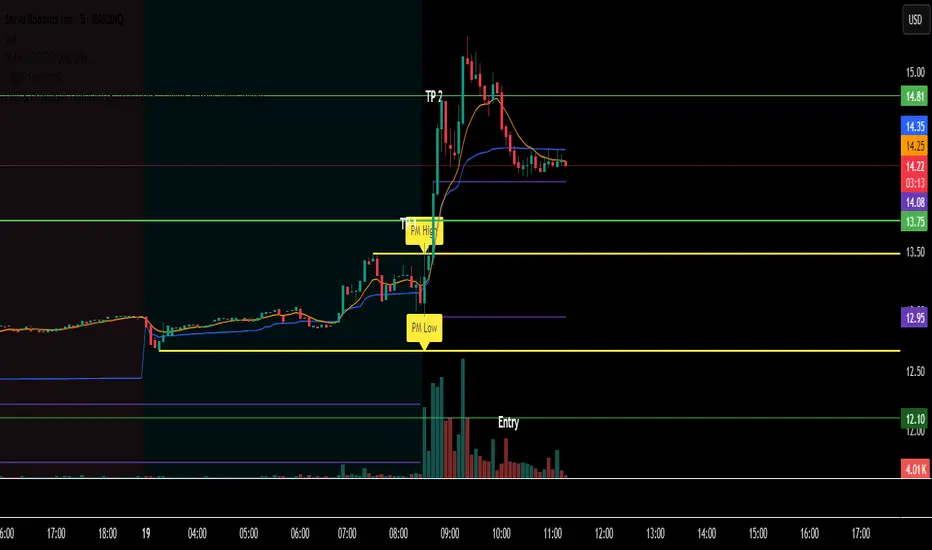
Indicator DescriptionThis indicator is a key part of a trading strategy focused on breakouts and breakdowns. It automatically marks two important price levels:
Premarket High and Low: The indicator identifies the highest and lowest prices reached during the premarket session (4:00 AM to 9:30 AM EST). It then draws these levels as horizontal lines that extend through the rest of the trading day.
Morning Open: It also highlights the first 15 minutes of the regular market open, which is what you use as your "Opening Range Breakout" (ORB) zone. Make sure to change this in settings as 9:30 to 9:45 EST
By clearly plotting these premarket and opening range levels on your chart, this tool helps you visualize key support and resistance zones, which is crucial for trading breakout and breakdown strategies.
Release Notes
Indicator DescriptionThis indicator is a key part of a trading strategy focused on breakouts and breakdowns. It automatically marks two important price levels:
Premarket High and Low: The indicator identifies the highest and lowest prices reached during the premarket session (4:00 AM to 9:30 AM EST). It then draws these levels as horizontal lines that extend through the rest of the trading day.
Morning Open: It also highlights the first 15 minutes of the regular market open, which is what you use as your "Opening Range Breakout" (ORB) zone. Make sure to change this in settings as 9:30 to 9:45 EST
By clearly plotting these premarket and opening range levels on your chart, this tool helps you visualize key support and resistance zones, which is crucial for trading breakout and breakdown strategies.
Open-source script
In true TradingView spirit, the creator of this script has made it open-source, so that traders can review and verify its functionality. Kudos to the author! While you can use it for free, remember that republishing the code is subject to our House Rules.
Disclaimer
The information and publications are not meant to be, and do not constitute, financial, investment, trading, or other types of advice or recommendations supplied or endorsed by TradingView. Read more in the Terms of Use.