OPEN-SOURCE SCRIPT
Updated VCC Impulse 101
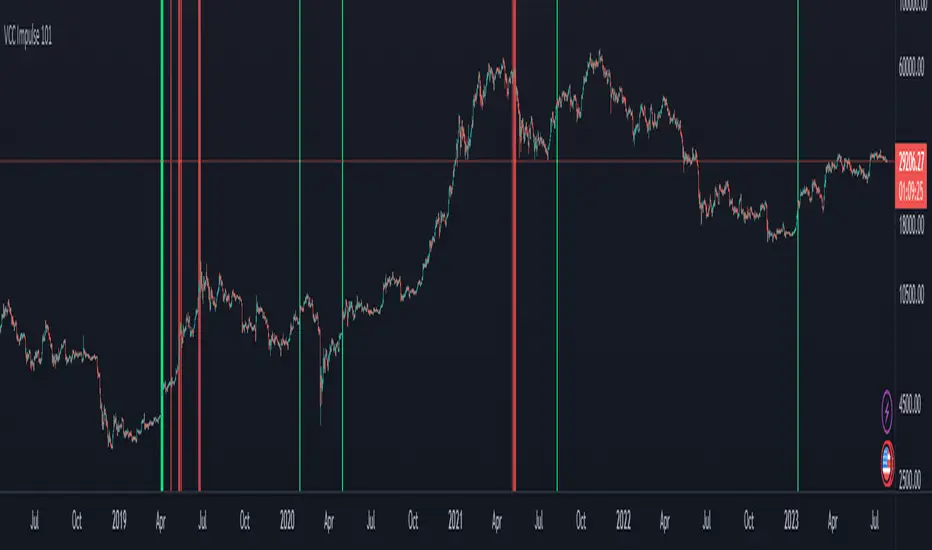
Title = VCC Impulse 101
Version = v1.2.0
Author = Vic Cebedo
A cryptocurrency Buy and Sell signal indicator.
BUY SIGNAL (green background) is triggered if Buy Score (black line) reaches (4) Points.
1 Point is added to Buy Score if:
- The Closing Price is above all Moving Averages (7, 21, 50, 100, and 200), and
- If the 200MA is above the other Moving Averages (7, 21, 50, 100).
1 Point is added to Buy Score if:
- MACD is greater than MACD Signal, and
- MACD is greater than zero, and
- MACD Signal is greater than zero, and
- MACD is greater than previous value.
1 Point is added to Buy Score if:
- SMI is greater than zero, and
- SMI is greater than previous value.
1 Point is added to Buy Score if:
- RSI is greater than 50.
The SELL SIGNAL (red background) is triggered if EITHER Ethereum Sell Score (purple line) OR Bitcoin Sell Score (red line), reaches (-3) Points.
2 Points is deducted from the Ethereum Sell Score if:
- The number of Ethereum Short positions is greater than the Longs.
1 Point is deducted from the Ethereum Sell Score if:
- The Ethereum RSI is greater than 75.
2 Points is deducted from the Bitcoin Sell Score if:
- The number of Bitcoin Short positions is greater than the Longs.
1 Point is deducted from the Bitcoin Sell Score if:
- The Bitcoin RSI is greater than 75.
Release Notes
- Removed the stepline plots.- Indicator overlay is now set to true.
Release Notes
- Removed other indicators in the screenshot.Open-source script
In true TradingView spirit, the creator of this script has made it open-source, so that traders can review and verify its functionality. Kudos to the author! While you can use it for free, remember that republishing the code is subject to our House Rules.
Disclaimer
The information and publications are not meant to be, and do not constitute, financial, investment, trading, or other types of advice or recommendations supplied or endorsed by TradingView. Read more in the Terms of Use.
Open-source script
In true TradingView spirit, the creator of this script has made it open-source, so that traders can review and verify its functionality. Kudos to the author! While you can use it for free, remember that republishing the code is subject to our House Rules.
Disclaimer
The information and publications are not meant to be, and do not constitute, financial, investment, trading, or other types of advice or recommendations supplied or endorsed by TradingView. Read more in the Terms of Use.