OPEN-SOURCE SCRIPT
Updated Ichimoku Kinko Hyo + Fractals

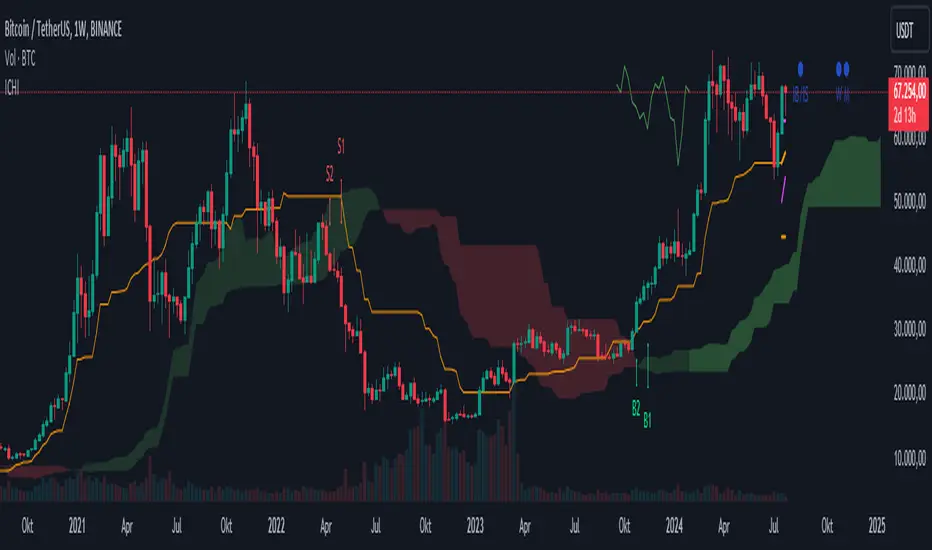
In contrast to my Ichimoku ++ Study this is a pure Ichimoku Konko Hyo Study with Bill Williams Fractals (I couldn't leave out the fractals as these levels are too important for Ichimoku trading).
In this study you can find many visualisation options for the Ichimoku Indicator and the signals the Ichimoku Tradingsystem can provide.
Tenkan-sen and Kijun-sen are provided optionally as mtf levels.
An mtf price cloud relationship is shown in the upper right.
The included signals are:
B1/S1 is a strong filtered signal. The condition for long entry is:
price > Kumo AND Chikou > price AND Chikou > Kumo AND Tenkan > Kijun AND Komo is green
B2/S2 is a less filtered signal. The condition for long entry is:
price > Kumo AND Chikou > price AND Tenkan > Kijun
IB/IS is a confluence signal. The condition for a long/short entry is: more than 50% of the 8 defined conditions must trigger a long signal. Below 50% long, it is a short signal because more than 50% of the entry conditions have triggered a short signal.
Release Notes
Color "code" for Kijun-sen and Tenkan-sen endings added. Release Notes
Fixed Tenkan-sen plot bug.Release Notes
Tooltips added.Release Notes
Code updated. Some more Background signals added.Release Notes
Attributes of some drawn objects Added. Because of output limitations, I can't add more attributes.Release Notes
Script converted to Pine v5.Release Notes
IB/IS signal updated.Release Notes
Screenshot issue.Release Notes
Code updated (signal textcolor).Release Notes
Fixed strange behavior (since a few weeks) of "Ichimoku endings".Release Notes
Tenkan-Sen and Kijun-Sen can now be added separately.Open-source script
In true TradingView spirit, the creator of this script has made it open-source, so that traders can review and verify its functionality. Kudos to the author! While you can use it for free, remember that republishing the code is subject to our House Rules.
Disclaimer
The information and publications are not meant to be, and do not constitute, financial, investment, trading, or other types of advice or recommendations supplied or endorsed by TradingView. Read more in the Terms of Use.
Open-source script
In true TradingView spirit, the creator of this script has made it open-source, so that traders can review and verify its functionality. Kudos to the author! While you can use it for free, remember that republishing the code is subject to our House Rules.
Disclaimer
The information and publications are not meant to be, and do not constitute, financial, investment, trading, or other types of advice or recommendations supplied or endorsed by TradingView. Read more in the Terms of Use.