PROTECTED SOURCE SCRIPT
Updated Statistical Bands
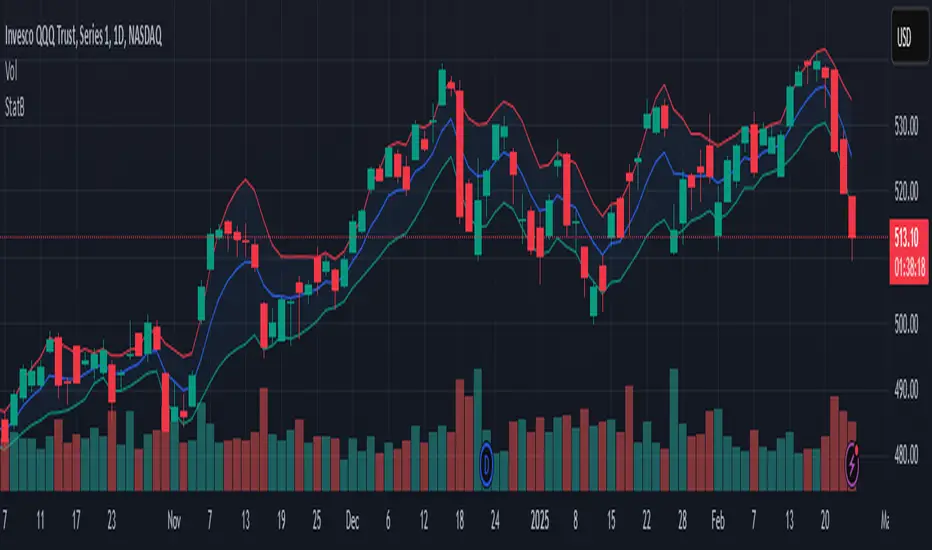
This TradingView indicator, "Statistical Bands" (short title "StatB"), creates a dynamic envelope around a smoothed baseline by combining noise reduction techniques with volatility measurement. It offers several smoothing methods—including various moving averages and a Kalman filter option—and calculates upper and lower bands based on either standard deviation or ATR, allowing traders to visualize potential support/resistance and volatility levels.
Overview
Baseline Calculation:
The indicator computes a baseline from a user-selected source (typically the close price) and smooths it using a chosen algorithm. If the user selects “Kalman,” the script applies a Kalman filter (using user-defined parameters for measurement noise variance (R) and process noise variance (Q)); otherwise, it uses one of several moving averages (SMA, EMA, RMA, WMA, VWMA, or HMA).
Band Formation:
A statistical measure of volatility—either the standard deviation or the Average True Range (ATR)—is calculated over a specified length and then multiplied by a user-defined bandwidth multiplier. The upper and lower bands are obtained by adding or subtracting this value from the baseline.
Visualization:
The indicator plots the baseline and the two bands over the price chart and fills the area between the bands with a semi-transparent color, making it easier to identify potential breakout zones or areas of support and resistance.
This concise yet flexible tool aids traders in assessing current market conditions by highlighting volatility and potential turning points.
Release Notes
Minor bug fixRelease Notes
Input description fixRelease Notes
MA bug fixRelease Notes
BugfixRelease Notes
Updated bandwidth formula to be calculated as standard deviation against selected baseline, not simple moving average. This should improve potential trading results.Protected script
This script is published as closed-source. However, you can use it freely and without any limitations – learn more here.
Disclaimer
The information and publications are not meant to be, and do not constitute, financial, investment, trading, or other types of advice or recommendations supplied or endorsed by TradingView. Read more in the Terms of Use.
Protected script
This script is published as closed-source. However, you can use it freely and without any limitations – learn more here.
Disclaimer
The information and publications are not meant to be, and do not constitute, financial, investment, trading, or other types of advice or recommendations supplied or endorsed by TradingView. Read more in the Terms of Use.