OPEN-SOURCE SCRIPT
Updated hlma_v2.0
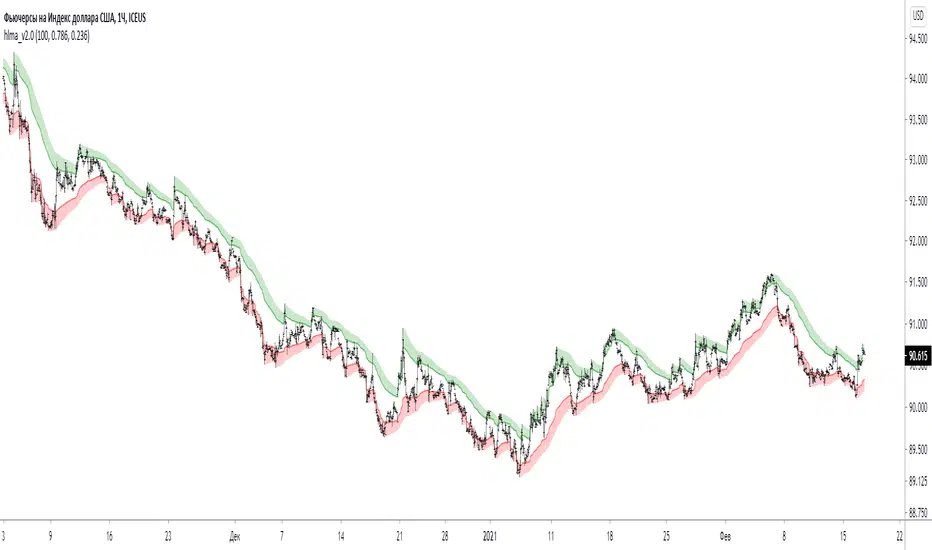
trend indicator, based on new high's and low's mixed with sma high's and low's.
green area is strong bullish trend, red area is strong bearish trend, middle area is range of uncertainty/accumulation/distribution.
green area is strong bullish trend, red area is strong bearish trend, middle area is range of uncertainty/accumulation/distribution.
Release Notes
_Release Notes
_Release Notes
_Open-source script
In true TradingView spirit, the creator of this script has made it open-source, so that traders can review and verify its functionality. Kudos to the author! While you can use it for free, remember that republishing the code is subject to our House Rules.
Disclaimer
The information and publications are not meant to be, and do not constitute, financial, investment, trading, or other types of advice or recommendations supplied or endorsed by TradingView. Read more in the Terms of Use.
Open-source script
In true TradingView spirit, the creator of this script has made it open-source, so that traders can review and verify its functionality. Kudos to the author! While you can use it for free, remember that republishing the code is subject to our House Rules.
Disclaimer
The information and publications are not meant to be, and do not constitute, financial, investment, trading, or other types of advice or recommendations supplied or endorsed by TradingView. Read more in the Terms of Use.