OPEN-SOURCE SCRIPT
Updated MFI Divergence
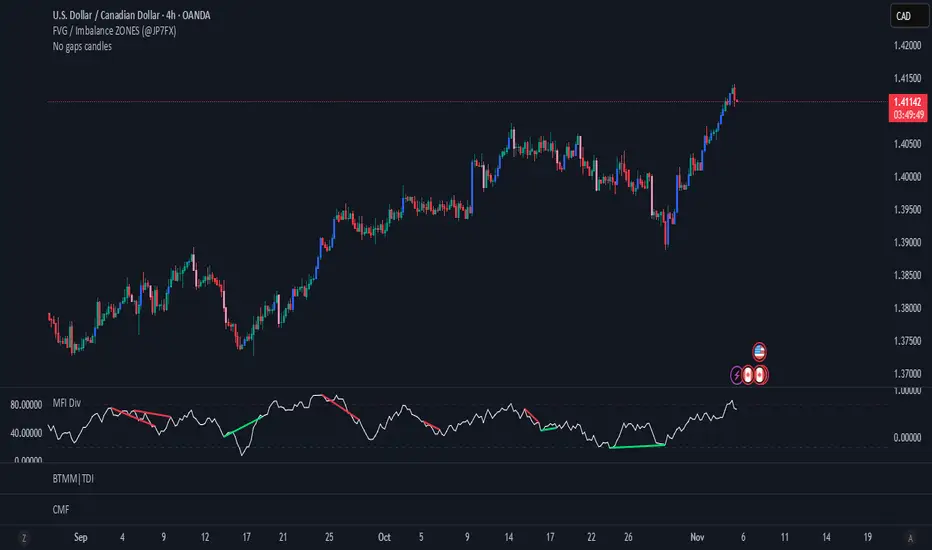
This indicator automatically detects bullish and bearish divergences between price and the Money Flow Index (MFI).
It’s designed for traders who use momentum divergence to anticipate potential trend reversals or continuation traps, and has been optimized to avoid false positives while still catching subtle setups on lower timeframes like 15m.
How It Works
Calculates the Money Flow Index (MFI) using price and volume.
Identifies swing highs and lows on the MFI using adaptive pivot logic.
Compares MFI pivots against corresponding price highs/lows:
Bullish Divergence: Price makes a lower low while MFI makes a higher low.
Bearish Divergence: Price makes a higher high while MFI makes a lower high.
Displays divergences as green (bullish) or red (bearish) lines on the MFI chart.
Release Notes
add center lineOpen-source script
In true TradingView spirit, the creator of this script has made it open-source, so that traders can review and verify its functionality. Kudos to the author! While you can use it for free, remember that republishing the code is subject to our House Rules.
Disclaimer
The information and publications are not meant to be, and do not constitute, financial, investment, trading, or other types of advice or recommendations supplied or endorsed by TradingView. Read more in the Terms of Use.
Open-source script
In true TradingView spirit, the creator of this script has made it open-source, so that traders can review and verify its functionality. Kudos to the author! While you can use it for free, remember that republishing the code is subject to our House Rules.
Disclaimer
The information and publications are not meant to be, and do not constitute, financial, investment, trading, or other types of advice or recommendations supplied or endorsed by TradingView. Read more in the Terms of Use.