PROTECTED SOURCE SCRIPT
Updated Previous Two Day High and Low

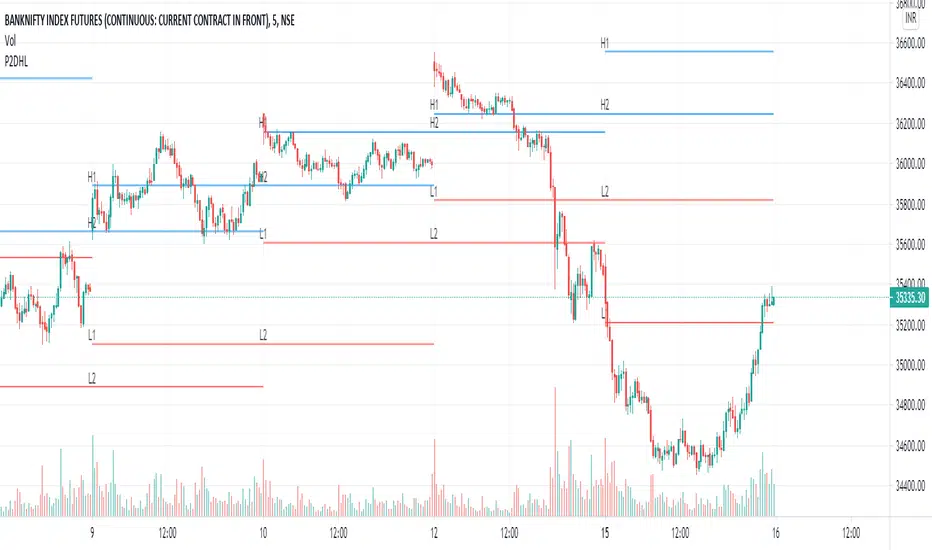
This Script is used to find High Low for previous two days.
H1 is previous day high.
L1 is previous day low.
H2 is day before previous day high.
L2 is day before previous day low.
This H1, L1, H2 and L2 line can be used to determine support and resistance for symbol.
H1 is previous day high.
L1 is previous day low.
H2 is day before previous day high.
L2 is day before previous day low.
This H1, L1, H2 and L2 line can be used to determine support and resistance for symbol.
Release Notes
Added color input for lineProtected script
This script is published as closed-source. However, you can use it freely and without any limitations – learn more here.
Disclaimer
The information and publications are not meant to be, and do not constitute, financial, investment, trading, or other types of advice or recommendations supplied or endorsed by TradingView. Read more in the Terms of Use.
Protected script
This script is published as closed-source. However, you can use it freely and without any limitations – learn more here.
Disclaimer
The information and publications are not meant to be, and do not constitute, financial, investment, trading, or other types of advice or recommendations supplied or endorsed by TradingView. Read more in the Terms of Use.