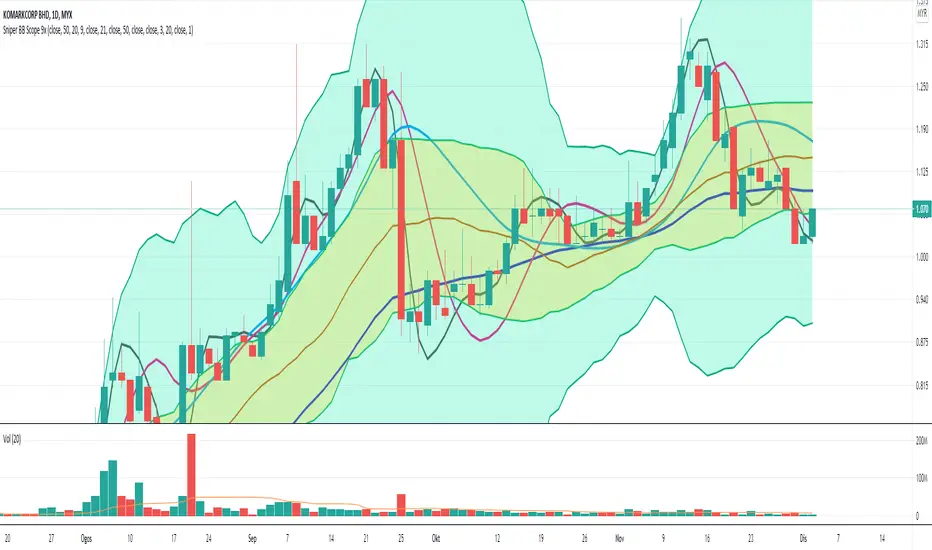
Sniper BB Scope 9x v2.0
1- BB
2- HMA
Component of BB and the improvement
- combining two BB with different standard deviation that will help trader to identify the range of the price movement. The BB seperate by different colors background so that will help trader to easyly find the price trend.
1. Outer BB - dark green background with dark green line boundaries
- bb breakout with volume if reach the upper bb will have potential to surfing upper BB. But please double confirm with others indi for the momentum. If reach peak, then possible to going back to Upper Inner BB or mid BB.
2. Inner BB - yellow background with light green line boundaries
- can act as nearest support if price going retrace from upper BB. Sometime, the price retrace a bit and making support here before push to higher price.
3. Black line
- cross up candle can buy
- cross down candle can sell
4. Red line
- cross up candle can buy
- cross down candle can sell
5. Blue line act as strong support and resistant for the long term position
- If candle trading below blue line, the blue line will act as resistant.
- If candle trading above blue line, the blue line will act as support.
The signal indication
Strong buy signal
When both black and red line cross up the blue line.
Strong sell signal
When both black and red line line cross down the blue line.
- revised more accurate multiple hma calculation
Invite-only script
Only users approved by the author can access this script. You'll need to request and get permission to use it. This is typically granted after payment. For more details, follow the author's instructions below or contact bids_sniper directly.
TradingView does NOT recommend paying for or using a script unless you fully trust its author and understand how it works. You may also find free, open-source alternatives in our community scripts.
Author's instructions
Disclaimer
Invite-only script
Only users approved by the author can access this script. You'll need to request and get permission to use it. This is typically granted after payment. For more details, follow the author's instructions below or contact bids_sniper directly.
TradingView does NOT recommend paying for or using a script unless you fully trust its author and understand how it works. You may also find free, open-source alternatives in our community scripts.